Key takeaways
- Company services publish horizons from 5 minutes (Solcast) to 14 days (Solcast and Solargis). ECMWF’s ensemble runs to 15 days.
- The method follows the horizon. Sky cameras work to about 30 minutes. Satellite cloud tracking suits a few hours. Weather models take over beyond that.
- Our GHI test used one Colorado site, 2017, satellite-derived, daylight only. Smart persistence beat plain persistence from 30 minutes to 6 hours.
- At 1 hour, nRMSE was 28% against 37%. At 24 hours both scored 44% to 45%.
- nRMSE depends on what you divide by: the same 138 W/m² error is 28% of mean sunlight but 14% of 1,000 W/m². Quote the horizon, sample, scale and baseline with every figure.
To compare forecast services in software, see the best solar forecasting software.
Solar power forecasting at a glance
A forecast starts with sunlight, and a PV model then turns it into power. You judge it by its error against what the plant or sky later did, so always state the horizon.
| Item | Detail |
|---|---|
| Key formulas | RMSE = square root of the mean of (forecast minus observed) squared. nRMSE = 100 × RMSE ÷ a stated constant. Skill = 1 − RMSE ÷ reference RMSE |
| Unit and range | W/m² for sunlight, kW or MW for power. No typical error exists: it changes with site, season and horizon |
| Where it matters | Grid reporting, trading bids, maintenance planning, battery dispatch |
| Standard or rule | No single standard. The Solar Forecast Arbiter publishes metric definitions |
| In software | Forecast services deliver by API or file feed. Design tools mostly use a typical year, not a forecast |
Why does solar power forecasting matter for installers and operators?
A forecast tells an operator what a plant will deliver in the next minutes or days. Installers and EPCs may meet it in operations, storage and monitoring work. Solargis and Solcast describe these users on their pages.
- Plant operators report output to grid operators. They avoid penalties for missing it.
- Traders set day-ahead bids in energy markets.
- O&M teams schedule work when output is due to dip.
- Battery and hybrid operators size storage and smooth output.
Design work uses a different tool, such as the best solar simulation software. A typical year or a P50 or P90 figure describes a long-run average. A forecast covers one hour or one day. Our weather data page explains this. A typical year is not an actual run of days.
Which method suits which forecast horizon?
Use sky cameras for the next half hour. Use satellite cloud tracking for the next few hours. Use weather models for the day ahead. The crossover points below are rough. They differ by company.
| Horizon | Typical method |
|---|---|
| Intra-hour (to about 30 min) | Ground sky imagers |
| Intraday (about 30 min to 6 h) | Satellite cloud motion, blended with weather models |
| Day-ahead (beyond about 6 h) | Numerical weather prediction (NWP) |
- Intra-hour: Reuniwatt’s InstaCast covers up to 30 minutes from all-sky imagers. A 2021 review’s table lists sky-image studies at mostly 3 to 15 minutes ahead, with one aiming at 25 minutes.
- Intraday: Solargis tracks clouds in satellite images for up to 3 hours and says accuracy diminishes beyond that. Reuniwatt’s HourCast blends satellite, weather models and AI to 6 hours. A 2013 state-of-the-art report found measured data key for 0 to 6 hours.
- Day-ahead: ECMWF’s ensemble has 51 forecasts at about 9 km, running up to 15 days. Solargis blends several NWP models for up to 14 days.
Weather models do poorly very close to the present. A 2018 NREL report says conventional NWP performs poorly for intra-hour forecasts. A 2022 preprint pooled published studies. It found NWP inputs cut skill by about 9 points within the hour. They raised it for day-ahead. These are regression results across studies. They are not a controlled test.
Two simple baselines anchor every comparison. Persistence says the next value equals the latest one. Smart persistence keeps the latest clear-sky index. It applies it to the clear-sky curve at the target time. The index, k, is measured sunlight divided by clear-sky sunlight. NREL’s report calls smart persistence one of the top models for short-term forecasts.
How do you measure solar forecast error?
Pair each forecast with what was observed. Then average the errors. MAE is the mean absolute error. RMSE weights large misses more.
- Fix one horizon. Solargis warns that mixed horizons misstate each one. It suggests the latest 12 months of data.
- Pair each forecast with the observation at the same time.
- Drop night and low-sun rows, or report them apart.
- Compute MAE, RMSE and bias (the mean error, MBE).
- Divide by a stated scale to get nRMSE. The Solar Forecast Arbiter uses plant capacity for power. It uses no scale for sunlight.
- Compute skill against a baseline: 1 − RMSE ÷ baseline RMSE. Positive means better than the baseline.
Worked example: two baselines on one year of satellite-derived data
At a Colorado site in 2017, smart persistence had lower nRMSE than persistence at every horizon. That held from 30 minutes to 6 hours. At 24 hours the two were level.
Assumptions.
- Data: NSRDB version 3.2.2, cell 401182 (40.53°N, 108.54°W, 2,168 m), year 2017, in 30-minute rows. The file comes from pvlib’s source files (version 0.11.2). Values are satellite-derived, not ground measurements.
- Target: global horizontal sunlight (GHI), not PV power.
- Clear-sky source: the file’s own column. pvlib’s Ineichen model gave nRMSE within 1.1 points at every horizon.
- Daylight filter: only rows with the sun more than 10° above the horizon count (zenith below 80°), at issue and target time.
- Same rows: both methods use the same rows.
- Caveat: the observed values and the clear-sky column come from the same model, which may flatter smart persistence. One site and one year show a method, not a company’s accuracy.
import pandas as pd, numpy as np
d = pd.read_csv("test_read_psm3.csv", skiprows=2)  # pvlib data: NSRDB 2017, 30 min
ghi, cs, zen = d["GHI"], d["Clearsky GHI"], d["Solar Zenith Angle"]
h = 2                                  # 2 rows of 30 min = 1 hour ahead
k = (ghi / cs.where(cs > 0)).clip(0, 1.5)  # clear-sky index at issue time
obs = ghi.shift(-h)
f_persist = ghi                        # persistence
f_smart = k * cs.shift(-h)             # smart persistence
ok = (zen < 80) & (zen.shift(-h) < 80) & k.notna() & obs.notna() & cs.shift(-h).gt(0)
for name, f in [("persistence", f_persist), ("smart persistence", f_smart)]:
    e = (f - obs)[ok]
    rmse = np.sqrt((e**2).mean())
    print(name, e.abs().mean(), rmse, 100 * rmse / obs[ok].mean())
At 1 hour ahead (6,694 pairs, mean observed 493 W/m²) the code gives these results.
| Forecast | MAE (W/m²) | RMSE (W/m²) | nRMSE (% of mean observed) |
|---|---|---|---|
| Persistence | 145.0 | 184.4 | 37.4 |
| Smart persistence | 73.7 | 137.8 | 27.9 |
Smart persistence has skill 1 − 137.8 ÷ 184.4 = 0.25 against persistence.
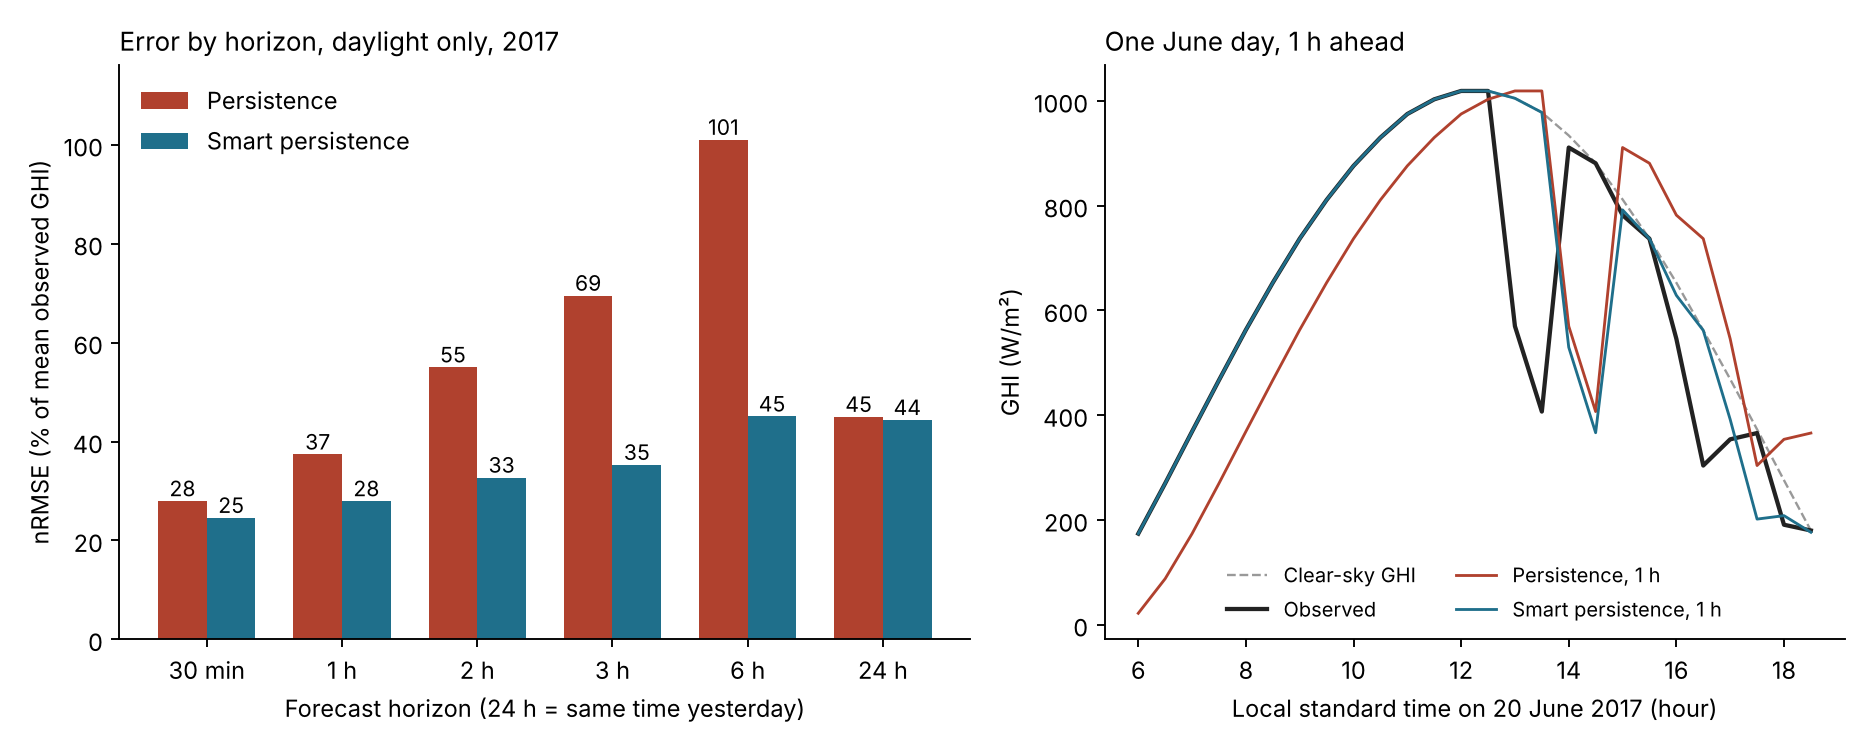
Figure 1. Smart persistence beats persistence from 30 minutes to 6 hours at this site and ties it at 24 hours, when the sun is back at the same height.
| Horizon | Pairs | Persistence nRMSE (%) | Smart persistence nRMSE (%) | Skill vs persistence |
|---|---|---|---|---|
| 30 min | 7,059 | 28.0 | 24.6 | 0.12 |
| 1 h | 6,694 | 37.4 | 27.9 | 0.25 |
| 2 h | 5,964 | 55.0 | 32.7 | 0.41 |
| 3 h | 5,234 | 69.5 | 35.3 | 0.49 |
| 6 h | 3,044 | 101.0 | 45.1 | 0.55 |
| 24 h (same time yesterday) | 7,398 | 45.0 | 44.4 | 0.01 |
Plain persistence worsens with horizon. Part of the reason is that the sun moves, not only the cloud. On 63 clear days (daily spread of k below 0.05 and mean k above 0.9), 1-hour persistence scored 22.0% and smart persistence 2.2%. On 130 variable days (spread of k at least 0.2) they scored 51.7% and 44.3%. On clear days nearly all of persistence’s error is the moving sun.
The scale matters too. The 1-hour smart persistence RMSE of 137.8 W/m² is 27.9% of mean observed sunlight (493 W/m²). Divide by the highest observed value (1,058 W/m²) and the same error is 13.0%. Divide by 1,000 W/m² and it is 13.8%.
Here is a six-row example from 20 June 2017. Forecasts were issued 1 hour ahead for 09:00 to 14:00.
| Target time | Observed (W/m²) | Persistence | Smart persistence |
|---|---|---|---|
| 09:00 | 737 | 563 | 737 |
| 10:00 | 876 | 737 | 876 |
| 11:00 | 975 | 876 | 975 |
| 12:00 | 1,019 | 975 | 1,019 |
| 13:00 | 570 | 1,019 | 1,005 |
| 14:00 | 911 | 570 | 530 |
MAE is 207.7 for persistence and 136.0 for smart persistence. RMSE is 251.4 and 236.1. Both miss the cloud at 13:00 and copy it an hour late at 14:00. Persistence methods cannot see a cloud before it arrives. We chose this day by a fixed rule. It is the June or July day whose six-row nRMSE was closest to the 1-hour yearly figure.
Forecast error calculator
Paste forecast and observed pairs, with an optional third column for a baseline. It returns MAE, RMSE, bias, nRMSE and skill. It skips both-zero rows by default. It warns about unreadable lines. Use a few hundred daylight pairs for a meaningful result.
How solar software handles forecasting
All six services we read state a forecast horizon, but only Solargis and Quartz give an accuracy figure on the pages read. Design tools mostly use a typical year, not a forecast.
| Software | Documents solar forecasts? | Horizon as documented | Method as documented | Accuracy figure on pages read |
|---|---|---|---|---|
| Solcast | Yes | 5 minutes to 14 days ahead. Updates every 5 to 15 minutes | Satellite observations, cloud tracking and weather models | Not stated |
| Solargis Forecast | Yes | Nowcast to 3 hours. Up to 14 days | Satellite cloud motion, then blended NWP models | Examples by site and horizon in its knowledge base |
| Reuniwatt | Partly (exhibitor profile) | 30 min, 6 h, several days (three products) | Sky imagers. Satellite, NWP and AI. Day-ahead weather forecasts | Not stated |
| enercast | Partly (marketplace listing) | 15 minutes to 31 days | Up to 10 NWP models, AI and physical models. Needs plant and meter data | Not stated |
| Forecast.Solar | Yes | Today plus 1 day (free) to plus 6 days (paid) | PVGIS historic sunlight combined with weather-service forecasts | Not stated |
| Quartz Solar Forecast | Yes | 0 to 48 hours, in kW | Machine learning on GFS or ICON weather data | MAE 13.0% excluding night, 0 to 36 h, on 50 PV sites from 2021 (release 1.2.12) |
Ratings use company pages read in October 2026, with the Quartz row re-checked in November 2026 against release 1.2.12. "Not stated" means the pages read give no accuracy figure. "Partly" marks a third-party listing, not the company’s own documentation. The last column quotes each source. It is not comparable across rows. For scored company comparisons, see the best solar forecasting software list.
Common mistakes with solar power forecasting
FAQs
What is a good solar forecast error?
A good forecast beats smart persistence at your site and horizon. At our Colorado site, 1-hour smart persistence scored 27.9% nRMSE. No single figure is good everywhere: Solargis lists RMSD from 4.2% in Dubai at horizon H0 to 19.6% in Singapore at day 2 (D2). Its table gives the percentages without saying what they are divided by, so they are not comparable across sites.
How far ahead can solar power be forecast?
Companies publish horizons up to 14 days. ECMWF’s ensemble runs to 15 days. Accuracy falls with the horizon. Solargis says it deteriorates as the horizon extends. This holds for all locations and climate types.
Is a forecast the same as a P50 or P90?
No, they answer different questions. A forecast predicts one hour or day from current weather. P50 and P90 describe the odds of a long-run yearly total. See P50, P90 and P99.
Can a typical meteorological year serve as a forecast?
No, a typical year cannot do that job. It joins months from different years. So its day-to-day order is not an actual run of days. See weather and solar resource data.
Does forecasting replace an energy yield simulation?
No, the two do different jobs. An energy yield simulation estimates long-run output for a design. A forecast predicts near-term output for a plant that exists.
Related terms
- Nowcasting: forecasts for the next minutes to hours.
- Satellite-derived solar data: sunlight estimated from cloud images.
- Energy yield simulation: the long-run output estimate used in design.
Next step: See which services publish 5-minute to 14-day horizons in the best solar forecasting software list.
Sources
All sources opened October 2026.
- Method and metrics. Solar Forecast Arbiter, metrics. Kumler, Xie and Zhang, NREL/TP-5D00-72290 (2018). Nguyen and Müsgens, skill-score meta-analysis (arXiv 2208.10536). Sharma and Elmenreich, sky-image nowcasting review (2021). Pelland and others, Photovoltaic and Solar Forecasting: State of the Art (2013). ECMWF, medium-range forecasts.
- Companies. Solargis Forecast, Solargis, solar power forecasting, accuracy evaluation and data interpretation. Solcast data specifications and Solcast live and forecast data. Reuniwatt, Intersolar profile. enercast PFS, EEX marketplace. Forecast.Solar account models and home page. Quartz Solar Forecast 1.2.12, PyPI (checked November 2026).
- Example data. NSRDB PSM v3.2.2 file test_read_psm3.csv from pvlib 0.11.2 source files. pvlib 0.16.1 for the Ineichen cross-check. Test code and results file.
Last updated 3 November 2026. Next scheduled review: 30 January 2027.