Key takeaways
- Near shade lands on part of an array, so it needs a 3D scene. Far shade hides the sun from every module at once, so a horizon line is enough.
- Our house shades 35% of the array on average when it shades any of it. Our hills always shade all of it.
- Our invented hills cost 2.1% of yearly roof sunlight. An example house 10 m south costs 7.1%. Together they cost 8.8%, not 9.2%, so do not add the two.
- Direction decides. The same house to the north costs 0.0%, because no sun lies within 55° of north at this latitude.
- The overlap is 0.4 points for a south house and 0.9 points for a south-east house.
- Tools treat sky light under a horizon differently. PVsyst and Aurora reduce it and SolarFarmer leaves it unchanged. Ignoring it would put our hills at 1.2%.
To model near and far shade in software, see the best solar shading analysis software list.
Near vs far shading at a glance
The split is geometry. Near shade falls on some modules and not others. Far shade falls on all of them together.
| Item | Near shading | Far shading |
|---|---|---|
| Objects | Chimneys, dormers, vents, trees, neighbouring roofs, other rows | Hills, ridges, mountains |
| Model | A 3D scene. PVsyst says it needs "a detailed 3D description of the complete PV system and its surroundings" | A horizon line of elevation by azimuth. PVsyst says the sun is either visible or not on the field |
| Effect on the array | Part of it, module by module. Our house never covers the whole array at once (at most 92%) | All of it together. Our hills block all modules in every shaded hour |
| Distance guide | PVsyst says nearer objects need near shadings. Our array is 6.8 m long, so its 10 times is 68 m | Beyond approximately 10 times the PV field size (PVsyst: "typically") |
| Electrical effect | Mismatch. HelioScope says 0.5 to 2.0 times the shading loss without optimisers or microinverters | HelioScope says no extra mismatch |
Why do near and far shading both matter for installers?
A model with only one kind of shade misses real loss. A model that adds the two losses overstates it. Hill sites need both. Flat sites mostly need the near kind.
Roof tools handle what you draw or what LiDAR shows. Aurora says modelling the terrain around a project can be a challenge, so it builds the horizon from elevation data and turns it on by default. JRC says the PVGIS horizon ignores very close houses and trees. Aurora also says the horizon blocks less than 1% of available light in many cases, but much more in hilly regions.
Near shade is where module-level electronics and row spacing matter, because the shade is partial. For the tree-on-roof maths and the solar access and TSRF checks, see shading analysis. For horizon lists, sources and a ridge-angle sweep, see horizon profile.
How is each one modelled?
Near shade is traced in 3D, ray by ray. Far shade is a lookup against a horizon line. A good tool does both and counts a hidden sun position once.
- Build the near scene: roof planes, obstructions, trees and rows, drawn by hand or taken from LiDAR or drone data. See 3D solar modelling.
- At each time step, trace a ray from points on every module to the sun. A ray that hits an object puts that point in shade.
- Build the far scene: a list of azimuth and elevation points. The sun is hidden when its elevation is below the line at its azimuth. Every module loses direct sun together.
- Cut sky light for the part of the sky each obstruction covers. Tools differ here. See the software table.
- Count any sun position or sky patch hidden by both only once. Then pass the result to the electrical model.
PVsyst says nearer objects need its near-shading option. HelioScope says horizon profiles are less precise than keepouts for close objects. The test is geometry: if a shadow edge can cross the array, model the object in 3D.
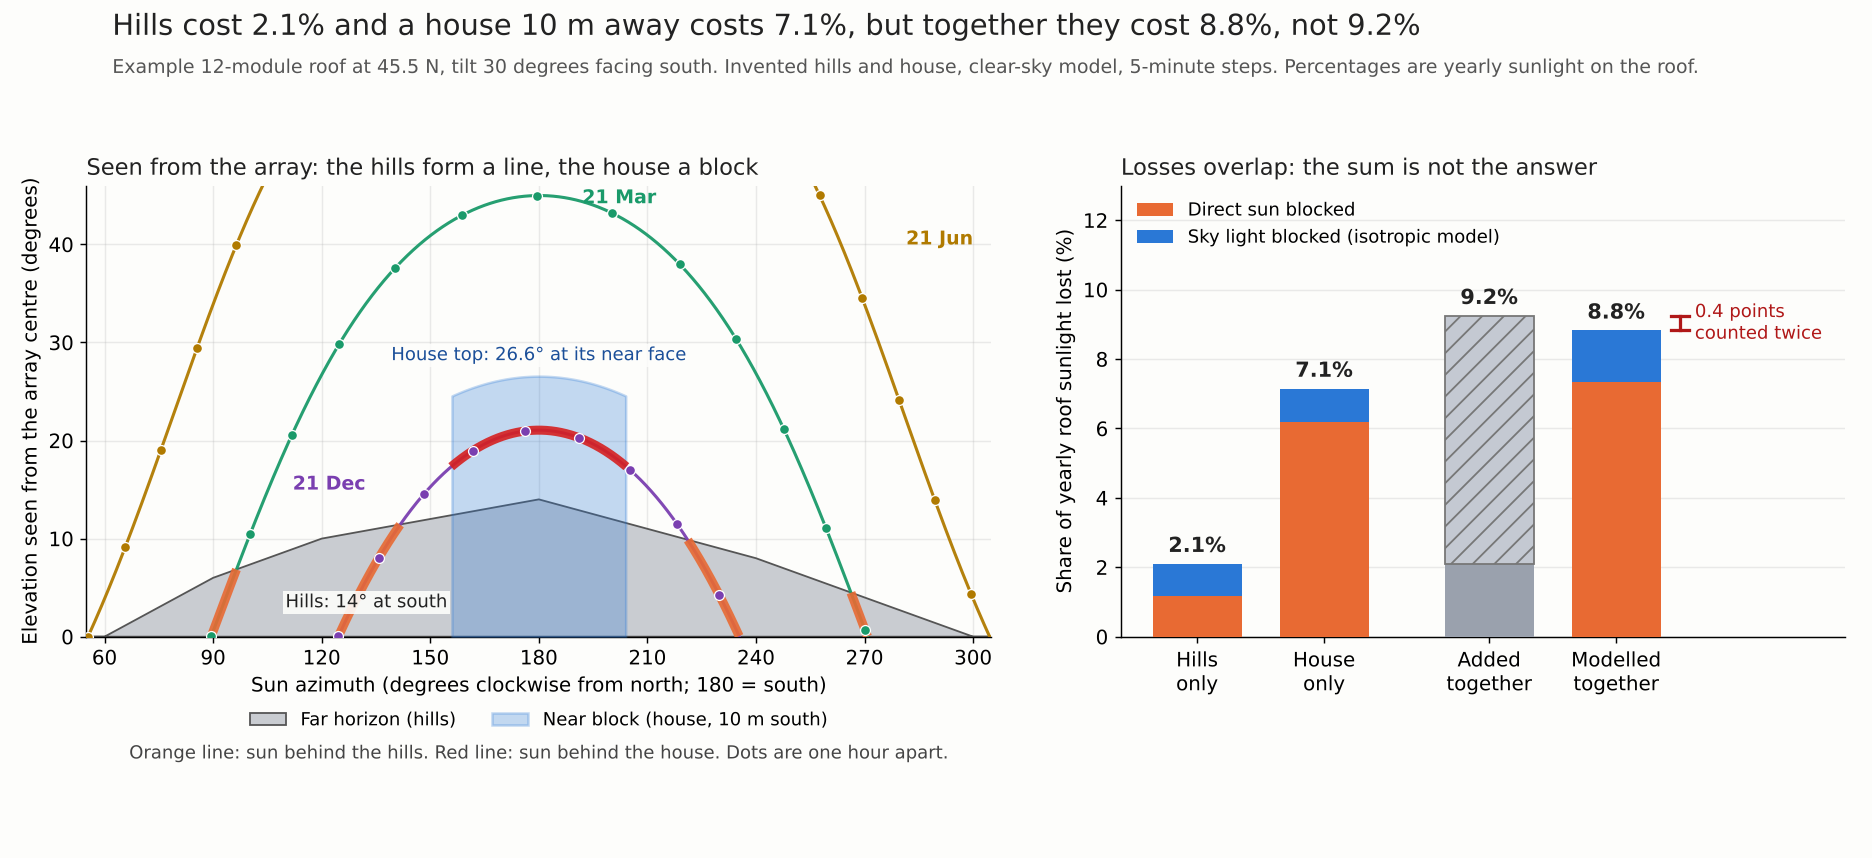
Figure 1. Hills cost 2.1% and a house 10 m south costs 7.1%. Together they cost 8.8%, because the sky they hide overlaps.
Do near and far shading losses add up?
No. The two hide overlapping parts of the sun’s path and of the sky. The combined loss is lower than the sum. In our example it is 8.8% against 9.2%.
- Site and roof: 45.5 N, 122.7 W, 15 m (example coordinates only). Tilt 30°, facing south. Twelve portrait modules, two rows of six, 6.8 m wide and 3.5 m up the slope. Ground albedo 0.2.
- Hills (example): horizon elevation by azimuth, joined by straight lines: 60°:0, 90°:6, 120°:10, 150°:12, 180°:14, 210°:11, 240°:8, 270°:4, 300°:0. Zero elsewhere.
- House (example): an opaque box, 9 m wide and 8 m deep. Its near face is 10 m south of the array centre. Its top is 5 m above the array centre, which is 26.6° at the near face.
- Sky: pvlib 0.16.1, clear-sky (Ineichen, Linke turbidity 3.0), 5-minute steps for 2026. The unobstructed roof total is 2,255 kWh per m², above a real year.
- Loss: direct sun is removed where blocked. Isotropic sky light is cut by the blocked share of the roof’s sky view. Ground-reflected light is not reduced. These are irradiance losses, with no mismatch.
| Case | Direct sun lost | Sky light lost | Yearly roof sunlight lost |
|---|---|---|---|
| Hills only | 1.16% | 0.94% | 2.10% |
| House only | 6.19% | 0.95% | 7.15% |
| The two added together | 7.35% | 1.89% | 9.24% |
| Both modelled together | 7.35% | 1.47% | 8.82% |
Direct sun adds up here. The hills hide low sun at the sides. The house hides the winter midday sun. So no sun position is hidden by both. The 0.4 points counted twice are all sky light.
The loss comes mostly in winter. In December the house costs 47.5% of that month’s sunlight and the hills 9.1%. In June they cost 1.1% and 1.0%, all sky light, and the months from March to September look much like June.
Which side matters?
The south side, in the northern hemisphere. We moved the same house round the array and kept the hills fixed.
| House bearing | House only | Together | Sum | Overlap (percentage points) |
|---|---|---|---|---|
| North (0°) | 0.0% | 2.1% | 2.1% | 0.0 |
| East (90°) | 3.1% | 5.0% | 5.2% | 0.1 |
| South-east (135°) | 7.3% | 8.4% | 9.4% | 0.9 |
| South (180°) | 7.1% | 8.8% | 9.2% | 0.4 |
| South-west (225°) | 7.3% | 8.7% | 9.4% | 0.6 |
| West (270°) | 3.1% | 5.1% | 5.2% | 0.1 |
The north house costs nothing, for two reasons we tested separately. The sun’s azimuth here runs only from 55.7° to 304.3° over the year. So no sun lies within 55° of north. Within 45° of south the sun gives 47% of clear-sky direct energy (our computation). And the north house lies behind the roof plane, so it hides no sky light. The same hill line mirrored to the north costs 0.03%. In the southern hemisphere the north side is the sunny side.
The overlap is largest to the south-east and south-west, where the house stands in front of low-sun hills. The overlap column comes from unrounded values, so it can differ by 0.1 from the rounded columns beside it.
What changes the answer.
- Distance: the same house costs 20.7% at 6 m and 7.1% at 10 m. At 15 m it costs 1.1% and at 20 m 0.25%. The top stays 5 m above the array.
- Height: at 10 m, a top 3 m above the array costs 1.6% and 8 m costs 13.8%.
- Cloudier year, as a proxy: direct sun times 0.6 and sky light times 1.5, a sensitivity and not a weather file. Hills 3.0%, house 7.3%, together 9.4%, sum 10.3%.
Limits. Real hills and houses have sloping edges. One-minute steps give 8.83% together, against 8.82% at five minutes. The figures are sunlight on the roof, not kWh.
The same idea in hours: these two tables count direct-sun hours hidden at the array centre on four days.
| Case | Sun-up (hours) | Hills (hours) | House (hours) |
|---|---|---|---|
| 21 Dec, house south | 8.52 | 2.77 | 3.38 |
| 21 Mar, house south | 12.07 | 1.08 | 0.00 |
| 21 Jun, house south | 15.50 | 0.00 | 0.00 |
| 21 Dec, house south-east | 8.52 | 2.77 | 2.82 |
| Case | Together (hours) | Sum (hours) | Overlap (hours) |
|---|---|---|---|
| 21 Dec, house south | 6.15 | 6.15 | 0.00 |
| 21 Mar, house south | 1.08 | 1.08 | 0.00 |
| 21 Jun, house south | 0.00 | 0.00 | 0.00 |
| 21 Dec, house south-east | 4.08 | 5.58 | 1.50 |
These come from pvlib (example site 122.7 W, UTC-8 clock day, geometric sun elevation). On 21 December the south-east house and hills hide 4.08 hours together. The sum is 5.58.
Near and far shading hours calculator
The two tables above show four pvlib runs of the same sun-hours check. The calculator lets you enter a latitude, a date, one near box and a horizon list. It counts hours of direct sun hidden at the array centre, not energy, and shows the hours counted twice. It stayed within 3 minutes of pvlib on every day we compared.
How solar software handles near and far shading
The column that separates these tools is sky light under a horizon. PVsyst and Aurora reduce it, and SolarFarmer leaves it unchanged. The table lists only what the company pages read say (October 2026).
| Software | Near shading | Far shading | Sky light under a horizon |
|---|---|---|---|
| PVsyst | Yes | Yes | Reduced |
| HelioScope | Yes | Yes | Not stated |
| Aurora Solar | Yes | Yes | Reduced at all hours |
| OpenSolar | Yes | Not stated | Not stated |
| PVGIS | Not by the horizon tool | Yes | Not stated |
| DNV SolarFarmer | Partly | Yes | Unchanged |
Not stated: the company pages read do not say. Partly: the page covers only part of the item.
- PVsyst: near shading needs a detailed 3D description of the system and surroundings. Far shading is a horizon line, with the sun on or off for the whole field. Sky light is reduced: an isotropic integral over the sky the plane sees. Albedo falls with horizon height. Source: PVsyst help: Shadings. Far shadings - Horizon.
- HelioScope: keepout shade uses height and proximity, and shadows are mapped to modules each hour. Far shading is a horizon file of azimuth and elevation points, one per Condition Set. Direct is zero below the line and the array keeps diffuse light. No reduction is stated. Source: HelioScope help: Shade Modeling. Horizon Shading (both updated 8 July 2025).
- Aurora Solar: LiDAR shading counts trees and neighbouring buildings, and vents and chimneys are still drawn. The horizon is automatic, from over 1 million elevation points, and on by default. Source: Aurora help: LIDAR Shading (page timestamp 23 Oct 2026). Aurora blog (modified 1 May 2024).
- OpenSolar: tall objects cast a shade cone. Source: OpenSolar help: Rooftop Obstructions (updated 24 Aug 2026).
- PVGIS: JRC says the horizon tool ignores very nearby houses and trees. Far shading is terrain-based, and you can upload a horizon. Source: JRC PVGIS horizon profile tool.
- DNV SolarFarmer: the far shading page says near shading is examined module by module. The near-shading page is not covered here. The horizon line is supplied and direct is zero for all modules. The manual says it ignores diffuse shading by the horizon. Source: SolarFarmer manual: Far Shading / Horizon Effect (no date shown).
In our example a tool that leaves sky light alone would show the hills at 1.2% instead of 2.1%. For ranked tools that cover shading, see the best solar shading analysis software list.
Common mistakes with near and far shading
FAQs
Do near and far shading losses add up?
No. In our example the hills cost 2.1% and the house 7.1%, which sums to 9.2%. Modelled together they cost 8.8%, because the two hide overlapping sky and sun paths.
What counts as near shading and what counts as far?
Near shade comes from objects whose shadows can fall on part of the array. Far shade comes from distant terrain that hides the sun from the whole array at once.
Does an obstruction on the north side shade a south-facing array?
In the northern hemisphere, rarely. In our example a house 10 m to the north cost 0.0% against 7.1% to the south. The exception is a site far enough north that the summer sun rises north of east, so check high latitudes and tall objects with the calculator above.
Do optimisers help with far shading?
Not much. HelioScope says horizon shading adds no mismatch, so there is nothing for module electronics to recover. They help with near shading, where HelioScope says mismatch is typically 0.5 to 2.0 times the shading loss without them.
Related terms
- Shading analysis: measuring how much sun trees, chimneys and buildings block.
- Horizon profile: the elevation of distant hills at each compass direction.
- 3D solar modelling: the scaled site model that near shade is traced on.
- LiDAR: laser data that gives heights for roofs, trees and neighbours.
- Row spacing and pitch: how far apart rows sit so they do not shade each other.
- TSRF: tilt, orientation and shade combined into one share.
Next step: if your site has hills and roof objects, compare how tools treat sky light under a horizon in the best solar shading analysis software list.
Sources
- PVsyst help: Shadings and Far shadings - Horizon (checked October 2026).
- HelioScope help: Shade Modeling and Horizon Shading (checked October 2026).
- Aurora help: LIDAR Shading and Aurora: What is horizon shading (checked October 2026).
- OpenSolar help: Rooftop Obstructions (checked October 2026).
- JRC PVGIS: Horizon profile tool (checked October 2026).
- DNV SolarFarmer manual: Far Shading / Horizon Effect (checked October 2026).
- Our model: pvlib 0.16.1 (25 October 2026).
Last updated 30 October 2026. Next scheduled review: 30 January 2027.