Key takeaways
- Solar access is energy with shade divided by energy without shade. It weights each hour by its sunlight, so it is not a count of shaded hours.
- It counts shade only. Multiply it by TOF to get TSRF.
- In our invented example (clear-sky model, Boston coordinates, south roof), shade blocks 22.0% of sun-up hours but costs 8.4% of the sunlight. Solar access is 91.6%.
- Weight the months by their sunlight. In our example a simple mean gives 87.4%, against 91.6% weighted, because December carries only 4.6% of the sunlight.
- Programmes print different measures. A California Energy Commission deck prints 70% and 98% annual solar access, and a Massachusetts FAQ prints 80% of "optimal performance".
To get solar access per module or roof face, see the best solar shading analysis software. To take readings on site, see the best solar site survey apps.
Solar access at a glance
Solar access is one percentage per point, module, roof face or site. You can give it for a month or for the year.
| Item | Detail |
|---|---|
| Formula | Solar access = incident energy with shading divided by incident energy with none (Aurora help centre). Annual value = sum of shaded energy over the year divided by sum of unshaded energy. |
| Unit and range | Percent, 0 to 100. Solmetric’s guide says the bars would read 100% with no shade and 0% if shaded all year. A Scanifly sample report on the MassCEC site prints Average Annual 90.98%, summer (May to October) 98% and winter (November to April) 80%. |
| Where it matters | Rebate and code checks, panel placement, production estimates and shade reports. |
| Standard or rule | No single standard. Each programme and tool sets its own method. See the programme table below. |
| In software | Skyline readers, remote 3D design tools and aerial roof reports. Yield simulators may use a shading factor instead. |
Why solar access matters for installers
Most shade reports lead with it, and some programmes check it. A wrong reading can cost you a rebate, a permit or a production promise.
The weighting matters as much as the shade. A skyline that hides the low winter sun looks bad in a monthly chart but costs little yearly energy. Quote the annual figure for energy. Quote the months for the customer’s bill pattern.
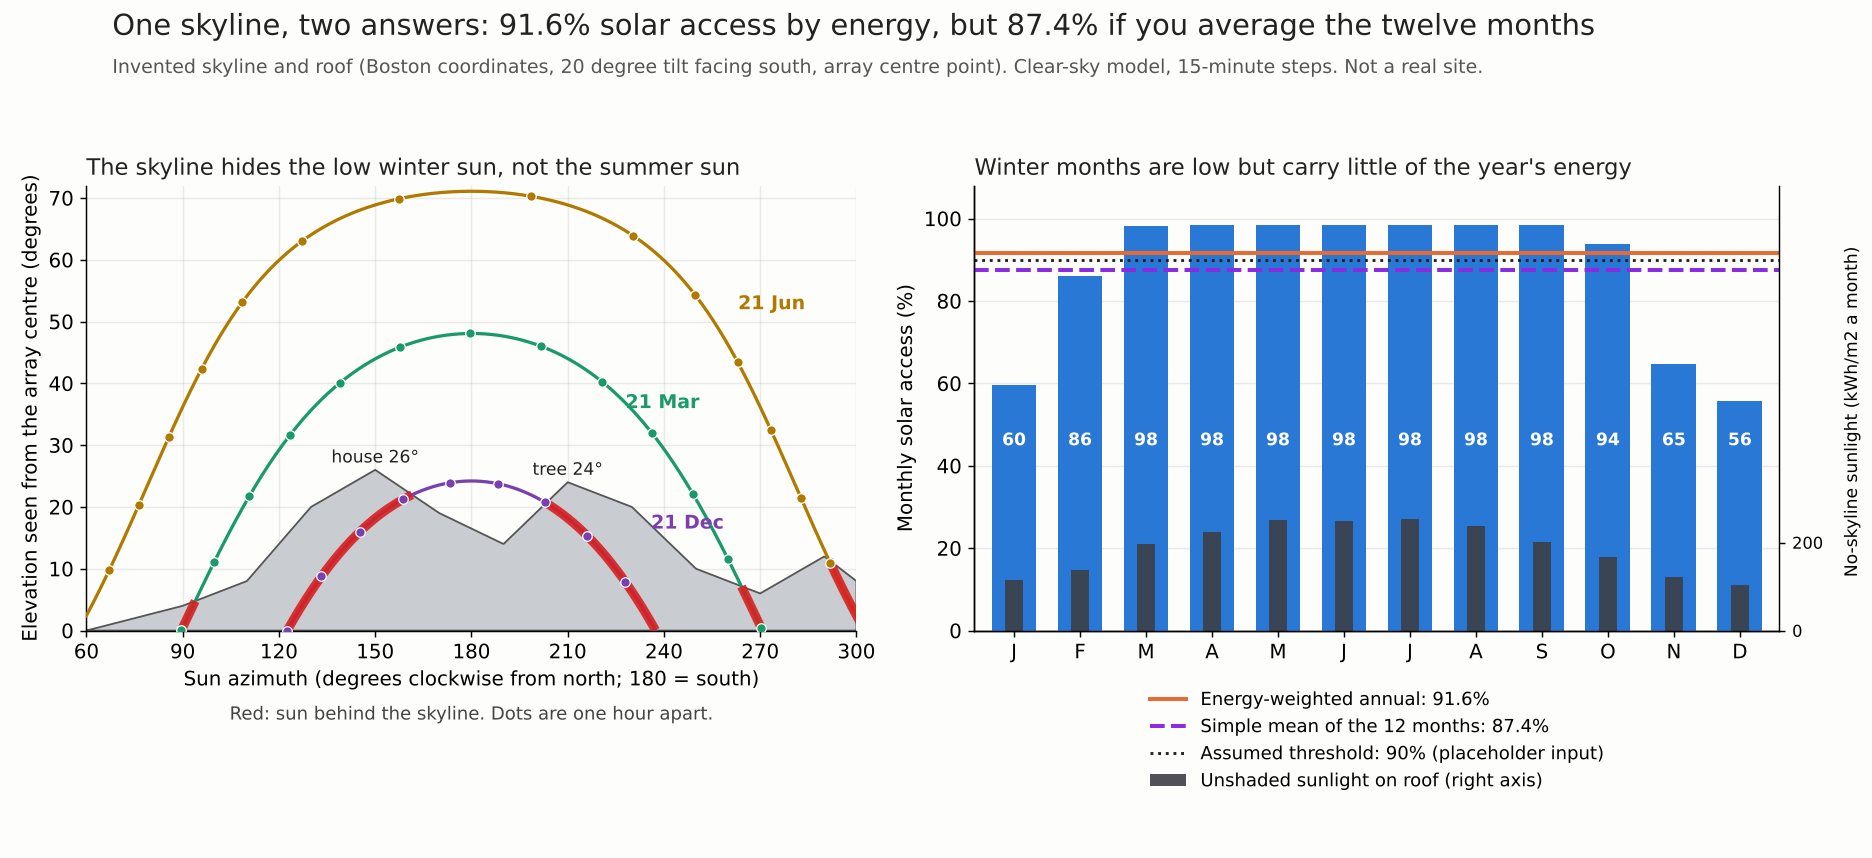
Figure 1. In an example, solar access is 56% in December but 98% from March to September. The energy-weighted year is 91.6%. A simple mean of the months says 87.4%.
How is solar access different from TSRF and shade percentage?
Solar access counts shade only. TSRF multiplies it by the tilt and orientation factor (TOF). "Shade percentage" has no fixed meaning, so its sense depends on who prints it.
- Versus TSRF: TSRF = TOF × solar access. Scanifly’s help page gives a south array with 10% shade a TSRF of 90%. It says annual solar access counts only shade effects. Our TSRF page covers the maths and programme minimums.
- Share of sunlight lost: 100 minus solar access. Solmetric’s guide reads its monthly bars this way, at 100% when unshaded.
- Share of hours blocked: a count of sun-up hours behind an obstruction. In our example it is 22.0% against 8.4% of sunlight lost, because the blocked hours are near sunrise and sunset.
- Share of area shaded: PVsyst’s shading factor is the ratio of the shaded area to the total sensitive area of the field. It does not measure light.
- Labels blur: Scanifly’s MassCEC sample titles a monthly chart "Monthly Solar Access Shade Percentage". Its bars look like access values (high in summer), so check the axis.
"Solar access" also has a legal meaning: the ability to receive sunlight across property lines (Penn State, EME 810). This page covers the energy meaning only.
How is solar access measured?
Three routes exist. A skyline reader records the obstructions at a point. A 3D model works them out for every module. A horizon profile adds distant hills as one line.
| Route | What the company document says | Limit |
|---|---|---|
| Skyline reader (Solmetric SunEye) | Uses NASA clearness indices or NREL TMY3 weather data. Calculates annual, monthly, daily and hourly solar access (Solmetric guide, 2010). A California incentive guide of the same date says the session averages give the twelve monthly numbers for the CSI calculator. | One point per reading. See site survey for spacing. |
| 3D model (Aurora) | Models irradiance at the point from sun position and typical local weather data, every hour of the year (Aurora help). | Relies on the model’s obstruction data. See 3D modelling and LiDAR. |
| Horizon profile | Distant terrain as one elevation line. A CEC slide deck lists "Exclude horizon shading" under its tool requirements. | Your programme’s rule decides whether to include it. See horizon profile. |
Tools differ in detail. Aurora’s article says it uses a 1-hour step and Solmetric a 15-minute step. It also says Solmetric "incorrectly cancels out the diffuse light component" in hours without direct sun. That is Aurora’s claim about a competitor. Compare tools on one roof before you mix their numbers.
How do you calculate solar access?
Model the sunlight on the surface with and without the obstructions. Then divide the two energy totals. Do not average percentages.
- Work out the sun’s azimuth and elevation at every time step.
- Model the sunlight on the surface: direct beam, sky light and ground-reflected light.
- Remove beam light when the sun is behind an obstruction. Cut sky light by the share of the sky view that is hidden.
- Add up shaded energy and unshaded energy for each month. Monthly access is the first divided by the second.
- For the year, divide the summed shaded energy by the summed unshaded energy. The result matches the monthly values weighted by each month’s unshaded sunlight.
Worked example: one skyline, three roof planes
This example’s skyline gives a south roof 91.6% annual solar access, but a simple mean of its months says 87.4%.
- Site: 42.36 N, 71.06 W, 10 m. These are Boston’s coordinates, used as an example. The skyline is example, not surveyed.
- Skyline: twelve azimuth:elevation points, listed below. Elevation is 0 from 330 through north to 60. Linear between points, seen from the array centre.
- Roof planes: 20 degree tilt facing east (90), south (180) and west (270).
- Sunlight: pvlib 0.16.1, Ineichen clear-sky model, Linke turbidity 3.0, albedo 0.2, 15-minute steps for 2026 in UTC-5 standard time.
- Shade: beam removed when the sun is below the skyline. Sky light is isotropic, cut by the cosine-weighted hidden share of the plane’s sky view. Ground-reflected light stays whole.
Example skyline points are listed as azimuth:elevation in degrees. They are 90:4, 110:8, 130:20, 150:26 (a neighbour’s house), 170:19 and 190:14. The rest are 210:24 (a tree), 230:20, 250:10, 270:6, 290:12 and 310:4.
| Roof plane | Annual solar access (weighted) | Simple mean of 12 months | Lowest month | Above assumed 90% (weighted / simple mean) |
|---|---|---|---|---|
| East (90) | 94.3% | 89.0% | 60.4% (Dec) | Yes / No |
| South (180) | 91.6% | 87.4% | 55.7% (Dec) | Yes / No |
| West (270) | 93.6% | 88.8% | 62.9% (Dec) | Yes / No |
Unshaded clear-sky year per m2: east 1,871 and south 2,257 and west 1,871 kWh. Pass or fail is against the assumed 90% threshold.
We chose the 90% as an assumed input to show the method. It is not any programme’s rule. All three planes pass on the weighted figure and fail on the simple mean, so the method changes the result. No source cited says a programme averages months simply. The same skyline gives three answers, because each plane sees a different part of the sky.
| South roof, month | Solar access (%) | Unshaded sunlight (kWh per m2) |
|---|---|---|
| Jan | 59.7 | 115.8 |
| Feb | 86.0 | 138.5 |
| Mar | 98.3 | 197.0 |
| Apr | 98.5 | 224.6 |
| May | 98.5 | 251.1 |
| Jun | 98.5 | 248.7 |
| Jul | 98.4 | 252.7 |
| Aug | 98.5 | 237.1 |
| Sep | 98.5 | 201.0 |
| Oct | 93.9 | 166.1 |
| Nov | 64.7 | 120.7 |
| Dec | 55.7 | 103.3 |
For the south roof, 88.6% of the lost sunlight falls from October to March. Weighting these months by their sunlight gives the annual figure. You can then test that figure against a threshold of your own.
What changes the answer. Hourly steps give 91.8% for the south roof. The 15-minute steps give 91.6%. A cloudier-year proxy (beam times 0.6, sky light times 1.5) gives 91.1% weighted and 87.7% by simple mean.
Limits. The skyline is example and clear-sky. The 2,257 kWh per m2 south total is above a real Boston year. One point stands for each plane, and the sky is isotropic. The model mixes near objects and distant terrain, and California’s rule excludes horizon shading.
Solar access figures programmes print
No common solar access rule appears in the documents below. They print different measures and are not the legal text. Confirm with the programme before you design to a figure.
| Document | What it prints | Date and limits |
|---|---|---|
| California Energy Commission slide deck, 2022 Energy Code, single-family solar PV | Slide for section 150.1(c)14A&B: SARA (Solar Access Roof Area) excludes roof areas under 70% annual solar access. Joint Appendix JA11.3 slide: weighted average annual solar access by panel count of at least 98%. | Deck is undated and says it applies to permits from 1 January 2023. Energy Code Ace’s 2022 and 2025 pages carry the same two figures (see Sources). |
| CEC form CF2R-PVB-01-E, certificate of installation (sample) | Section D asks the installer to confirm the shading matches the annual solar access % in Table B. The instructions say to enter the percent of solar access. The form text cited sets no minimum. | 2025 single-family standards, 1 January 2026. |
| Massachusetts MLP Solar Rebate Program FAQ (mass.gov) | Answer 3, to a question about the "20% shading reduction standard": shading cannot reduce the Solar Access Value of the location below 80% of optimal performance. The analysis must use a tool listed in Section 7 of the Program Manual. | Undated. It also mentions azimuth, slope and tilt, so ask the administrator whether the test is solar access or TSRF. |
Other programmes use TSRF instead, such as Energy Trust of Oregon (post of 17 November 2025). See our TSRF page for those figures.
Solar access calculator
Enter your tool’s twelve monthly solar access percentages and the unshaded sunlight for the same plane, in kWh per m2. The calculator weights each month by its own sunlight to give the annual figure, against a simple mean of the 12 months, and flags whether that annual figure clears an assumed minimum. Preset values are from a worked example, not a real site.
How solar software handles solar access
Three of the five tools report solar access in full, Scanifly in part, and PVsyst uses a shading factor instead. Ratings use company pages read in October 2026. Not stated: the company page we cite does not say.
| Software | Reports solar access? | Method |
|---|---|---|
| Aurora Solar | Yes | Modelled (3D design) |
| Solmetric SunEye | Yes | On site (skyline reader) |
| Scanifly | Partly | Modelled (drone or remote 3D) |
| EagleView Inform Advanced | Yes | Remote (aerial imagery) |
| PVsyst | Not stated | Modelled (yield simulation) |
- Aurora Solar: Defines solar access as shaded over unshaded incident energy, with a 1-hour step for every hour of the year. Help pages show no update date. Gives no threshold.
- Solmetric SunEye: Calculates annual, monthly, daily and hourly solar access, and gives TSRF = Solar Access × TOF. Company PDFs dated 2010. The product page was not available. Check current models.
- Scanifly: Help page defines annual solar access, TOF and TSRF. A sample report on MassCEC’s site shows annual and monthly values. The help pages do not say how it is computed. Pages undated, copyright 2026.
- EagleView Inform Advanced: Lists "Verified Solar Access Values (SAV)" and TSRF for all roof facets. Page modified 14 April 2025. Method not stated. Select US states only.
- PVsyst: Its Shadings help page uses a shading factor, a ratio of shaded to sensitive area, and does not use the term solar access. Page undated. Used for this term only.
To compare shading tools on method and programme acceptance, see the best solar shading analysis software.
Common mistakes with solar access
FAQs
What is a good solar access percentage?
There is no universal figure. The documents cited print 70%, 80% and 98%, each for a different test (see the programme table). In our example, 91.6% for the year still hides a 56% December.
Is solar access the same as shade percentage?
Not always. Solar access is the share of sunlight kept. Shade percentage can mean sunlight lost, hours blocked or area shaded. In our example, sunlight lost is 8.4% and hours blocked are 22.0%.
How do you turn monthly solar access into an annual figure?
Weight each month by its unshaded sunlight. Multiply each month’s access by its sunlight, add the results, then divide by the total sunlight. Check that no month is missing before you trust the result.
Is solar access the same as TSRF?
No. TSRF = TOF × solar access, so solar access counts shade only. Scanifly’s help page gives a south array with 10% shade a TSRF of 90%.
Related terms
- TSRF: tilt, orientation and shade combined.
- Shading analysis: the process that produces solar access.
- Shade report: the document that shows it.
Next step: read your own skyline on site with the best solar site survey apps, or compare shade reports in the best solar shading analysis software.
Sources
- Aurora help centre, Solar Access (no update date seen, checked 30 October 2026).
- Aurora help centre, Key Terms (no update date seen, checked 30 October 2026).
- Solmetric, Understanding the Solmetric SunEye (2010, checked 30 October 2026).
- Using SunEye for California Incentives (May 2010, checked October 2026).
- Scanifly, What are solar access, TOF and TSRF?, solar access viewsheds and sample report on MassCEC (undated, checked October 2026).
- EagleView Inform Advanced (page modified 14 April 2025, checked October 2026).
- PVsyst help, Shadings (undated, checked October 2026).
- CEC slide deck, 2022 Energy Code solar PV, single-family (undated, checked October 2026).
- Energy Code Ace, 2022 Reference Ace: "SARA does not include any roof area with less than 70 percent annual solar access" (checked 30 October 2026).
- Energy Code Ace, 2025 Reference Ace, Appendix JA11.3: weighted average annual solar access by panel count of at least 98 percent (checked 30 October 2026).
- CEC form CF2R-PVB-01-E sample (2025 standards, 1 January 2026, checked October 2026).
- Massachusetts MLP Solar Rebate Program FAQ (undated, checked October 2026).
- Energy Trust of Oregon, partially qualifying arrays (posted 17 November 2025, checked October 2026).
- Penn State EME 810, Solar Rights and Solar Access (checked October 2026).
- pvlib-python documentation for the worked example (own code).
Last updated 30 October 2026. Next scheduled review: 30 January 2027.