Key takeaways
- Points per roof face matter more than the headline density. At the QL2 minimum of 2 per m², a 24 m² face gets about 48 points. A 7.5 m² face gets about 15.
- In the synthetic model, 95% of pitch errors stay within about 1.2° on the large face. On the small one it is 3.6°. Noise is 10 cm.
- A 1° pitch error changes the sloped area of a 6:12 face by about 0.9%.
- Density does not cure bias. Keeping chimney points in the plane fit adds about 0.7° of bias at every density tried. At 2 per m² the 95% error rises from 1.2° to 2.5°.
- A 0.1 m vent pipe has under 1% odds of three points, even at 40 per m². LiDAR also misses walls and anything built after the survey.
To get roof pitch and obstruction heights from LiDAR in a design tool, see the best solar roof measurement software.
LiDAR at a glance
LiDAR adds height to position, so designers can fit roof planes and obstruction heights to real points.
| Item | Detail |
|---|---|
| How it measures | Time for a laser pulse to hit an object and return |
| Unit and typical range | Points per m². USGS QL2 is at least 2 and QL1 at least 8. Aurora says its average rose from 9.2 to about 12.8 in 2022 |
| Where it matters | Remote roof models, pitch, obstruction layout, tree height for shade |
| Standard | USGS 3DEP Lidar Base Specification quality levels (density plus vertical accuracy) |
| In software | Aurora and HelioScope fit designs to LiDAR. Google’s Solar API documents imagery as its source |
Why does LiDAR matter for installers?
LiDAR lets you size a roof before anyone climbs it. But a wrong pitch or a missed obstruction becomes a redesign later.
Pitch drives sloped area and tilt. In the model a 1° error moves the sloped area of a 6:12 face by about 0.9%. Obstruction points drive keep-outs. See keep-out zones. Tree height feeds shading analysis. The risk is age. A survey is a snapshot, so trees, extensions and new builds may be missing.
Which LiDAR source should you use?
Public and company-processed aerial LiDAR suit a first design on a large, open face. Use a drone or a site visit if the face is small, trees are close or the data is old.
| Source | Published density or resolution | Published accuracy | Read it as |
|---|---|---|---|
| USGS 3DEP QL1 | At least 8 per m². Spacing 0.35 m or less | RMSEz 10 cm | Public agency data. The survey year varies by project |
| USGS 3DEP QL2 | At least 2 per m². Spacing 0.71 m or less | RMSEz 10 cm | Same vertical accuracy as QL1 with a quarter of the points |
| USGS 3DEP QL3 | At least 0.5 per m². Spacing 1.41 m or less | RMSEz 20 cm | A 7.5 m² face gets about 4 points |
| Aurora (company, August 2022) | Average 9.2 to about 12.8 per m². Data years 2011 to 2021, average 2018 | No figure given | Company claim. Says 0.7 per m² is acceptable and 4 or more is quite good |
| Google Solar API | Imagery at 0.1 m per pixel (low-altitude aerial) or 0.25 m (high-altitude aerial or satellite) | None on the page read | Imagery-derived, not LiDAR as documented |
| EagleView Inform | 3D models from high-resolution aerial imagery. "an average of 15,000 extracted data points" | "More accurate than measuring by hand" (no figure) | Company claim. LiDAR is not mentioned |
| Drone LiDAR | Scanifly says lower flights give higher density. No figure given | None given | Best for recency. See drone inspection |
| Phone or tablet LiDAR | Range up to 5 m, as AppleInsider reported in 2020 for the iPad Pro scanner. Apple’s spec pages give no range | None read | Suits interiors. A roof from the ground may be out of range |
USGS RMSEz is a vertical accuracy requirement for the dataset, not a roof pitch accuracy. USGS also says a cloud as dense as QL0 that misses QL0 accuracy is classed QL1. Density alone is not accuracy. USGS tables give pulse density per m². Aurora quotes points per m², which is not identical.
How does point density change a pitch estimate?
Density sets how many points land on a face. More points average out noise, but only points that really belong to the plane.
- Points on a face = density x plan area. Density is per m² of ground. So a 6:12 face of 26.8 m² sloped area has 24 m² of plan area.
- Slope error, one standard deviation = noise x sqrt(12) / (run x sqrt(points)).
- Pitch error = slope error / (1 + slope squared).
- Add any bias from wrong points, such as a chimney in the fit. More points do not remove it.
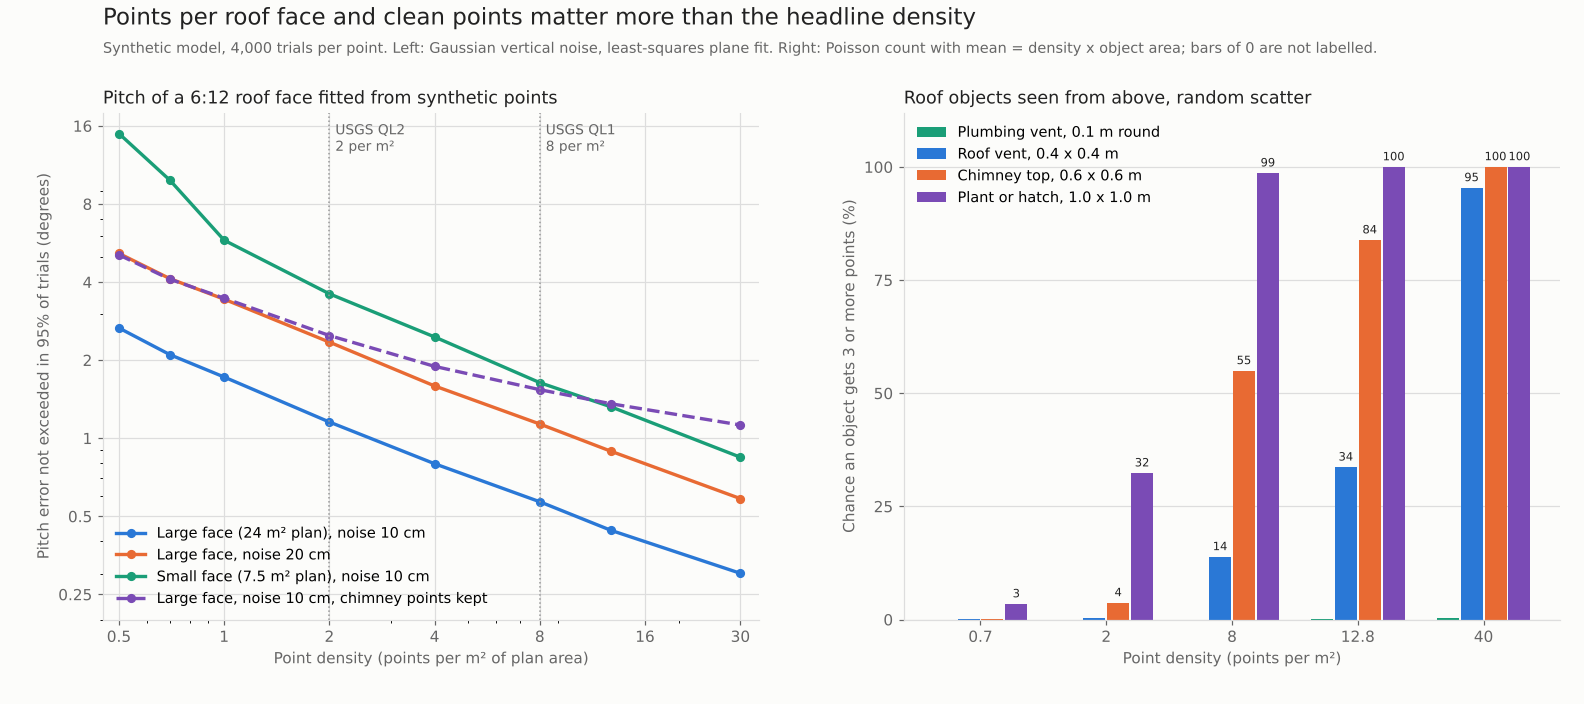
Figure 1. Pitch error falls with density, but a small face needs about 6 times the density of a large one for a similar error. Kept chimney points leave a floor. A 0.1 m vent almost never gets three points.
Worked example: a 6:12 face at QL2 and QL1 density
With 10 cm noise, a 24 m² face at 2 per m² has a 95% pitch error of about 1.2° or less. A 7.5 m² face at the same density reaches about 3.6°.
- Face: a flat plane at 6:12 (26.6°). Large: 4 m run by 6 m wide in plan. Small: 2.5 m by 3 m.
- Points: scattered at random over the plan area. Real scans run in swaths.
- Noise: Gaussian, 10 cm, vertical only. That is the USGS QL1 and QL2 RMSEz requirement, used as a stand-in. USGS does not state it for roofs.
- Fit: least-squares plane. 4,000 trials per row. The code is saved with the page.
- Chimney rows: a 0.6 m by 0.6 m block, 0.8 m tall, at the ridge end. Its points stay in the fit.
Each row is one simulated case. The last two rows keep the chimney points in the fit.
| Case (10 cm noise) | Density per m² / points on face | Pitch error not exceeded in 95% of trials | Within 1° | Sloped area change if read that much too steep |
|---|---|---|---|---|
| Large face, 24 m² plan | 2 / 48 | 1.2° | 91% | 1.0% |
| Large face, 24 m² plan | 8 / 192 | 0.6° | 100% | 0.5% |
| Small face, 7.5 m² plan | 2 / 15 | 3.6° | 43% | 3.5% |
| Small face, 7.5 m² plan | 12.8 / 96 | 1.3° | 87% | 1.2% |
| Large face with chimney points kept | 2 / 48 | 2.5° | 64% | 2.3% |
| Large face with chimney points kept | 8 / 192 | 1.5° | 75% | 1.4% |
A large clean face is fine at QL2. The small face is not: only 43% of fits land within 1°. The chimney rows show about 0.7° of bias that density does not remove. In those rows the 95% error rises from 1.2° to 2.5° at 2 per m², more than the 0.7° bias alone, because bias adds to noise. The step 2 formula matches the simulation within 9% for faces with 20 or more points. Below that it understates the error.
How well does LiDAR show small roof obstructions?
Small objects are often missed. A 0.4 m vent box gets 3 or more points only 14% of the time at QL1 density. Confirm vents on a photo or at a visit.
Each cell shows expected points, then the chance of three or more points.
| Object, seen from above | 2 per m² (QL2 minimum) | 8 per m² (QL1 minimum) | 12.8 per m² (Aurora average) | 40 per m² |
|---|---|---|---|---|
| Plumbing vent, 0.1 m round | 0.02 / 0% | 0.06 / 0% | 0.10 / 0% | 0.31 / 0% |
| Roof vent, 0.4 x 0.4 m | 0.32 / 0% | 1.28 / 14% | 2.05 / 34% | 6.40 / 95% |
| Chimney top, 0.6 x 0.6 m | 0.72 / 4% | 2.88 / 55% | 4.61 / 84% | 14.40 / 100% |
| Plant or hatch, 1.0 x 1.0 m | 2.00 / 32% | 8.00 / 99% | 12.80 / 100% | 40.00 / 100% |
The chance assumes random scatter, so real results vary. Vertical sides get no points from above. That is why a chimney’s height is easier to read than its width.
LiDAR points per roof face calculator
Enter a density, a face size, a pitch and a noise figure. It returns the expected points and pitch error. It also gives the odds that a vent or chimney gets enough points. It reproduces the tables above. It is a model, not a survey.
What can LiDAR not see?
LiDAR sees surfaces that were open to the laser on the survey day. These limits matter for solar designs.
- Vertical faces: a scan from above gets almost no points on walls, so chimney width and wall height are weak.
- Dense canopy: Scanifly says lasers cannot pass through it. A roof under trees may have few roof points.
- Dark or glossy surfaces: Scanifly says they are hard for lasers to detect.
- Anything newer than the survey: Aurora’s data runs from 2011 to 2021. Scanifly says some regions have no update since 2017 or earlier.
- Surveys that skipped buildings: Aurora says some datasets were collected for survey reasons and contain no buildings.
- Fine detail: Scanifly says LiDAR mostly shows general roof outlines.
- Roof condition and structure: points do not show rot, rafters or their spacing.
How solar software handles LiDAR
Aurora and HelioScope document fitting designs to LiDAR, Scanifly does so partly, and Google Solar API and EagleView do not mention it. Rows use company pages checked October 2026.
| Software | Uses LiDAR? | Method | Source |
|---|---|---|---|
| Aurora Solar | Yes | Remote, data from several providers | Aurora help centre and blog, Oct 2026 |
| HelioScope | Yes (2022 post) | Remote, same data as Aurora. Enterprise beta in the 2022 post | Aurora blog on HelioScope, modified April 2024 |
| Scanifly | Partly | Remote or drone | Scanifly blog, Oct 2026 |
| Google Solar API | Not stated | Remote, imagery-derived | Google DataLayers reference, Oct 2026 |
| EagleView | Not stated | Remote, aerial imagery | EagleView Inform Advanced page, Oct 2026 |
- Aurora Solar: "Auto-fit buildings to LIDAR". Mesh or point cloud view. X, y, z offsets. Switchable data source. Says you can check LiDAR age, density and source.
- HelioScope: "Fit to LIDAR" for a field, with height and tilt for flush mount. Obstructions fit to LiDAR heights. Enterprise only and beta in the 2022 post. Current status is not confirmed.
- Scanifly: Explains LiDAR as suited to rough measurements and early designs, and says to confirm on site. The blog shows a LiDAR point cloud captioned as Scanifly Prelim. No help-centre page is cited.
- Google Solar API: Solar data comes from aerial or satellite imagery. DSM output is 0.1 m per pixel. LiDAR is not mentioned.
- EagleView: 3D models and roof geometry from aerial imagery, with TSRF in Inform Advanced. LiDAR is not mentioned.
Not stated: the page we read does not mention LiDAR. Google and EagleView name imagery as their source. Partly: LiDAR is explained but not tied to a product setting. For ranked options, see the best solar roof measurement software, the best 3D solar design software and the best solar design software. There are also residential and commercial lists.
Common mistakes with LiDAR
FAQs
How accurate is LiDAR for roof pitch?
No source read gives a roof pitch accuracy. USGS gives vertical accuracy for the dataset (RMSEz 10 cm for QL1 and QL2). In the model, 95% of pitch errors on a 24 m² face at 2 per m² stay within about 1.2°, with 10 cm noise.
Is LiDAR data free?
Scanifly says the raw data is free, but that packaging it for solar design usually costs money. Aurora names NOAA and USGS among its public sources, alongside other providers.
How many points per m² do I need for solar design?
No source read sets a universal threshold. Aurora calls 0.7 acceptable and 4 or more quite good. Think in points per face. In the model, the large face gets a 95% error near 1.2° with about 48 points. A small face needs more points for the same error: at 96 points it reaches 1.3°.
Does Google’s Solar API use LiDAR?
The DataLayers reference says solar data is derived from aerial or satellite imagery, processed at 0.1 m or 0.25 m per pixel. It does not mention LiDAR. Other Google pages are not covered here.
Can I scan a roof with iPhone LiDAR?
This page cannot confirm an iPhone’s LiDAR range, because Apple’s spec pages list a LiDAR Scanner without one. AppleInsider reported in 2020 that the iPad Pro scanner reaches up to 5 m. A two-storey eave can be further away than that.
Related terms
- 3D solar modelling: building a roof and site model in three dimensions for design and shade.
- Roof measurement: getting roof area, pitch and edges from imagery, LiDAR or a visit.
- Keep-out zone: the roof area left free around vents, chimneys and edges.
Next step: run your smallest roof face through the calculator, then see which tools in the best solar roof measurement software list read pitch from LiDAR.
Sources
- USGS 3DEP, Topographic Data Quality Levels (checked October 2026).
- Aurora, LIDAR: what it is, how it works, and a huge update (August 2022, checked October 2026).
- Aurora, LIDAR in Aurora: your questions answered (February 2023, checked October 2026).
- Aurora help centre, Tips for an accurate site model: LIDAR (checked October 2026).
- Aurora, LIDAR in HelioScope (October 2022, modified April 2024, checked October 2026).
- Scanifly, What is LiDAR and why should you care? (January 2024, checked October 2026).
- Google Maps Platform, Solar API dataLayers reference (checked October 2026).
- EagleView, Inform Advanced (checked October 2026).
- AppleInsider, Apple’s LiDAR Scanner in the iPad Pro and GIM International (checked October 2026).
Last updated 30 October 2026. Next scheduled review: 30 January 2027.