Key takeaways
- The shading analysis is the calculation. The shade report is the document you hand over. All six tools in the software table generate a report of some kind, and the contents differ.
- Of the 4 programmes we read (3 live, 1 closed), all want shading evidence for each array or roof face. Energy Trust of Oregon and Rhode Island also say where on the roof to measure.
- We read no AHJ document and one lender document, a Fannie Mae job aid, which does not mention shading. Companies say financiers and AHJs may read these reports, so ask yours.
- Read the months as well as the year. In our Denver example the lowest month is 64.6%.
- A plain average of months gives 85.5%, against a weighted 88.2%.
To produce a shade report in software, see the best solar shading analysis software.
Shade report at a glance
A shade report turns a shading analysis into pages that a reviewer or customer can check. There is no single format.
| Item | Detail |
|---|---|
| Formula | Annual solar access = sum of (monthly solar access × monthly sunlight) ÷ sum of monthly sunlight. TSRF = TOF × solar access. |
| Unit and range | Percent per array or roof face. Our Denver example: 88.2% a year, 64.6% in the lowest month. |
| Where it matters | Incentive and loan applications, customer proposals, production promises. |
| Standard or rule | No single format. Each programme names its own tools, fields and limits. |
| In software | Design tools and handheld tools export one, with different contents. |
Why does the shade report matter for installers?
It is the evidence a reviewer sees. A report that misses a field, or measures the wrong place, can stall an application.
NY-Sun’s guide to common application errors lists an inaccurate shading report as one of its top ten oversights. If you share the report with the customer, its numbers become part of your promise.
Who asks for a shade report?
Incentive programmes are the clearest requesters. We read no AHJ document and only one lender document. Limits on TSRF are on our TSRF page.
| Requester | What the sources say | Source and date |
|---|---|---|
| Energy Trust of Oregon (incentive) | Trade allies upload a shade report from an approved tool to PowerClerk. HelioScope users upload its Shade Report and Production Report. | Energy Trust pages (requirements page modified 13 Jan 2026). HelioScope guide (02/2025) |
| Energy Trust of Oregon, partly qualifying arrays | These arrays need a report showing where each reading was taken, and remote tools are not allowed for them. | Energy Trust pages. Scanifly draft PDF |
| Rhode Island Renewable Energy Fund (incentive) | Lists approved tools. Wants readings at all four corners of each array and obstructions within 100 ft modelled. On-site measurement takes precedence. | Commerce RI Minimum Technical Requirements, version 2025-12 |
| Rhode Island, edited reports | A report that assumes a removed obstruction needs proof of removal. | Commerce RI Minimum Technical Requirements, version 2025-12 |
| NY-Sun (incentive) | The shading report must reflect the actual site, not be taken from the ground, and cover each roof face with a different orientation. | NYSERDA "Top Ten Project Application Oversights" (undated) |
| Mass Solar Loan (state loan programme, closed) | Asked for a copy of the shading analysis for each project, with separate skylines for each array with a different tilt or azimuth. | MassCEC technical requirements (footer 13 Sep 2021) |
| Lenders and AHJs | No requirement found. We read no AHJ document. Fannie Mae’s solar legal-review job aid for lenders does not mention shading. | Fannie Mae job aid (18 Mar 2020) |
| Customers and financiers (company statements) | HelioScope says remote reports suit "rebate authorities and solar financing agencies". Solo says its report helps AHJs and owners. | Company pages, Oct 2026 |
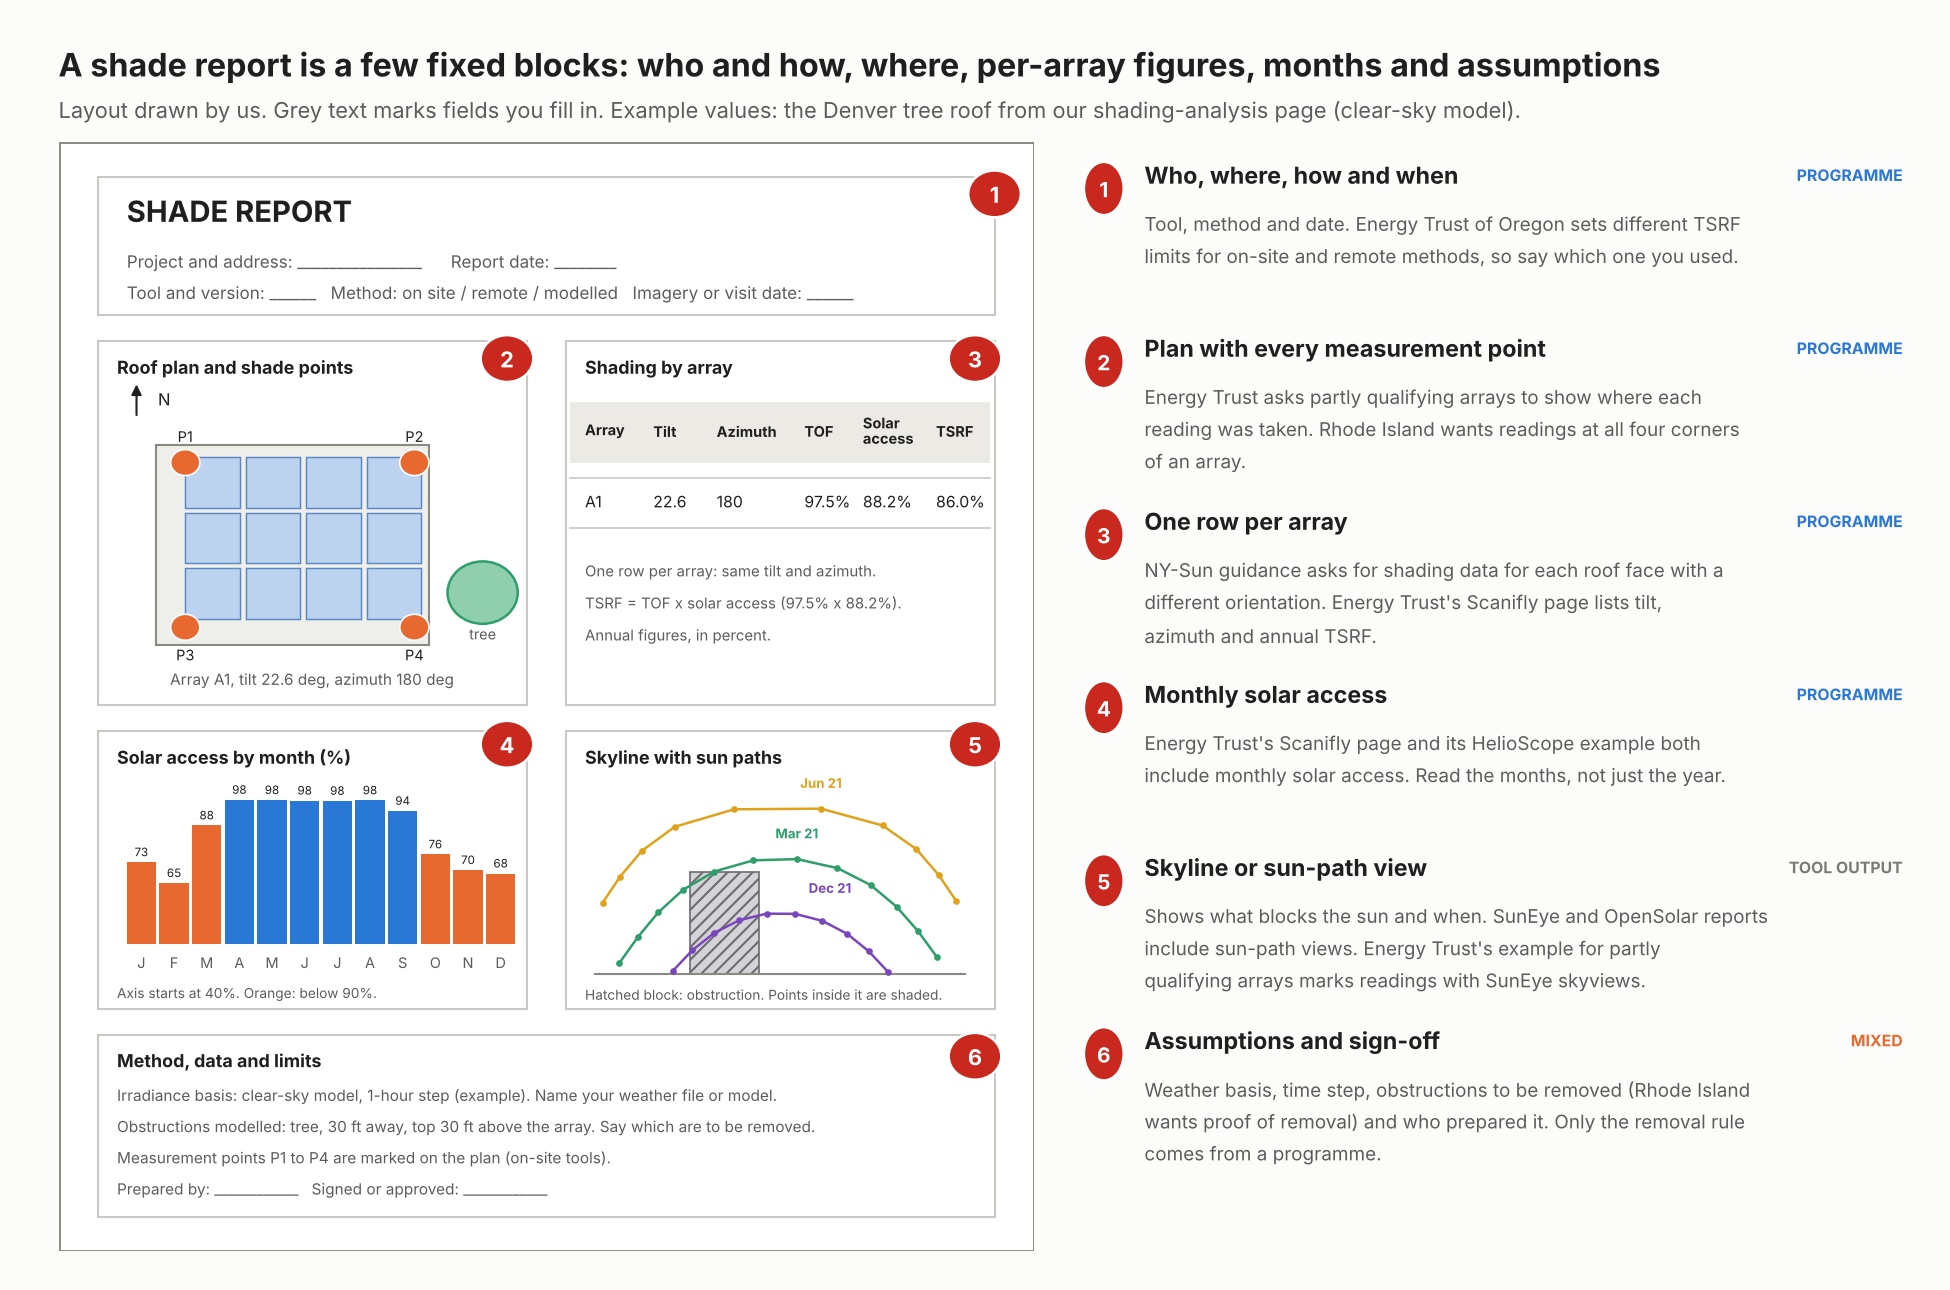
Figure 1. Four of the six blocks in a shade report match a programme document we read. The skyline view is tool output, and the assumptions block is mixed.
What goes in a shade report? Nine minimum fields
At a minimum, show the site, the method, one row per array, the monthly and annual figures, and where you measured. Rows marked "our suggestion" come from no programme document.
| Field | Why it is there | Asked by |
|---|---|---|
| Site and report date | Ties the report to one project | NY-Sun (actual site). Date: our suggestion |
| Tool and method (on site, remote, modelled) | Limits and approved tools differ by method | Energy Trust, Rhode Island |
| One row per array or roof face | One average hides a shaded face | NY-Sun, Rhode Island, MassCEC |
| Tilt and azimuth | Lets a reviewer check TOF | Energy Trust (Scanifly page 2) |
| Monthly solar access | Shows when the loss happens | Energy Trust (Scanifly page 2, HelioScope example) |
| Annual TSRF per array | The figure Energy Trust and Rhode Island set limits on | Energy Trust, Rhode Island |
| Where each reading was taken | Shows the weakest point was measured | Energy Trust (partly qualifying arrays), Rhode Island |
| Obstructions modelled and removal status | A tree you plan to cut is not shade in the report | Rhode Island (100 ft, proof of removal) |
| Irradiance basis and time step | Lets you compare two tools fairly | Our suggestion |
How do you read a monthly solar-access table?
Read the low months, then weight them by how much sunlight each month brings. Equal dips cost less in a low-sun month than in July. July carries more of the year’s sunlight.
- Confirm the unit: percent of unshaded sunlight on that array’s plane, month by month.
- Take each month’s share of yearly sunlight on the plane. That is its weight.
- Multiply each month’s solar access by its weight, add the results and divide by the total weight.
- Subtract each month’s solar access from 100 and weight it. This shows when the loss falls.
- Multiply the annual figure by TOF to get TSRF. Then compare it with your programme’s limit.
The Denver tree example from our shading analysis page shows the idea. Weights are that roof’s clear-sky monthly sunlight.
| Month | Solar access | Share of yearly sunlight | Share of the annual loss |
|---|---|---|---|
| Jan | 73.1% | 6.0% | 13.7% |
| Feb | 64.6% | 6.6% | 19.9% |
| Mar | 88.1% | 8.9% | 9.0% |
| Apr | 98.5% | 9.6% | 1.2% |
| May | 98.4% | 10.5% | 1.4% |
| Jun | 98.2% | 10.2% | 1.6% |
| Jul | 98.1% | 10.4% | 1.7% |
| Aug | 98.3% | 9.9% | 1.4% |
| Sep | 94.0% | 8.7% | 4.4% |
| Oct | 76.3% | 7.6% | 15.4% |
| Nov | 69.9% | 6.1% | 15.5% |
| Dec | 68.5% | 5.6% | 14.9% |
- Annual figure: weighted, 88.2%. A plain average gives 85.5%. That overstates the loss by 2.7 points, because the shaded months are the low-sun months.
- Where the loss sits: February has the lowest access (64.6%) and the largest share of the loss (19.9%). October to March carry 88%.
- TSRF: TOF is 97.5% on this plane, so TSRF is 86.0% (same clear-sky model).
- Weights matter a little. Weighting the same table with typical-year sunlight from Phoenix and Des Moines gives 87.4% to 89.1%. That is a 1.7-point spread. It tests the weights only, not a real site.
- The error can flip sign. An invented table with shade from April to September gives a plain average of 96.5% and a weighted 95.4% to 96.1%. Here the plain average hides loss.
The weighted figure is exact when each month’s value is energy-weighted. The weights must be the tool’s own unshaded sunlight. Our table gives 88.22% against the hourly model’s 88.24%, and the gap is rounding. With another weather basis the result is an estimate, so report the tool’s own annual number.
Monthly to annual solar access calculator
Enter 12 monthly percentages. Then pick a weight set, or type your own weights from your tool’s monthly sunlight. It reproduces the table above.
How solar software handles the shade report
HelioScope and Aurora list TOF, solar access and TSRF in the report they produce. OpenSolar shows monthly charts only with the SAM calculator, and Solmetric’s page does not mention TSRF. Only company pages are used here, and your programme decides which method it accepts.
| Software | Outputs a shade report? | Method |
|---|---|---|
| HelioScope | Yes | Modelled (3D design) |
| Aurora Solar | Yes | Modelled (3D design). Run Irradiance and LiDAR first |
| Scanifly | Yes | 3D model with viewsheds |
| Solargraf | Yes | Remote (3D model from aerial imagery and LiDAR) |
| OpenSolar | Yes | Modelled (3D design with ray tracing on) |
| Solmetric SunEye-210 | Yes | On site (handheld fisheye camera) |
- HelioScope: a "View Shade Report" button gives TOF, solar access and TSRF for every module, summarised by field segment. The help article names Optimal POA as a report value. Source: HelioScope blog (undated) and help centre, Oct 2026.
- Aurora Solar: it generates a shade report with project and customer details plus annual TOF, solar access and TSRF. Not available on Basic. Monthly figures are not mentioned. Source: Aurora help centre, Oct 2026.
- Scanifly: it exports a PDF with a cover, summary, monthly estimated production, simulation details and a losses summary. The Full PDF breaks down each viewshed. The Short PDF gives one summary per array. The help page does not name TSRF, although Energy Trust’s Scanifly report lists monthly solar access and annual TSRF. Source: Scanifly help centre, Oct 2026.
- Solargraf: the report can be downloaded from the design tool for upload to Energy Trust. The 2021 launch post lists solar access, TOF and TSRF for each roof surface, roof measurements and a heat map. Source: Solargraf blog posts, Oct 2026 (launch post 17 May 2021).
- OpenSolar: it generates a shading report from Project, then Manage. A sun-path diagram is always included. Solar access, TOF, TSRF and monthly charts appear only with the SAM calculator. Export format is not stated. Source: OpenSolar support article, Oct 2026.
- Solmetric SunEye: the software exports PDF or HTML reports. Data views include monthly solar access and annual sun path. The product page does not mention TSRF. Source: Solmetric product page, Oct 2026.
For scores, prices and programme acceptance, see the best solar shading analysis software list.
Common mistakes with shade reports
FAQs
What is a shade report used for?
It shows a reviewer or customer how much shade reduces sunlight on each array. In the programmes we read, it supports an incentive or loan application. One company says owners and AHJs also read it.
Is a shade report the same as a shading analysis?
No. The shading analysis is the measurement or model. The shade report is the document that presents its results, with the site, method and assumptions around them.
Do I need a shade report for a solar permit?
We read no permit rule that requires one. Incentive programmes such as Energy Trust, Rhode Island and NY-Sun ask for one, but permit packages are set locally, so ask your AHJ. See the permit plan set page for what plan sets usually hold.
How do I turn monthly solar access into an annual figure?
Weight each month by its share of yearly sunlight on the array plane, then sum. In our Denver example that gives 88.2%, against 85.5% for a plain average.
Can a remote shade report qualify for an incentive?
Sometimes. Energy Trust of Oregon accepts approved remote tools, with a different limit from on-site readings, but not for partly qualifying arrays. Rhode Island lists remote applications and still lets on-site readings win.
Related terms
- Shading analysis: the calculation behind the report.
- TSRF: TOF times solar access, the figure most programmes test.
- Solar access: the share of unshaded sunlight a spot receives.
- SketchUp solar plug-in: an add-on that brings PV design tools into SketchUp models.
Next step: before you submit, check each field in your report against your programme’s current manual, then compare tools in the best solar shading analysis software list.
Sources
All sources checked October 2026.
- Programmes. Energy Trust, Scanifly approved. Energy Trust, shade analysis requirements. Energy Trust, partly qualifying arrays. Energy Trust, HelioScope guide. Energy Trust, Scanifly shade report draft. Commerce RI, Renewable Energy Fund minimum technical requirements. NYSERDA, Top Ten Project Application Oversights. MassCEC, Mass Solar Loan technical requirements. Fannie Mae, solar legal-review job aid.
- Companies. HelioScope, Announcing Shade Reports. HelioScope, TSRF. Aurora, Generating Bankable Shade Reports. Scanifly, Shade Report. Solargraf, shade report launch post. Solargraf, Energy Trust approval. OpenSolar, shading report. Solmetric SunEye-210. Solo, shade reports.
- Data and tools. NREL System Advisor Model repository, typical-year weather files (Phoenix and Des Moines). pvlib repository test data (NW Colorado typical year). pvlib python 0.16.1. SolarSoftwares shading-analysis results (Denver example), October 2026.
Last updated 30 October 2026. Next scheduled review: 30 January 2027.