Key takeaways
- With a 60° rotation limit, our tracker makes 19% more annual DC energy than fixed tilt in Phoenix and 12% more in Des Moines.
- Fixed rows sit at 0.45 GCR and tracker rows at 0.35.
- The gain is seasonal. In December the tracker makes 13% less than fixed tilt in Phoenix and 20% less in Des Moines.
- That layout needs 29% more land per MWdc (3.24 against 2.52 acres, array only). Energy per acre falls 7% in Phoenix and 13% in Des Moines.
- At the same GCR the gain shrinks as rows move closer. In Phoenix it falls from 22% at GCR 0.25 to 10% at 0.60.
To lay out trackers in software, see the best utility-scale solar design software. For yield and backtracking, see the best solar simulation software.
Single-axis tracker at a glance
Four inputs set a single-axis tracker: axis direction, rotation limit, GCR and whether it backtracks. The table gives our values and results.
| Item | Detail |
|---|---|
| Motion | Rotates about one axis. A horizontal north-south axis faces east in the morning and west in the evening. |
| Inputs we modelled | Axis tilt 0°, axis azimuth 180°, rotation limit 60° each way, GCR 0.20 to 0.60, backtracking on and off. |
| Backtracking starts | When the ideal rotation angle passes arccos(GCR): 69.5° at GCR 0.35 and 53.1° at 0.60. This matched pvlib’s output. |
| Modelled gain over fixed tilt | 19% in Phoenix and 12% in Des Moines (fixed 0.45 GCR, tracker 0.35 GCR). |
| Standard or rule | No single standard sets the gain. It depends on site, GCR, rotation limit and tariff. |
| In software | SAM and pvlib document single-axis tracker and backtracking models. |
Why does a single-axis tracker matter for installers?
A tracker raises energy per kWdc but needs more land and moves output toward summer. At the time of checking, the 2026 edition of Lawrence Berkeley National Laboratory (LBNL) data reported that 96% of US utility-scale capacity added in 2025 used single-axis tracking. Other editions cover other years. Installers who quote smaller ground arrays face the same choice.
Money. More energy per kWdc only pays if it beats the extra cost and land. Compare cost per lifetime kWh. See LCOE.
Timing. In Phoenix, May to August carry 42% of annual tracker output, against 36% for fixed tilt. Test the shape against the tariff. See tariff rate database and net metering.
Risk. Winter output falls below fixed tilt (Figure 1B). Slope, rows and foundations are in ground-mount design.
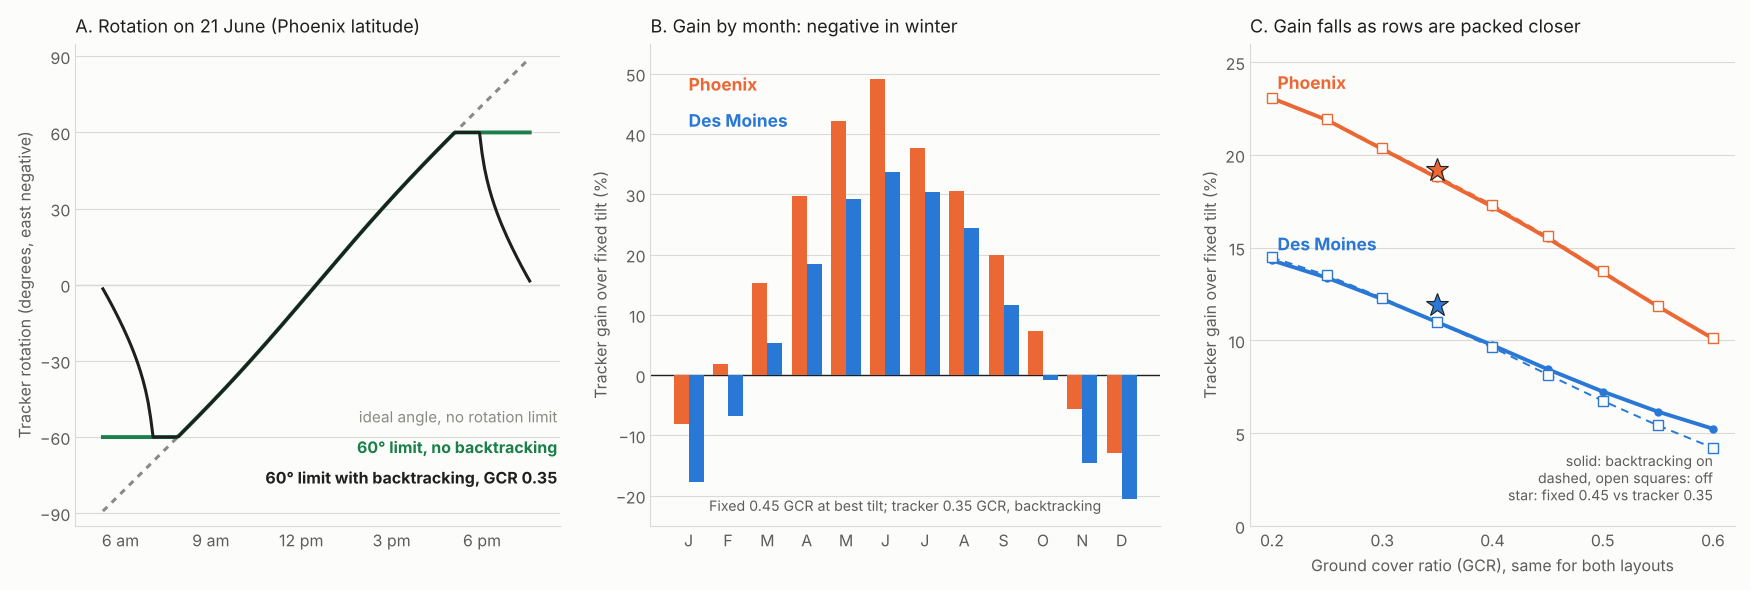
Figure 1. In our model the tracker gain peaks in summer (49% in Phoenix in June) and turns negative in winter. It also falls as GCR rises (22% to 10% in Phoenix from GCR 0.25 to 0.60).
How does a single-axis tracker work?
A single-axis tracker turns a row of modules about one axis. The modules then face the sun’s east-west position through the day. SAM’s help describes rotation "from east in the morning to west in the evening".
- Set the axis. SAM’s help suggests tilt 0° and azimuth 180° for a horizontal north-south tracker. We use that.
- Find the ideal angle. This rotation points the module face at the sun in the east-west plane. On 21 June at Phoenix it is about 82° east at 6 am local time (Figure 1A).
- Apply the limit. SAM’s help gives 45° each way as an example. We use 60°. At GCR 0.35, a 45° limit costs 0.8% of yearly yield in Phoenix and 0.4% in Des Moines.
- Backtrack. SAM’s help calls backtracking "a one-axis tracking strategy that avoids row-to-row shading". Rows flatten once the ideal angle passes arccos(GCR). See backtracking.
How much more energy does a single-axis tracker make?
In our model, 12% to 19% more at the paired layouts. At the same GCR, from 0.25 to 0.60, it is 5% to 22% more. The gain is larger at the sunnier site and at lower GCR.
The method and checks are in the How we modelled it section at the end of the page.
Results are DC energy per kWp, before inverter, soiling, mismatch and wiring losses.
The gain falls as GCR rises, and it is larger in Phoenix than in Des Moines. The first table is Phoenix, with the tracker backtracking.
| GCR | Pitch (m) | Fixed best tilt and yield (kWh/kWp) | Tracker yield (kWh/kWp) | Gain |
|---|---|---|---|---|
| 0.25 | 6.89 | 30° tilt: 2,107 | 2,568 | 21.9% |
| 0.35 | 4.92 | 29° tilt: 2,102 | 2,496 | 18.8% |
| 0.45 | 3.83 | 28° tilt: 2,094 | 2,419 | 15.5% |
| 0.60 | 2.87 | 26° tilt: 2,075 | 2,285 | 10.1% |
The second table is Des Moines, also with backtracking on.
| GCR | Pitch (m) | Fixed best tilt and yield (kWh/kWp) | Tracker yield (kWh/kWp) | Gain |
|---|---|---|---|---|
| 0.25 | 6.89 | 33° tilt: 1,589 | 1,802 | 13.4% |
| 0.35 | 4.92 | 32° tilt: 1,579 | 1,753 | 11.0% |
| 0.45 | 3.83 | 30° tilt: 1,567 | 1,699 | 8.4% |
| 0.60 | 2.87 | 24° tilt: 1,532 | 1,612 | 5.2% |
Pitch is the 1.722 m table width divided by GCR. Both layouts share the GCR in each row.
Does backtracking matter?
On irradiance alone it changes yearly yield by 1% or less here. Our model cannot show electrical shading losses, so it may understate what backtracking is worth.
| Site and GCR | Backtracking on (kWh/kWp) | Backtracking off (kWh/kWp) |
|---|---|---|
| Phoenix 0.25 | 2,568 | 2,568 |
| Phoenix 0.35 | 2,496 | 2,498 |
| Phoenix 0.45 | 2,419 | 2,421 |
| Phoenix 0.60 | 2,285 | 2,285 |
| Des Moines 0.25 | 1,802 | 1,804 |
| Des Moines 0.35 | 1,753 | 1,753 |
| Des Moines 0.45 | 1,699 | 1,694 |
| Des Moines 0.60 | 1,612 | 1,597 |
Without backtracking, row shading removes 4.7% (Phoenix) and 7.7% (Des Moines) of the direct beam at GCR 0.35. At 0.60 it removes 13% and 17%. Backtracking gives up some low-sun light to avoid that shade. Switching it off changes yearly yield by -1.0% to +0.1%.
Our model removes shade as a straight share of the direct beam. Real strings lose more when part of a string is shaded. As an extreme bound, suppose every hour with any row shading lost all its direct beam. Switching backtracking off would then cost 9% to 10% at GCR 0.35 and 24% to 25% at 0.60. The real figure lies between about 0% (the irradiance-only result) and that bound. It depends on string layout and module-level electronics. See mismatch loss.
Worked example: 1 MWdc in Phoenix and Des Moines
The tracker layout makes 19% more energy in Phoenix and 12% more in Des Moines, but it takes 29% more land.
| Site and layout | GCR | Energy (MWh a year) | Array-only land (acres) | MWh per acre |
|---|---|---|---|---|
| Phoenix: fixed tilt, 28° | 0.45 | 2,094 | 2.52 | 830 |
| Phoenix: tracker, backtracking | 0.35 | 2,496 | 3.24 | 769 |
| Des Moines: fixed tilt, 30° | 0.45 | 1,567 | 2.52 | 621 |
| Des Moines: tracker, backtracking | 0.35 | 1,753 | 3.24 | 540 |
Land is module area divided by GCR, at 0.2176 kWp per m². That is the 425 W, 1.722 × 1.134 m module on our ground-mount design page. It leaves out roads, setbacks and equipment pads. We took 0.45 and 0.35 from inside the LBNL GCR ranges quoted in the FAQs. Per array-only acre, the tracker makes 7% less energy in Phoenix and 13% less in Des Moines.
How do these results compare with published data?
They have the same size and direction as LBNL’s fleet data, but the bases differ. Treat this as a plausibility check, not a validation.
- Energy: LBNL’s 2026 edition says tracking adds 5 percentage points to median capacity factor against fixed tilt (1,713 projects). Within regions the average is 3 points (1,730 projects). It says the gain is larger in sunnier areas. Our paired layouts differ by 4.6 points (Phoenix) and 2.1 points (Des Moines) in DC capacity factor.
- Land: LBNL’s 2019 medians were 394 MWh per acre for tracking and 447 for fixed tilt, a gap of 12%. Its power-density medians imply about 46% more land per MW for tracking. They are 0.24 and 0.35 MWdc per acre, quoted on our ground-mount design page. Our land gap of 29% is smaller than LBNL’s. Fleet layouts, GCRs and module density differ from our paired 0.35 and 0.45 layouts.
- Basis: LBNL uses AC capacity factors of real plants over 5 MWac, including losses. We model DC energy for one flat row layout.
What does our model leave out?
Each item below can move the answer by more than the differences we report between close options.
- Clipping and other losses: no inverter limit, soiling, mismatch or wiring loss. See inverter clipping.
- Weather: one typical year per site, not a P50 or P90 range (see TMY and P50, P90, P99). Albedo is a flat 0.20, with no snow.
- Layout: infinite flat rows. No slopes, row ends, tracker pointing error or wind stow.
- Modules: single-sided only. See bifacial modelling. The temperature coefficient is our assumption.
- Fixed-tilt baseline: tilt is re-optimised at every GCR, which is a strong baseline. Many real fixed arrays use a lower tilt.
- Sites: two only, one sunny and one cloudier. Run your own site before quoting a gain.
GCR and row pitch calculator
Enter a GCR or a pitch, plus the table size. The calculator returns the other, the clear gap, the angle where backtracking starts and array-only land per MWdc. Its presets reproduce the pitches in the table above and the acres in the worked example.
How solar software handles single-axis trackers
Only SAM, pvlib and HelioScope document both single-axis tracking and backtracking. DNV SolarFarmer lists tracking and backtracking algorithms but does not say single-axis. Partly means the page covers only some of it. DNV SolarFarmer, PVsyst and PVcase are rated that way.
| Software | Models single-axis trackers and backtracking? | How / where | Source |
|---|---|---|---|
| SAM | Yes | A 1 Axis option with a rotation limit. Backtracking is described as a strategy that avoids row-to-row shading. GCR drives self-shading and backtracking. | SAM help, PV system design (undated), checked October 2026 |
| pvlib python | Yes | A code library, not an app. tracking.singleaxis takes axis tilt, azimuth, maximum angle, a backtrack switch and GCR. | pvlib 0.16.1 documentation, checked October 2026 |
| DNV SolarFarmer | Partly | The product page lists built-in tracking and backtracking algorithms but does not say single-axis. | DNV product page, checked October 2026 |
| PVsyst | Partly | Help names "unlimited trackers" orientations and mixed fixed and tracking systems. Its tracking strategy pages were not read. | PVsyst help, Orientations in PVsyst 8, checked October 2026 |
| HelioScope | Yes | Single-axis trackers are an Enterprise-plan feature. Backtracking switches on or off in the Condition Set’s Trackers tab (help article, 19 September 2025). | HelioScope help article, checked October 2026 |
| PVcase Ground Mount | Partly | The fixed-tilt help names "single-axis tracker" as a frame type. It does not mention backtracking. | PVcase help, fixed-tilt layout, checked October 2026 |
The best utility-scale solar design software and best solar simulation software lists cover the full field.
Common mistakes with single-axis trackers
FAQs
How much more energy does a single-axis tracker produce?
In our model, 12% to 19% more annual DC energy than fixed tilt at two US sites. LBNL’s fleet data show about 3 to 5 capacity-factor points. Your site, GCR and tariff decide the real figure.
Do single-axis trackers need more land?
Yes, at the GCRs used in practice. Our tracker layout at 0.35 GCR took 3.24 acres per MWdc, array only, against 2.52 for fixed tilt at 0.45. LBNL’s 2019 medians show the same direction.
What is backtracking?
Backtracking turns the modules flatter at low sun so one row does not shade the next. It starts when the ideal angle passes arccos(GCR), or 69.5° at GCR 0.35.
Do trackers make less in winter?
They can. Against fixed tilt, our tracker made 13% less in December in Phoenix and 20% less in Des Moines. Phoenix was ahead in 9 months and Des Moines in 7.
What GCR do trackers use?
Trackers typically use a lower GCR than fixed tilt: about 0.25 to 0.40 against 0.40 to 0.50. These are the ranges LBNL’s 2022 land study reports. The study samples US plants online 2007 to 2019 and focuses on 2011 to 2019.
How we modelled it
Method. We ran pvlib 0.16.1 hourly on two NSRDB typical-year files that come with NREL’s System Advisor Model. Phoenix is at 33.45°N with 2,115 kWh/m² global horizontal. Des Moines is at 41.57°N with 1,499 kWh/m².
The tracker has a horizontal north-south axis, a 60° limit and one portrait module across (1.722 m). Fixed rows face south at the tilt that gives most energy at each GCR. Both layouts use the same row-shading model, albedo 0.20 and a -0.35%/K temperature coefficient.
We ran three checks. At a tiny GCR the row model matched pvlib’s plain Hay-Davies transposition within 0.2%. pvlib 0.11.2 and 0.16.1 gave the same headline yields within 0.02 kWh/kWp. Our row-shading fraction matched pvlib’s shading function exactly and our own ray-casting test within 0.002.
Related terms
- Backtracking: flattening a tracker at low sun to avoid row shade.
- Ground coverage ratio: table width divided by row pitch.
- Energy yield simulation: hourly modelling of annual energy.
Next step: model your own site before you quote a gain. The best solar simulation software list covers yield modelling, and the best utility-scale solar design software list covers layout.
Sources
All sources checked October 2026. The two LBNL documents were re-opened on 30 October 2026.
- Model and weather. pvlib tracking.singleaxis and infinite sheds (pvlib 0.16.1). NSRDB typical-year files from NREL’s SAM repository, commit 3cd4af6, 30 September 2026.
- Published comparison. LBNL, Utility-Scale Solar, 2026 edition (adoption and capacity factors). Bolinger, LBNL (2022), land requirements (GCR and energy per acre).
- Tracker definitions. SAM help, PV system design.
- Software. DNV SolarFarmer. PVsyst, Orientations in PVsyst 8. HelioScope product page. PVcase, fixed-tilt layout.
Last updated 30 October 2026. Next scheduled review: 30 January 2027.