Key takeaways
- A 365-day year has 8,760 hours and a 366-day year has 8,784. At 15-minute steps that is 35,040 or 35,136 rows.
- In our 10 kWp example, a monthly mean day matched annual energy within 0.06%. That is by construction, since it keeps each month’s energy.
- The same mean day overstated battery discharge by 333 kWh (10.6%) and the battery’s bill saving by 88 USD (12.4% of the hourly saving, from unrounded figures).
- Mean days hide clipping. At DC/AC 1.5 the hourly run lost 1.19% to clipping and the mean day lost 0.00%. At 1.3 the gap was small: 0.06% against 0.00%.
- Our typical-year file stamps each row at the end of its hour. Reading a stamp one hour out moved our time-of-use bill by 12.7% one way and 9.1% the other.
To run an hourly year with a battery in software, see the best solar simulation software list.
8760 hourly simulation at a glance
It is the same model run once per hour. Every hour has its own sunlight, load, battery state and price.
| Item | Detail |
|---|---|
| Formula | Steps = days × 24 × steps per hour. Hourly energy in kWh = average kW over the hour × 1 hour. |
| Unit and size | 8,760 rows for 365 days. 8,784 for 366 days. 35,040 rows at 15 minutes. |
| Where it matters | Clipping, battery dispatch, self-consumption, time-of-use and demand tariffs. |
| Standard or rule | No single standard. File formats such as TMY3 and EPW fix the layout. |
| In software | Design and simulation tools run hourly and export 8,760 rows. See the software table. |
Why does hourly beat monthly for design?
Monthly numbers give the right annual energy but the wrong shape. Clipping, batteries and tariffs all react to single hours.
- Clipping: an average day never reaches the inverter cap. See inverter clipping and DC/AC ratio.
- Batteries: a battery charges from the surplus of each day. Averaging gives every day the same surplus. See battery storage design.
- Tariffs and self-use: time-of-use prices and self-consumption depend on when power is made and used.
Solargis (article dated 10 January 2019) calls synthetic hourly values built from monthly averages an outdated method. It says they suit only early prospecting.
Its PVsyst test of a 15 kWp system in Spain differed by 1.2% in annual yield, and it reports other sites mostly within ±2%. That is annual energy, not the clipping, battery or tariff results below. The energy yield simulation page covers the general method.
How big is the error? A worked comparison
The mean day matches on annual energy but misses on the battery, self-consumption and the bill. We simulated one 10 kWp system two ways. The hourly run used all 8,760 hours. The mean-day run replaced each month with its average day. Annual energy agreed by construction, since the mean day keeps each month’s energy. The battery and clipping results did not.
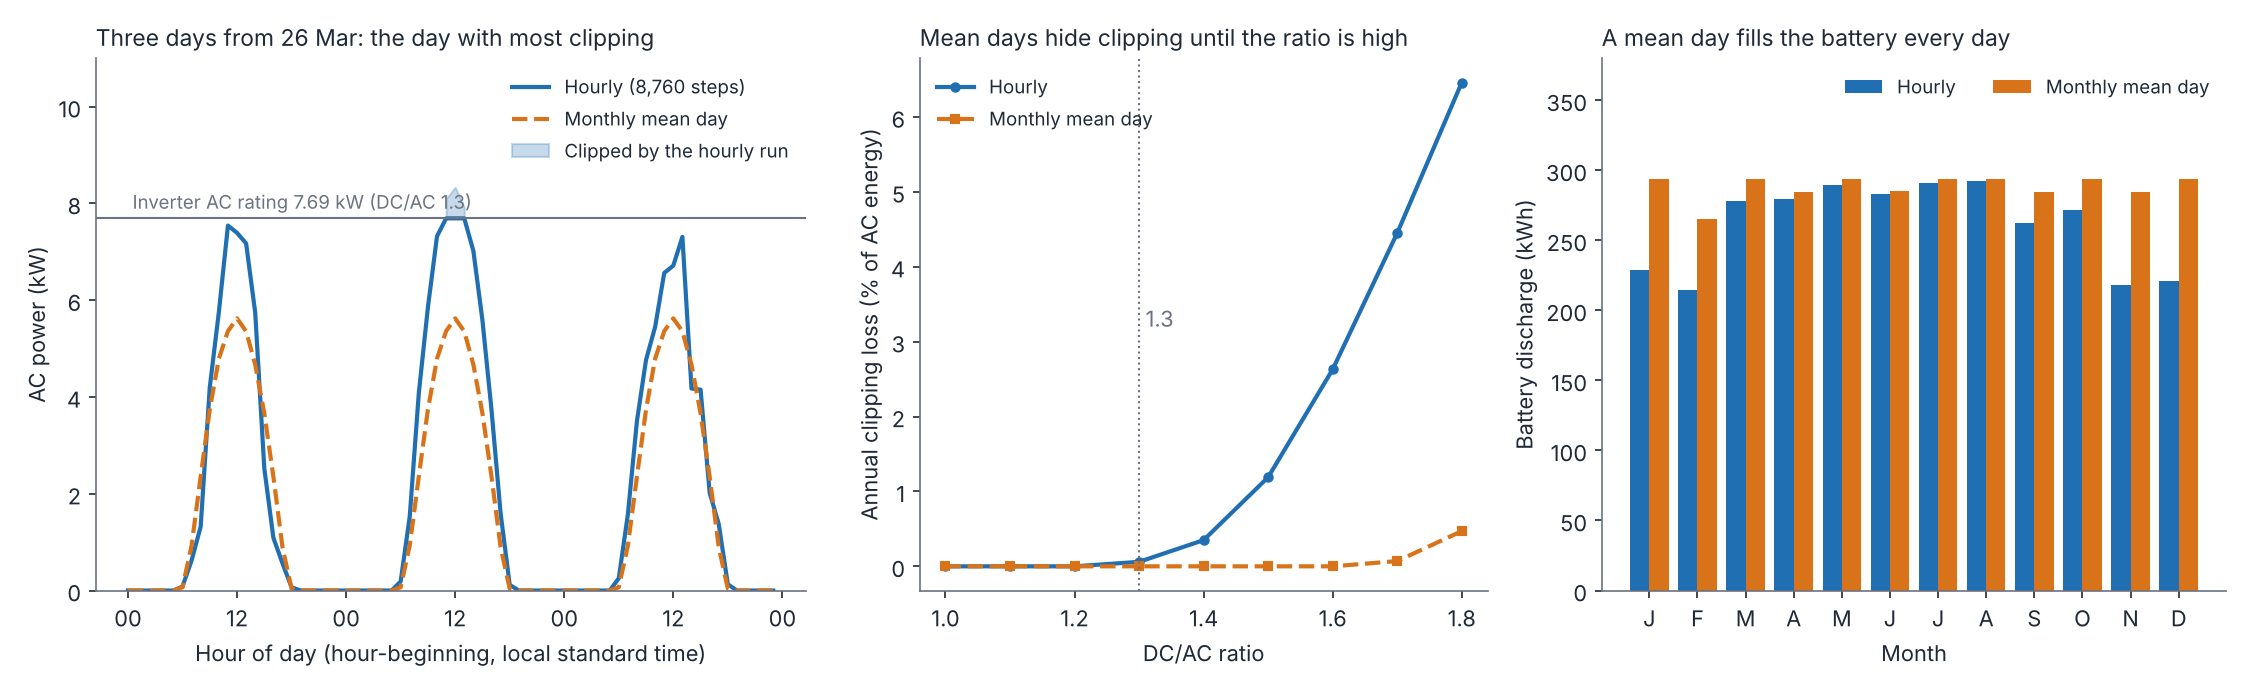
Figure 1. A monthly mean day never reaches the inverter limit and fills the battery every day. It clips almost nothing below a DC/AC ratio of 1.7. Illustration from one typical year at one site, not a site estimate.
The inputs are our assumptions. The mean day is our own construction, not any tool’s method.
- Weather: the NLR (formerly NREL) TMY3 typical year for Greensboro, North Carolina, from pvlib’s sample file. It is a modelled typical year, not a real one.
- Array: 10 kWp, tilted 25 degrees, facing south, with 14% DC losses.
- Inverter: 7.69 kW (DC/AC 1.3) at a flat 96% efficiency.
- Load: synthetic, 10,800 kWh a year with invented hourly shapes.
- Battery: AC-coupled, 10 kWh usable, 5 kW, 90% round trip, charged only from surplus.
- Tariff: illustrative. Import 0.32 USD/kWh from 16:00 to 21:00 and 0.14 USD/kWh otherwise. Export 0.05 USD/kWh.
The table gives the results at DC/AC 1.3. Each result is a full-year figure.
| Result at DC/AC 1.3 | Hourly (8,760) | Monthly mean day |
|---|---|---|
| Annual AC energy (kWh) | 13,837 | 13,845 |
| Clipping loss | 0.06% (28 hours) | 0.00% (0 hours) |
| Self-consumption, no battery | 31.9% | 33.4% |
| Bill, no battery (USD a year) | 963 | 935 |
| Self-consumption with battery | 57.1% | 61.2% |
| Battery discharge (kWh a year) | 3,130 | 3,463 |
| Bill with battery (USD a year) | 249 | 133 |
| Bill saving from battery (USD) | 714 | 802 |
- Battery shift: the mean day charged the battery fully on nearly every day, so it discharged 333 kWh more (10.6%). Its bill with a battery was 47% below the hourly figure.
- Clipping at 1.3: in this typical year the loss is tiny, so the error is tiny too. Clipping only moves with the ratio.
- Self-consumption: monthly netting (adding up a month’s solar and use before comparing) gives 74.6%, against 31.9% hourly. Monthly netting lets a sunny noon offset a dark evening.
Clipping error grows with the ratio, as the next table shows. Each value is the annual clipping loss as a share of the unclipped AC energy.
| DC/AC ratio | Hourly | Monthly mean day | Hours at the limit (hourly) |
|---|---|---|---|
| 1.3 | 0.06% | 0.00% | 28 |
| 1.4 | 0.35% | 0.00% | 137 |
| 1.5 | 1.19% | 0.00% | 370 |
| 1.6 | 2.63% | 0.00% | 594 |
| 1.7 | 4.45% | 0.07% | 773 |
| 1.8 | 6.46% | 0.47% | 937 |
Hourly averages hide short power peaks, so any clipping loss we report is a lower bound. Our "hourly" run is itself an hourly average, so its clipping figures are a floor. Sub-hourly data would show more clipping than any row in this table.
NREL researchers (Prilliman, Keith and Hobbs, June 2024) write that averaging DC power over the hour often underestimates inverter clipping. Their corrected hourly models came within 2% of a 1-minute run for annual energy. The correction helped by up to 3 percentage points at a ratio of 2.0.
What does an 8760 file look like?
It is one row per hour with a time stamp, weather or power columns, and no gaps. Layouts differ by tool, so read each file’s header.
| File | Rows | Columns we confirmed | Source |
|---|---|---|---|
| TMY3 weather file | 8,760 | Date, time, GHI, DNI, DHI, dry-bulb temperature, wind speed. Irradiance is energy received in the 60 minutes before the stamp. | pvlib read_tmy3 documentation, which defers to the TMY3 manual |
| EPW weather file | Always 365 × 24 = 8,760 | Year, month, day, hour (1 to 24), minute, then weather fields. | pvlib read_epw documentation |
| HelioScope hourly CSV | 8,760 | Timestamp, weather, plane-of-array irradiance, shaded and soiled irradiance, DC power, four inverter loss columns, ac_power, grid_power. Power is in watts. | HelioScope help centre |
| PVWatts API hourly output | Not stated | Arrays for ac (Wac), dc (Wdc), poa, dn, df (W/m²), tamb, tcell (°C), wspd (m/s) and alb. | PVWatts version 8 API documentation |
A simulation that models self-use also needs a load column. For the weather side, see weather and solar resource data and typical meteorological year. For the load side, see consumption load profile.
Hour-ending or hour-beginning? Getting the time stamp right
Files differ on whether a row means the hour that ends at its stamp or the hour that starts at it. A one-hour slip moves solar into the wrong tariff period.
- SAM: its help says the first row of an hourly file is the hour ending at 1 a.m. on 1 January. Hourly files with no Minute column use the midpoint of the hour for sun position.
- HelioScope: its hourly CSV is hour-beginning, so 1/1 at 0:00 means midnight to 1:00 a.m.
- Our TMY3 file: the first stamp is 01:00 and the last is 00:00 on the following 1 January. That fits hour-ending.
We tested the sun position on our file. For each hour we checked GHI against DNI × cos(zenith) + DHI, using zenith at four moments.
The root-mean-square error was 2.0 W/m² at the stamp minus 30 minutes. It was 26.0 at the stamp, 26.1 at the stamp minus 60 minutes and 51.8 at the stamp plus 30 minutes. So the sunlight is an hour-long average centred half an hour before the stamp.
A second difference is the type of value. A SAM forum moderator replied that hourly NSRDB irradiance is instantaneous at the hour’s midpoint. Averaged data gives hourly averages. That is a forum reply, not the NSRDB documentation, so check your provider.
Putting the sun at the stamp instead of the midpoint lowered our annual plane-of-array sunlight by 0.64% (1,740.3 against 1,751.5 kWh/m²). Timing errors hit tariffs harder, as the table shows. The rows below move our hourly PV output by one hour against the load and tariff, with no battery.
| Case | Bill, no battery (USD a year) | Self-consumption |
|---|---|---|
| Correct alignment | 963 | 31.9% |
| PV one hour late | 840 (-12.7%) | 33.0% |
| PV one hour early | 1,050 (+9.1%) | 31.6% |
A late shift moves 15:00 sunlight into the 16:00 to 21:00 peak, so the bill falls. The direction depends on the tariff window, so do not guess it.
What about leap years and daylight saving?
A leap year has 366 × 24 = 8,784 hours. Most typical-year files and tools use 8,760 rows, so decide how to treat 29 February.
- SAM’s help says it does not account for leap years or daylight saving. It also says an hourly file should have 8,760 rows.
- pvlib’s EPW reader warns that EPW files always have 8,760 rows. So take care with leap years when you set a year. Its TMY3 reader returns local standard time without daylight saving.
- Stamping 8,760 rows from 1 January 2024 ends on 30 December. Every row after 28 February is then one day off. The noon zenith angle near 1 March changes 0.38 degrees a day at our site.
- Local clock time with daylight saving gives one 23-hour day and one 25-hour day. For New York in 2025 the year still totals 8,760 hours.
For a real metered year, use 8,784 rows in a leap year. HelioScope’s separate help on leap years in CSV reports is not covered here.
Calculator: hourly against monthly mean day
Change the ratio, battery or prices to see where the mean day goes wrong. At the defaults it reproduces the table above, using the same typical year and synthetic load. It is an illustration, not a site estimate.
How solar software handles 8760 hourly output
Only SAM, HelioScope and pvlib state a time convention on the pages we read. We rate "Yes" only where the company’s own page says so.
| Software | Documents 8,760-row hourly output? | Time convention | Notes (checked October 2026) |
|---|---|---|---|
| PVWatts API (NREL, now NLR) | Yes: hourly on request, monthly by default | Not stated | API page lists nine hourly arrays. Leap years not mentioned. |
| SAM | Yes: 8,760 rows, or 35,040 at 15 minutes | First row is the hour ending 1 a.m. | Does not account for leap years or daylight saving. |
| HelioScope | Yes: CSV with 8,760 rows | Hour-beginning | Time zone not stated on the page. |
| Aurora Solar | Yes: CSV of 8,760 hourly production values (article updated 5 October 2026) | Not stated | Columns not listed on the page. |
| PVsyst | Partly: 1-hour step, or shorter with sub-hourly weather | Not stated | Sub-hourly runs need sub-hourly weather. |
| pvlib python | Partly: readers for TMY3 and EPW files. It is a library, not a report tool | Local standard time index | Documentation says the TMY3 manual takes precedence. |
Not stated means the page we read does not say, in this table and the file table above. Partly means only some of the need is documented. For more tools that run hourly simulations, see the best solar simulation software list.
Common mistakes with 8760 hourly simulation
FAQs
Why is it called 8760?
It is the number of hours in a 365-day year: 24 × 365 = 8,760. A leap year has 8,784. The label also names the file with one row per hour.
Is an 8760 file the same as a TMY file?
No. A TMY file is weather input with 8,760 rows. An hourly simulation output has one row per hour of power or energy. Both have one row per hour, so people mix up the names.
Hour-ending or hour-beginning: which is standard?
There is no single rule, so check each file. SAM reads files as hour-ending and HelioScope writes hour-beginning. A mismatch moves solar into the wrong tariff period, so read the header or help page first.
How many rows is a 15-minute year?
At quarter-hour steps a year has 35,040 rows for 365 days and 35,136 for 366 days, four rows for every hourly row. SAM’s help gives the 35,040 figure. Check the row count against the year length before you load a file.
Related terms
- Energy yield simulation: the loss-by-loss method this page assumes.
- Typical meteorological year: the usual 8,760-row weather file.
- Inverter clipping: output capped at the AC rating.
- Solar power forecasting: predicting plant output for a coming period.
Next step: pick a tool that exports a full hourly year from the best solar simulation software, or test dispatch with battery energy storage software.
Sources
- SAM help: weather file time convention (checked October 2026).
- HelioScope: Hourly Production Report CSV (checked October 2026).
- Aurora: Hourly Production Data Export (checked October 2026).
- PVWatts: version 8 API (checked October 2026).
- PVsyst: simulation help (checked October 2026).
- pvlib: read_tmy3 and the read_epw docstring in version 0.16.1 (checked October 2026).
- Solargis: time series versus monthly averages, 10 January 2019 (checked October 2026).
- NREL (now NLR): Side-by-Side Comparison of Subhourly Clipping Models, June 2024 (checked November 2026. The old nrel.gov domain no longer resolves after the lab’s December 2025 rename to the National Laboratory of the Rockies).
- SAM forum: self-consumption and time step, a moderator reply (checked November 2026).
- Our simulation model and its results.
Last updated 30 October 2026. Next scheduled review: 30 January 2027.