Key takeaways
- Warranties are floors. The three warranty documents read give year-25 floors of 89.4% to 92.0% of nameplate.
- Field studies report medians or averages. NREL slides give 0.75% a year for systems, above the module review’s median.
- Linear and compound maths differ by under 1% of 25-year energy at rates up to 1% a year, so the rate matters more than the method.
- Typing the same rate in every SAM schedule row makes 25-year energy 5.6% too high in our example.
- First-year loss (LID) is a separate step from the yearly slope, so year-1 energy should not count it twice.
To apply a degradation rate in a lifetime yield model, see the best solar simulation software. To measure a rate from monitored data, see the best solar performance analytics software.
Degradation rate at a glance
State the basis of a degradation rate: nameplate or previous year, module or whole system, floor or measured median.
| Item | Detail |
|---|---|
| Formula | Linear: E(n) = E1 × (1 − r × (n − 1)). Compound: E(n) = E1 × (1 − r)^(n − 1) |
| Unit and range | Percent per year. Warranty steps in our three documents: 0.25% to 0.40%. Measured medians in the studies below: 0.5% to 0.75% |
| Where it matters | Proposals, performance guarantees, LCOE and payback |
| Standard or rule | No single standard. Each manufacturer’s warranty text sets its own floor |
| In software | Simulators apply a rate by year. RdTools estimates it from monitored data |
Why degradation rate matters for installers
It sets the output you promise in year 15 and year 25. If the rate is too low, you overstate savings, income and guarantee headroom.
It also feeds other numbers. A yield simulation gives year-1 energy, and degradation scales every later year. The P50, P90 and P99 page shows how degradation sits beside those probabilities.
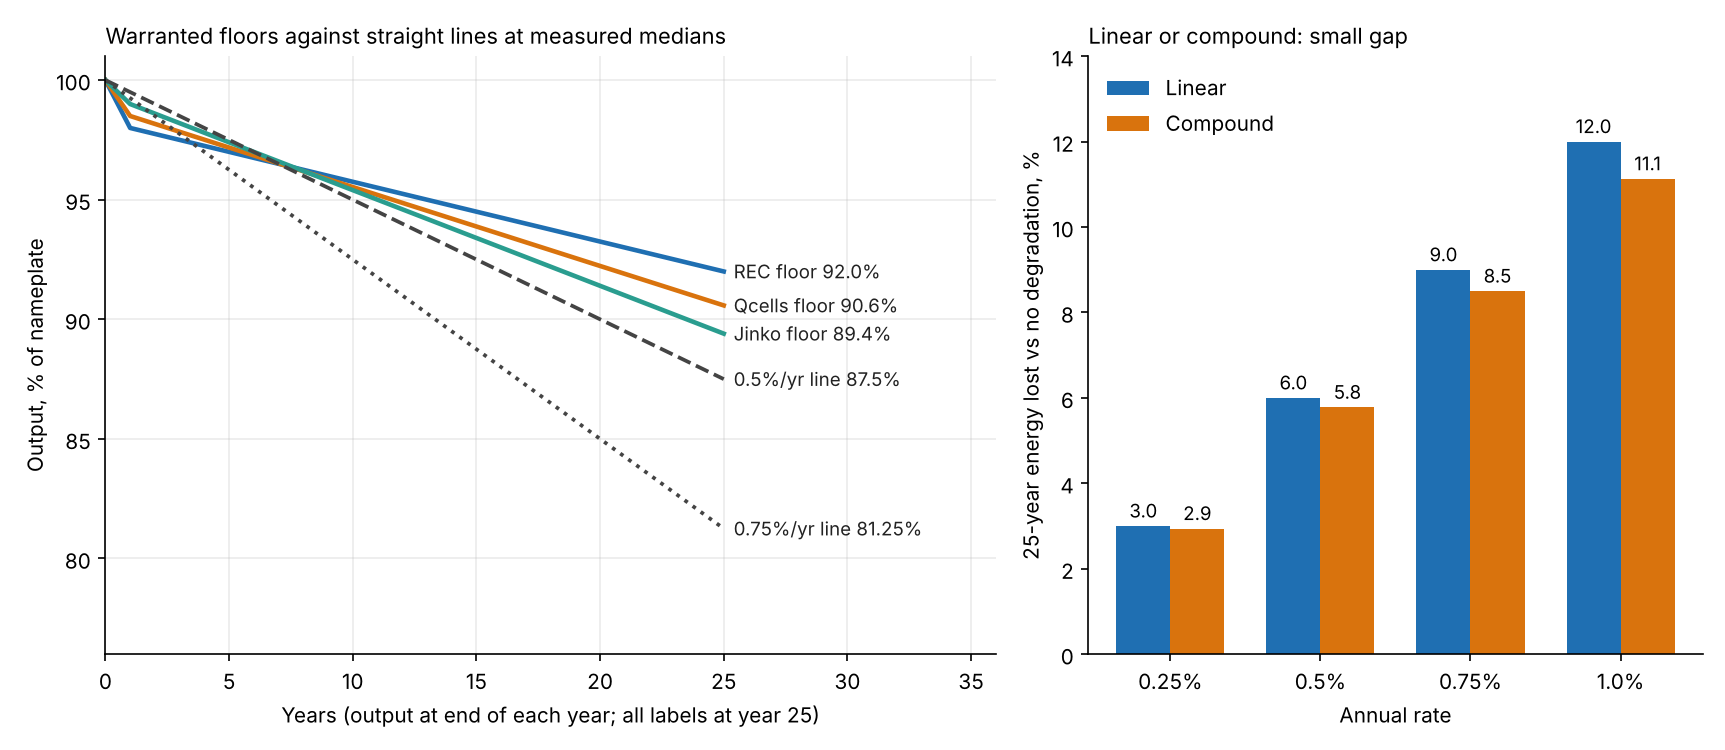
Figure 1. A straight line at the review’s 0.5% median ends below all three warranty floors at year 25. Linear and compound maths differ by under 1% of 25-year energy. The grey line marks year 25.
What is the difference between first-year loss and the annual rate?
First-year loss is a one-off drop in the first months, often called light-induced degradation (LID). The annual rate is the slope after that.
PVsyst’s help treats an initial loss of about 3% in its example as LID, apart from the yearly slope. Its own example is 3% initial and 20% after 25 years. That works out at 0.68% a year, (20 − 3) ÷ 25. In pvlib, the PVWatts loss function has an lid input (default 1.5). It also has a separate age input (default 0).
The warranties read show the same split. Year-one losses are 2%, 1.5% and 1%, so REC’s warranty starts at 98% in year one. Each later year has a smaller step.
What do manufacturer warranties state?
Each warranty gives a minimum output in year 1, then a maximum yearly loss. These are floors that a claim is judged against. They are not forecasts.
| Document | Year 1 | Yearly step | Year-25 floor | Product warranty |
|---|---|---|---|---|
| REC Alpha warranty | 98% | 0.25% | 92.0% (stated) | 20 years, 5 more through REC’s certified programme |
| Qcells warranty terms | 98.5% | 0.33% to year 30 | 90.58% (computed). Year 30 is 88.93% (datasheet) | 25 years |
| Jinko Tiger Neo whitepaper | 99% | 0.40% | 89.4% (computed). Year 30 is 87.4% (stated) | At least 15 years |
Variants behind each row:
- REC: Alpha warranty, Rev 9 (10.26), Europe section. It covers Alpha Pure, Pure-R, Pure-RX and Pure 2 modules, for products delivered from 1 January 2019 onward. Rev 9 replaced Rev 8 in October 2026, with the same 98%, 0.25% and 92.0% figures.
- Qcells: warranty terms for Q.TRON S-G3R.12+ modules, issued 1 June 2024, European entity. The datasheet is Q.TRON BLK S-G3R.12+ 435-450 W, Rev 04, August 2025 edition.
- Jinko: Tiger Neo N-type whitepaper with no date in the file (its web address suggests March 2023). It covers 144-cell, 156-cell and 108-cell modules.
Arithmetic check: year 1 minus 24 steps gives REC’s stated 92.0%. Year 1 minus 29 steps gives Jinko’s stated 87.4%. It also gives the Qcells datasheet’s 88.93% at year 30. Notes on dates and scope are under Sources.
What have field studies measured?
Field data give medians near 0.5% a year for modules and 0.75% a year for system performance. The spread is wide and the biases are known.
| Study | What was measured | Result |
|---|---|---|
| Jordan and Kurtz, Progress in Photovoltaics 21(1), 2013 (NREL) | Rates from published field tests over about 40 years, on modules and whole systems | Median 0.5% a year from nearly 2,000 rates. NREL’s 2012 slides cite 2,128 rates, a mean of 0.8%, and about 80% below 1% |
| NREL DuraMAT seminar slides, 11 July 2022 | Inverter data from commercial and utility systems, trended against a PVWatts expectation | Median system rate 0.75% a year. Hotter zones lose faster (zone 5 median 0.88%) |
| Berkeley Lab report by Bolinger, Gorman, Millstein and Jordan, dated March 2022 on its page | 631 US utility plants, 31.0 GW dc, online 2007 to 2018, against modelled capacity factors | Fleet average 1.2% a year (±0.1). Newer, larger plants with higher DC:AC averaged 0.7% (±0.4) |
Limits of each study:
- Jordan and Kurtz: NREL’s 2015 slides say most rates come from a single measurement and sampling bias is present. Rates based on nameplate can carry significant error.
- DuraMAT slides: expected values are modelled, so model error enters the trend. The slides give two different system counts.
- Berkeley Lab report: the authors say fleet figures include recoverable and unrecoverable loss, and first-year underperformance may reflect modelling issues.
A rate also takes time to measure. NREL’s 2011 outdoor-module paper says you need several complete cycles, typically 3 to 5 years, because of seasonal effects. It calculated no rates under two years.
The table below sets the warranty floors beside straight lines at the two measured medians. Every row is the output level at the end of that year, as a percent of nameplate. The lines take the rate off nameplate each year (nameplate minus the rate times the year), with no first-year step.
| Basis (level at end of year) | Year 10 | Year 25 |
|---|---|---|
| REC floor | 95.75% | 92.0% |
| Qcells floor | 95.53% | 90.58% |
| Jinko floor | 95.4% | 89.4% |
| 0.5% a year line (review median) | 95.0% | 87.5% |
| 0.75% a year line (NREL system median) | 92.5% | 81.25% |
The lines fall below every floor by year 25. That does not mean the warranties are wrong. The review mixes four decades of module designs. The lines have no first-year step. And a median is not a floor. A proposal should state which one it used.
How do you apply a degradation rate?
Take year-1 energy from the simulation, then cut each later year by the rate. Pick linear or compound, and say which.
- State the basis of the rate. It is either points of nameplate (warranty style) or percent of the previous year.
- Take year-1 energy E1 from the simulation. Check whether it already has the first-year loss in it.
- Linear: E(n) = E1 × (1 − r × (n − 1)). Compound: E(n) = E1 × (1 − r)^(n − 1).
- Add up the years you need. Compare with E1 × years.
- Test the last year against the warranty floor, scaled to your year 1.
Worked example: a 10 kWp system over 25 years
Linear and compound totals differ by 0.06% to 0.99% across rates of 0.25% to 1.0%. The inputs are invented: 13,000 kWh in year 1 (1,300 kWh per kWp), with no first-year loss added.
| Rate a year | Linear total (kWh) | Compound total (kWh) and gap | Compound loss vs flat | Year-25 output vs year 1 (compound) |
|---|---|---|---|---|
| 0.25% | 315,250 | 315,434 (gap 184) | 2.94% | 94.17% |
| 0.50% | 305,500 | 306,227 (gap 727) | 5.78% | 88.67% |
| 0.75% | 295,750 | 297,365 (gap 1,615) | 8.50% | 83.47% |
| 1.00% | 286,000 | 288,832 (gap 2,832) | 11.13% | 78.57% |
Flat output would be 325,000 kWh. Now apply each warranty floor to the same year-1 energy. If a system just met the floor, 25-year energy would be 315,051 kWh (REC), 311,934 kWh (Qcells) and 309,242 kWh (Jinko). That is 96.94%, 95.98% and 95.15% of flat. The 0.5% compound path gives 94.22%.
Every figure here was recomputed from the inputs shown, and the stated warranty values match.
Degradation rate calculator
Enter year-1 energy, a rate and a method. The calculator shows yearly output, the total, and the same period at a warranty floor. Presets load the three warranties above. It is a design aid, not a guarantee.
How solar software handles degradation rate
Of the four tools we checked, no page we read says whether the yearly step for PV is linear or compound. The one worked example, on SAM’s help page, covers other model types. A flat test case through any tool shows what its lifetime total does.
| Software | Applies or estimates degradation? | Method | Source |
|---|---|---|---|
| PVsyst | Yes | Modelled | PVsyst help, Ageing, checked October 2026 |
| SAM | Yes | Modelled | SAM help, DC Degradation (samrepo.nlr.gov mirror), checked October 2026 |
| pvlib python | Partly | Modelled, in code | pvlib 0.16.1 documentation, checked October 2026 |
| RdTools (NREL, open source) | Yes | Measured | RdTools 3.2.1 documentation, checked October 2026 |
Partly: the documentation covers an input but not a full yearly schedule.
How each tool handles it:
- PVsyst: it runs a chosen year of system life and applies that year’s degradation, evaluated at mid-year (year 10 uses 9.5 years). It adds mismatch growth from a spread of module rates. The pages read do not say linear or compound, and give no default rate.
- SAM: value mode takes one annual rate. Its 1% help example gives 100,000, 99,000 and 98,010 kWh. Schedule mode applies each year’s rate to the year-1 output, and the year-1 entry has no effect. The help page scopes the 1% example to models other than Detailed Photovoltaic and PVWatts.
- pvlib python: the
pvwatts_lossesfunction has anageloss input (default 0). Pages read give no yearly schedule, and the ModelChain reference does not mention degradation. - RdTools (NREL, open source): it estimates a degradation rate from monitored data. Year-on-year is the method it prefers. It reports degradation, not total performance loss, and sensor drift can bias it.
Our ranking of the best solar simulation software covers design and yield tools. The best solar performance analytics software list covers monitoring tools.
Common mistakes with degradation rate
FAQs
What is a normal degradation rate?
Measured medians run from 0.5% a year for a module review to 0.75% for systems, and warranty steps are 0.25% to 0.40%. There is no single normal, so match the number to the module and the claim.
Is degradation linear or compound?
Both are used. Warranties are written as yearly steps in points of nameplate, and SAM’s 1% help example, which is for other model types, falls by 1% of the previous year. For PV, the pages we read do not say. Over 25 years the two differ by under 1% of energy at rates up to 1% a year.
How much output is left after 25 years?
At 0.5% a year compound, year 25 is 88.67% of year 1 in our example. The three warranty floors are 92.0%, 90.58% and 89.4% of nameplate.
Do warranties show how panels really degrade?
No. Warranties state a minimum that a manufacturer will honour, not a forecast. Field studies measure what a sample did, and they have their own biases, such as sampling and modelled expectations.
Does degradation affect P90?
Usually it is applied year by year to P50, not inside P90. The P50, P90 and P99 page quotes PVsyst’s documentation on this, so check how your tool treats it.
Related terms
- LCOE: lifetime cost divided by lifetime energy, where degradation lowers the energy.
- Payback period: years to recover cost, lengthened by degradation.
- Energy yield simulation: the model that gives year-1 energy.
- System losses and loss diagram: where LID sits among other losses.
Next step: pick a simulator from the best solar simulation software and run a flat test case. To measure a real rate, use the best solar performance analytics software.
Sources
Notes on the warranty table. The Qcells terms have an issue date of 1 June 2024 but a footer code of 2024-02 Rev01. They give 88.6% as an end-of-term example, and the datasheet gives 88.93%. The gap is one 0.33-point step, and the datasheet value is used. REC and Qcells measure output under standard test conditions, and REC’s text adds a ±3% tolerance range. So a claim rests on a test result, not on a monitoring trend. The Qcells documents are distributor-hosted copies, and Qcells US terms are not covered. The Jinko file is a whitepaper, not the warranty text.
- Jordan and Kurtz, Photovoltaic Degradation Rates - An Analytical Review (OSTI record, abstract) (checked October 2026).
- NREL research hub record, Progress in Photovoltaics 21(1) (checked October 2026).
- NREL slides, EU PVSEC, 27 September 2012 (checked October 2026).
- NREL slides, Solar Power International, 14 September 2015 (checked October 2026).
- Jordan and others, Outdoor PV Degradation Comparison, NREL, 2011 (checked October 2026).
- NREL DuraMAT seminar slides, 11 July 2022 (checked October 2026).
- Berkeley Lab, Plant-level performance and degradation of 31 GW-DC of utility-scale PV (checked October 2026).
- REC Alpha warranty, Rev 9 (checked November 2026). Rev 8, the version first checked, is no longer hosted at its old address.
- Qcells warranty terms, Q.TRON S-G3R.12+ (distributor copy) (checked October 2026).
- Qcells Q.TRON BLK S-G3R.12+ datasheet, Rev 04 (distributor copy) (checked October 2026).
- JinkoSolar Tiger Neo N-type TOPCon product whitepaper (checked October 2026).
- PVsyst help, Ageing, PV modules degradation (checked October 2026).
- SAM help, DC Degradation (checked 30 October 2026).
- Energy Department, rename of NREL to the National Laboratory of the Rockies, announced 1 December 2025 (checked 30 October 2026). We cite NREL documents under the lab’s former name.
- pvlib, pvwatts_losses (checked October 2026).
- RdTools documentation (checked October 2026).
- SolarQuotes, degradation guide, read for the SERP gap only (checked October 2026).
Last updated 30 October 2026. Next scheduled review: 30 January 2027.