Key takeaways
- Our 8 kW example repays in 16.2 years on simple payback. Discounted at 4%, it takes 24.4 years, and the same case has an NPV of 442 USD.
- A homeowner who buys cannot claim the US residential clean energy credit for installs completed after 31 December 2025 (IRS). Business-owned solar has its own dates: see the US credit section.
- In our model runs, the share of solar used on site moves payback most. It is 22.5 years at 30% and 12.1 at 100%.
- An illustrative 30% upfront cost reduction, not a current US credit, cuts simple payback from 16.2 to 11.9 years.
- Payback ignores every year after the payback year. It also has no meaning for no-money-down loans. Pair it with NPV, IRR or LCOE.
To compare how proposal tools report payback, see the best solar proposal software.
Payback period at a glance
Payback answers one question: when does the customer get the money back? It does not say how much they gain after that.
| Item | Detail |
|---|---|
| Formula | Flat saving: net cost ÷ annual saving. With changing savings: add each year’s saving until the running total hits net cost |
| Unit and range | Years, quoted to one decimal. Our example: 16.2 simple, 24.4 discounted at 4% |
| Where it matters | Residential proposals, sales conversations, quick screening of commercial jobs |
| Standard | No single standard. Each tool sets its own method, horizon and discount rate |
| In software | Proposal and financial tools report it. The method differs, so read the help page |
Why does payback period matter for installers?
Payback exposes the assumptions in your proposal. In our example, a 1-point change in rate escalation moves it by about 1 year. A wrong self-consumption guess moves it by several. Check which inputs your tool lets the sales rep change, and which it hides.
How do proposals calculate simple and discounted payback?
A proposal adds up yearly savings until they equal the net cost. Discounted payback does the same with discounted savings. Here, d is the discount rate and t is the year.
- Set the net cost: gross cost minus the incentives the customer can use. Aurora’s help defines net cost the same way.
- Work out the year-1 saving: kWh used on site × import rate, plus kWh exported × export rate, less O&M. See net metering for what exports earn.
- Roll each later year. Output falls by the degradation rate. The import rate rises by the escalation rate. Keep the export rate flat unless the tariff says otherwise.
- Add the savings year by year. In the year the total reaches net cost, interpolate. Count the years done, plus the part of the last year you need.
- For discounted payback, first divide each year’s saving by (1 + d)^t. Then repeat step 4.
The rates come from the customer’s tariff. See tariff and rate databases. Our setup: net cost paid at year 0, savings at year end, a 25-year horizon, no tax.
What moves payback the most?
Five inputs do most of the work: net cost, share used on site, rate escalation, export rate and degradation. Across the ranges we tested, the share used on site moved simple payback most.
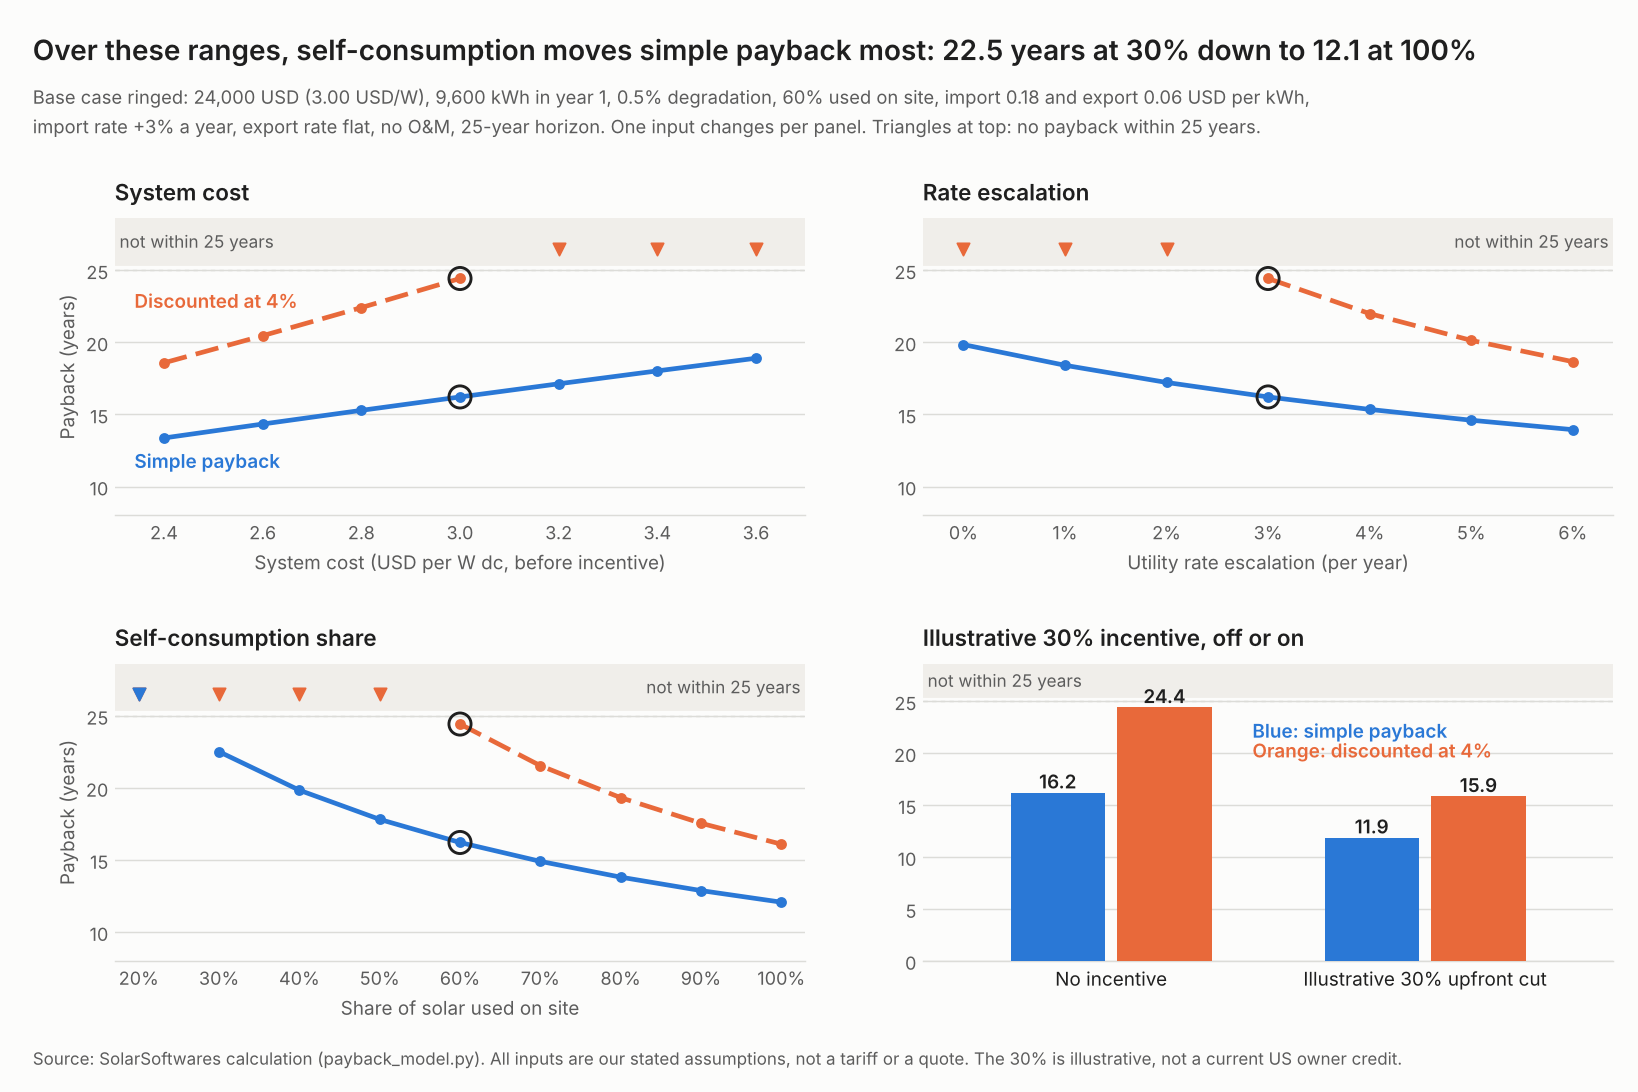
Figure 1. Self-consumption moves simple payback most over the ranges tested, from 22.5 years at 30% to 12.1 at 100%. Discounted payback at 4% no longer fits the 25-year horizon after any one of three changes: a cost of 3.20 USD/W, escalation of 2%, or 50% used on site.
- Net cost: each 0.20 USD/W (1,600 USD) adds about 0.9 year.
- Rate escalation: each point from 0% to 4% cuts 0.9 to 1.4 years. See utility rate escalation.
- Self-consumption: each kWh used on site earns the import rate, not the export rate. See self-consumption.
- Export rate: as it goes from 0.00 to 0.18 USD per kWh, payback falls from 18.5 to 12.8 years at 60% on site.
- Degradation: from 0% to 2% a year, payback rises from 15.7 to 18.2 years. See degradation rate.
Worked example: one 8 kW home
The one-year formula gives 18.9 years for this home. Modelling each year gives 16.2 simple and 24.4 discounted. Every figure on this page comes from one year-by-year model.
It is the home on the net metering page. We added escalation, degradation, discounting and 60% used on site. Every input is our assumption.
| Input | Value |
|---|---|
| System cost | 24,000 USD (3.00 USD/W), no incentive in the base case |
| Year-1 output | 9,600 kWh, falling 0.5% a year |
| Used on site | 60% |
| Import and export rate | 0.18 and 0.06 USD per kWh in year 1 |
| Import rate escalation | 3% a year. Export rate held flat |
| Year-1 saving | 9,600 × (0.6 × 0.18 + 0.4 × 0.06) = 1,267.20 USD |
| Discount rate and horizon | 4% nominal. 25 years. No O&M |
| Method | Payback (years) |
|---|---|
| One-year formula: 24,000 ÷ 1,267.20 | 18.9 |
| Degradation only | 19.8 |
| Escalation only | 15.7 |
| Escalation and degradation: simple payback | 16.2 |
| Discounted at 3% (NPV 3,521 USD) | 21.5 |
| Discounted at 4% (NPV 442 USD) | 24.4 |
| Discounted at 5% (NPV minus 2,165 USD) | None within 25 years |
Set 40% used on site, no escalation and no degradation. The model script then gives a saving of 1,036.80 USD and a payback of 23.1 years. That matches the net billing row on the net metering page.
The discount rate swings the result. From 3% to 5%, discounted payback goes from 21.5 years to none.
Solar payback calculator
The presets reproduce the tables above. If an input is blank, zero, negative or out of range, the calculator warns you. It does not show a wrong number. It is a design aid, not financial advice.
How do simple payback, discounted payback, IRR, NPV and LCOE differ?
Each measure answers a different question about the same cash flows. Payback times the recovery. IRR and NPV size the return. LCOE prices the energy.
| Measure | Question it answers | Our base home | What it ignores |
|---|---|---|---|
| Simple payback | When do savings repay the net cost? | 16.2 years | Time value of money. Every year after payback |
| Discounted payback | When do discounted savings repay it? | 24.4 years at 4% | Years after payback. Very sensitive to the rate |
| IRR | What yearly return do the cash flows earn? | 4.2% over 25 years | Project size. Needs a hurdle rate to judge |
| NPV | How much value does it add at the discount rate? | 442 USD at 4% | Timing of recovery. Needs a discount rate |
| LCOE | What does each kWh cost to make? | 0.168 USD per kWh at 4% | What each kWh is worth to this customer |
The numbers agree. IRR of 4.2% is just above the 4% rate. So NPV is slightly positive, and discounted payback lands near year 25. LCOE here is net cost over discounted energy, before tax. Its method and benchmarks sit on the LCOE page. This figure is not comparable with that page’s example.
LCOE alone would mislead. At 0.168 USD it sits above year-1 value of 0.132 USD per kWh. But value escalates. The discounted average value is 0.171 USD, so NPV stays positive.
What do the US federal rules mean for payback inputs?
For a homeowner who buys the system, the residential clean energy credit is not allowed for any expenditure made after 31 December 2025. IRS FAQ 7 treats the expenditure as made when installation is completed, not when the buyer pays. So the completion date decides whether a proposal can include the credit.
Business-owned solar under sections 45Y and 48E follows other dates. IRS Notice 2025-42 applies the statute’s 31 December 2027 in-service limit where construction began after 4 July 2026. This part draws on the two notices, not the statute.
- Rule: Notice 2025-42 cites sections 70512 and 70513 of Pub. L. 119-21 (4 July 2025) as ending the 45Y and 48E credits for solar placed in service after 31 December 2027. This applies where construction begins after 4 July 2026 (Notice sections 1 and 2.02). The Notice prints no issue date.
- Start date: the Notice is effective for facilities where construction did not begin before 2 September 2025 (section 7). To show construction began before 5 July 2026, use the Physical Work Test. It is the sole method (section 3.01). The 5% safe harbour is not available (section 2.03). Solar of 1.5 MW or less, measured in alternating current, may still use principles similar to the 5% safe harbour (sections 6.01 and 6.02).
- Continuity: a facility in service by the end of the fourth calendar year after construction began meets the continuity safe harbour (section 4.04). The Notice’s example: construction starts on 20 August 2025 and the facility is in service by 31 December 2029. Later dates turn on the facts.
- Foreign entities: Notice 2026-15 gives interim guidance on material assistance from a prohibited foreign entity. It quotes a rule for facilities where construction begins after 31 December 2025, and says more guidance is coming. It prints no issue date either.
We did not research leased or third-party-owned systems. A residential proposal should show payback with and without any incentive, label each, and name the source. Our 30% scenario is an illustrative upfront reduction, not a current US owner credit. It takes 30% off the cost at year 0. Real credits arrive later, which lengthens payback. With it on, payback is 11.9 years simple and 15.9 discounted. NPV is 7,642 USD.
How solar software handles payback period
Of the five tools we checked in October 2026, only Aurora states its method: simple payback. It calls its cash-flow chart the more accurate view. The other four pages do not define the method.
| Software | Reports payback? | Method | Source |
|---|---|---|---|
| Aurora Solar | Yes | Simple payback | Aurora help centre, updated 15 May 2026 |
| HelioScope | Yes | Not stated | HelioScope help centre glossary, updated 4 August 2026 |
| SAM | Yes, not for PPA models | Not stated | SAM help, financial metrics and NPV pages |
| PVsyst | Yes | Not stated | PVsyst help, economic evaluation |
| OpenSolar | Not stated | Not stated | OpenSolar support, bill savings |
Not stated: the pages we read do not say. What each company documents:
- Aurora Solar: net system cost ÷ annual utility bill savings. A separate cash-flow chart uses year-by-year cash flows with escalation, degradation and financing costs, and "is the more accurate representation". Aurora says payback suits cash purchases and is less common for commercial analysis.
- HelioScope: lists Payback Period as a financial metric: time for the system to cover the initial investment. Escalation, degradation and discount rate are inputs. How each enters payback is not stated.
- SAM: displays payback for the residential and commercial financial models. NPV is discounted at the nominal rate. No payback definition or discounted payback appears on the pages read.
- PVsyst: its economic evaluation overview lists ROI, payback period and NPV among the results. No definition appears on the pages read.
- OpenSolar: the bill-savings page describes 25 simulated years by default, adjusted for electricity inflation and output loss. It does not mention payback. The financial-savings page was not among the pages read.
For tools that report payback, see the best solar proposal software. Commercial jobs may suit the commercial proposal software list, and deeper cash-flow work the financial modelling software list.
Common mistakes with payback period
Label the method, match real to nominal, and round honestly.
- Two numbers for one system: a one-year formula on the summary and a year-by-year chart beside it. Say which method each one uses.
- Mixing real and nominal: a nominal escalation rate needs a nominal discount rate.
- False precision: 16.22 years implies certainty the inputs lack. Round to the nearest half year.
FAQs
What is the difference between simple and discounted payback?
Simple payback adds savings at face value. Discounted payback shrinks later savings by a discount factor. On our example home that is 16.2 against 24.4 years at 4%.
Is a shorter payback always better?
No. Payback ignores every year after it. Our base home saves 40,773 USD over 25 years. But payback says nothing about the 16,773 USD it earns after cost. Use NPV or IRR to compare systems.
How does financing change payback?
Aurora’s help says payback is designed for cash purchases. With a no-money-down loan the customer has no upfront cost to recover. So payback has no meaning or is misleadingly short. For financed deals, show lifetime savings and the cash-flow chart.
Which payback figure should a proposal show?
Show the year-by-year figure, and label it simple or discounted. Aurora calls its cash-flow chart the more accurate view. For commercial buyers, add NPV and IRR. Aurora notes they treat solar as a capital investment.
Does a federal tax credit still count in payback?
Not for a homeowner who buys and finishes installation after 31 December 2025: IRS FAQ 7 says the residential clean energy credit is not allowed then. Before that date, model any credit as arriving after year 0, not at year 0. For business-owned solar, Notice 2025-42 applies the statute’s 31 December 2027 in-service limit where construction began after 4 July 2026. Show payback with and without any incentive.
Related terms
- NPV: the value a project adds after discounting its cash flows.
- IRR: the discount rate at which NPV is zero.
- LCOE: discounted lifetime cost divided by discounted lifetime energy.
- Utility rate escalation: the yearly rise in the customer’s electricity price.
- Degradation rate: the yearly loss of module output, 0.5% in our example.
- Self-consumption: the share of solar output used on site.
Next step: label which method your proposal uses for payback, then compare tools in the best solar proposal software. For cash-flow work, see the best solar financial modeling software.
Sources
All sources read October 2026.
- Incentives. IRS FAQs on Public Law 119-21 (21 August 2025), FAQ 7 and the residential clean energy credit summary row (checked 30 October 2026). IRS Notice 2025-42 (checked 30 October 2026). IRS Notice 2026-15.
- Software. Aurora, financial analysis overview and net cost values. HelioScope financial modeling glossary. SAM financial metrics and NPV. PVsyst economic evaluation. OpenSolar bill savings.
- Calculation. SolarSoftwares year-by-year model. Inputs are our assumptions.
Last updated 30 October 2026. Next scheduled review: 30 January 2027.