Solar performance analytics software shows why a solar plant makes less power than it should. It compares real output with what the weather says the plant should make, then splits the gap by cause. Power Factors Unity ranks first on this list, at 71.0/100, for predictive analytics across utility-scale fleets.
3E SynaptiQ ranks second, at 66.0/100, for loss categorisation (sorting losses into types) without onsite sensors. We scored 9 tools and ranked the top 7. Utility-scale means very large solar farms, and a fleet is a group of plants run together.
What does solar performance analytics software do?
Monitoring tells you a plant made less than it did yesterday. Analytics tells you if that matters, and why.
Analytics sets real output against an expected-energy model, which is what the weather says the plant should make. Then it splits the gap by cause. Causes include soiling (dirt on the panels), shade, downtime, clipping (an inverter cutting off extra power), wear and faults. It also shows which losses you can win back.
We ranked tools on how much of that chain they show once a plant is running. Design-stage yield studies (forecasts of how much power a plant will make) are a different job. We cover them on our solar simulation software page.
The same companies turn up on other pages for other jobs. See asset management for the owner’s money view. See O&M software (operations and maintenance) for turning findings into work orders.
If you only need a maintenance management system (CMMS), see solar CMMS. For running a utility plant day to day, see solar farm management. All sit in our monitoring and asset management group.
Quick picks
Rank | Product | Best for | Starting price (company page, checked October 2026) | Free plan / trial | Score /100 |
|---|---|---|---|---|---|
1 | Predictive analytics across utility-scale fleets | Quote only | Demo only | 71.0 | |
2 | Loss categorisation without onsite sensors | Quote only | Demo only | 66.0 | |
3 | Module-level diagnostics with sensor hardware (status unconfirmed) | Quote only | Unknown | 61.0 | |
4 | Actual-vs-modelled tracking on mixed hardware | Quote only | Demo only | 59.9 | |
5 | Root-cause alerts on published pricing | ✓ EUR 5 per site per month (up to 200 kWp) | Free demo access | 59.2 | |
6 | Australian residential and small commercial fleets | ✓ AUD 6 per inverter per month | 30-day trial (inverter-integrated) | 59.2 | |
7 | Alarm-led analysis on meteocontrol hardware | Quote only | Demo only | 57.2 |
✓ Verified on the company’s own pricing page. ◐ Published by the company outside its pricing page (help centre, store or press release). ? We could not read the company’s pricing page, so the figure is not confirmed. Prices checked October 2026.
Quote only means the company shows no public price. You ask it for a quote.
How the 7 tools scored
- Use-case fit 35%
- User reviews 20%
- Pricing 15%
- Ease of use 10%
- Support 10%
- Momentum 10%
Tool | Score chart | Score |
|---|---|---|
71 out of 100 | 71.0 | |
66 out of 100 | 66.0 | |
61 out of 100 | 61.0 | |
59.9 out of 100 | 59.9 | |
59.2 out of 100 | 59.2 | |
59.2 out of 100 | 59.2 | |
57.2 out of 100 | 57.2 |
Each bar shows the weighted score out of 100.
Sub-scores at a glance (0-10)
Product | Use-case fit | User reviews | Pricing | Ease of use | Support | Momentum | Total /100 |
|---|---|---|---|---|---|---|---|
10.0 | 5.0 | 4.0 | 5.0 | 5.0 | 10.0 | 71.0 | |
10.0 | 5.0 | 4.0 | 5.0 | 5.0 | 5.0 | 66.0 | |
10.0 | 5.0 | 4.0 | 5.0 | 5.0 | 0.0 | 61.0 | |
10.0 | 1.9 | 4.0 | 5.0 | 5.0 | 5.0 | 59.9 | |
7.5 | 5.0 | 7.0 | 5.0 | 5.0 | 2.5 | 59.2 | |
7.5 | 5.0 | 7.0 | 5.0 | 2.5 | 5.0 | 59.2 | |
7.5 | 5.0 | 4.0 | 5.0 | 5.0 | 5.0 | 57.2 |
A 5.0 on reviews, ease, support or momentum is our neutral score. We use it when public evidence is thin. It is not a judgement.
How did we rank these solar performance analytics tools?
How the score is weighted
- Use-case fit 35%
- User reviews 20%
- Pricing 15%
- Ease of use 10%
- Support 10%
- Momentum 10%
We looked at 10 products. We scored 9 and ranked the top 7 between 22 and 25 October 2026. We used company papers, price pages, trade press and public user reviews. This was desk research. We did not run any plant’s data through these tools.
We left out SolarAnywhere, Meteonorm and NSRDB because they are data feeds for expected-energy models, not analytics tools. We scored each tool on six tests.
- Use-case fit (35%): How well it does this page’s job. We look for loss tools that are written up: expected-energy models, loss breakdown, fault checks and peer benchmarks. These count three times as much as basic monitoring.
- User reviews (20%): Ratings from just a few reviews count for less. Almost every tool here has few reviews.
- Pricing (15%): Published prices score higher than quote only.
- Ease of use, support and momentum (10% each): Review sub-scores and dated product updates. We give a neutral score when there is no proof.
Tools whose core facts we could not confirm with the company lose 2 points. Read the full method: how we score software.
What are the three ways to find lost energy?
- Model-based: Compare output with an expected-energy model and split the gap by cause. Power Factors, 3E SynaptiQ and PowerTrack work this way, at plant and inverter level.
- Measured: Measure at fine detail instead of modelling. Sunsniffer puts a sensor in each module’s junction box. Solar Analytics reads inverter and circuit data down to 5-second steps.
- Inspection-based: Find defects in thermal images and put a value on them. Raptor Maps (also considered below) puts a power and money loss on each fault it finds.
1. Power Factors Unity: best for predictive analytics across utility-scale fleets
Best for: Performance engineers at IPPs (independent power producers) and large O&M firms. Score: 71.0/100.
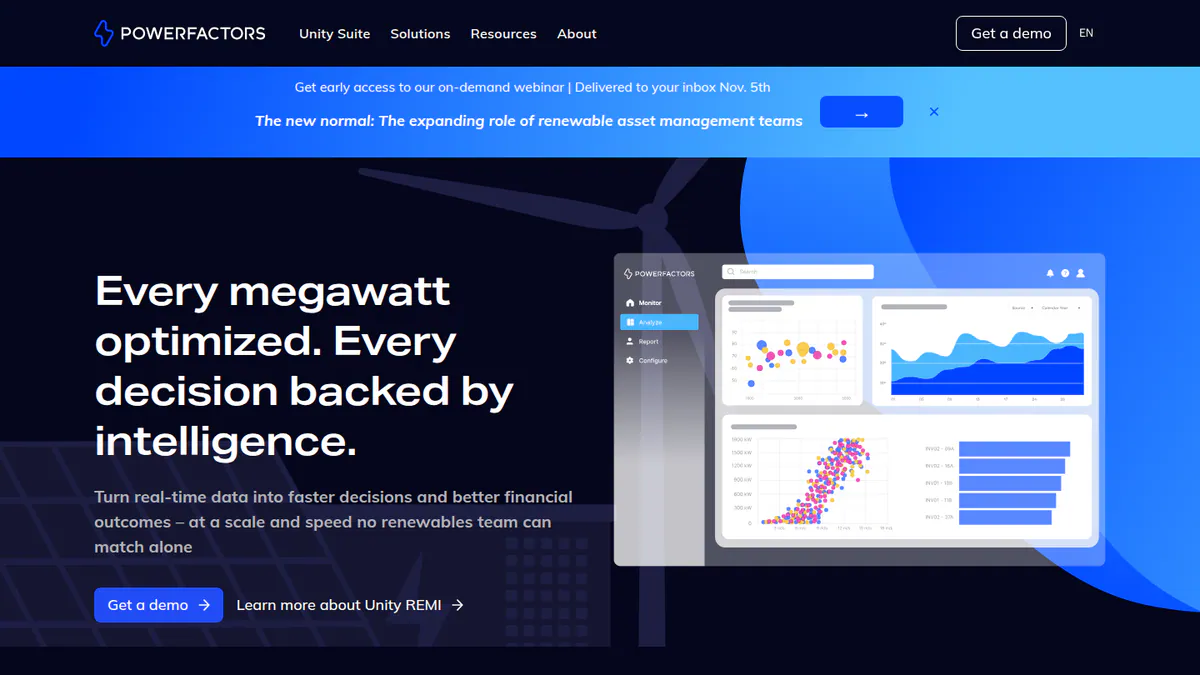
What it is: Unity is the Power Factors suite that joins products once sold as Drive, Greenbyte and BluePoint. For loss work, the key parts are asset performance management with Advanced Insights and the Unity REMI AI engine. REMI launched on 29 April 2026. Trade press says it is trained on 310+ GW of plant data and is live across 30+ GW in Unity.
Why we picked it: It ranks each event by lost energy and revenue, which is the core of this job. It gets full marks on our fit test, and its 2026 releases give it the top momentum score here.
Key features:
- REMI predictive analytics trained on a large plant dataset, with agentic workflows (AI that carries out multi-step tasks).
- Questions in plain English across fleet data.
- Events ranked by energy and revenue loss.
- Drill down from fleet to device, and sort events in the iOS app.
Pricing: Quote only, with a demo on the site. Checked October 2026 on the Power Factors website.
Pros (from our research):
- It ranks issues by lost energy and revenue, so your team fixes the costliest faults first.
- The same suite holds SCADA and work orders, so you do not need to export findings.
- It is actively built: REMI arrived in April 2026, with iOS app updates in May and July 2026.
Cons (from our research):
- It does not publish how it splits losses by type, so ask to see it in a demo.
- No published pricing.
- It is a full operating suite, which is a lot to buy if you only want a loss layer.
Reviews: App Store 5.0/5 (1 rating), checked October 2026.
Read our full Power Factors Unity review.
Want to see Power Factors Unity working? Book a demo with the SolarSoftwares team.
Book a demoYour request goes by email to the SolarSoftwares team. A time is set only after we reply. It does not change any score or ranking.
2. 3E SynaptiQ: best for loss categorisation without onsite sensors
Best for: Performance engineers with C&I (commercial and industrial) roof and utility fleets, mainly in Europe. Score: 66.0/100.
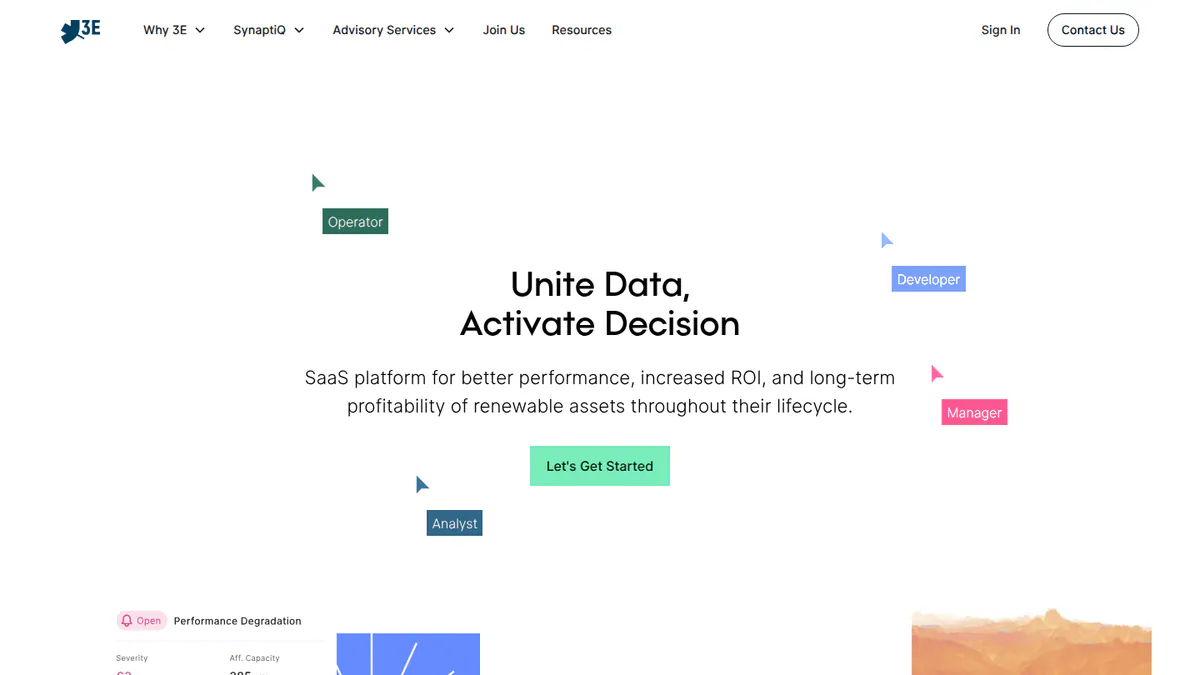
What it is: 3E SynaptiQ comes from Brussels and has the most detailed loss model on this page. Its physics-based digital twin splits losses into 21 types, 13 of which you can win back. A tool then ranks fixes by ROI (return on investment). A distributor listing puts the plants it links to at about 20 GW.
Why we picked it: No other tool here documents its loss model in this much detail. It also works on roof fleets with no sun sensors on site.
Key features:
- 21 loss types, 13 of them recoverable.
- Expected yield modelled from satellite data. Roof sites without pyranometers (sun sensors) still get a weather-adjusted baseline.
- Fixes ranked by ROI.
- Takes data from any brand, plus API and raw-data server access.
Pricing: Quote only, through contact sales or a demo. Checked October 2026 on the 3E SynaptiQ page.
Pros (from our research):
- It splits the loss you can win back from the loss you cannot, so you only chase what pays.
- Roof fleets with no sun sensors still get a weather-adjusted baseline.
- It is proven on roof fleets: clients include Insaver (70 roof plants), Sunrock and Everday.
Cons (from our research):
- No published pricing.
- It models losses rather than measuring each module.
- No user reviews to judge support or ease of use.
Reviews: No user reviews on G2 or Capterra as of October 2026.
What we could not confirm: whether it offers short-term power forecasts.
Want to see 3E SynaptiQ working? Book a demo with the SolarSoftwares team.
Book a demoYour request goes by email to the SolarSoftwares team. A time is set only after we reply. It does not change any score or ranking.
3. Sunsniffer: best for module-level diagnostics with sensor hardware (status unconfirmed)
Best for: Plant operators who want measured module and string data, once they check the firm is still trading (status unconfirmed). Score: 61.0/100.
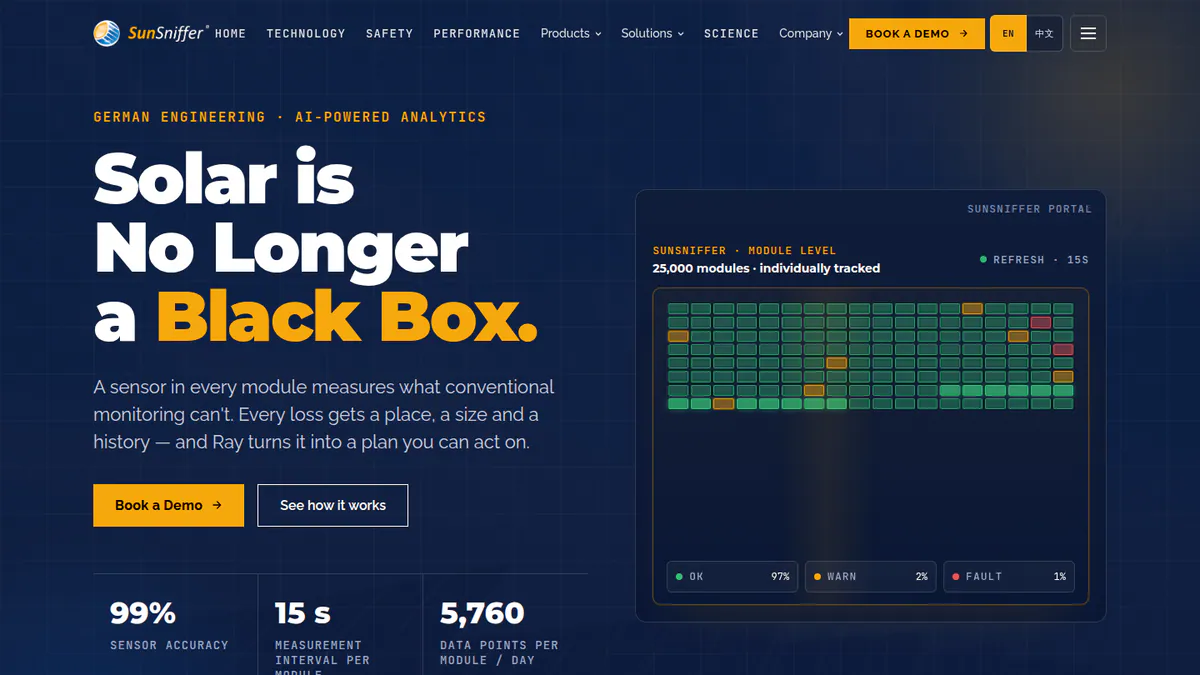
What it is: Sunsniffer is a German kit of sensors plus a web portal, from SunSniffer GmbH & Co. KG. Module sensors report voltage every 30 seconds. String readers measure current and voltage to 0.6% and send data over the power line.
Note: our tools could not open Sunsniffer’s pages, so every fact here comes from 2015-2020 press and datasheets. The website is live, but the latest dated paper is a 2020 datasheet, so treat the product as possibly dormant.
Why we picked it: It is the only tool here that measures every module instead of modelling losses. That direct data earned a high fit score, though its status is unconfirmed.
Key features:
- Voltage and heat sensors on each module.
- I-V (current-voltage) curves and diode checks for each string.
- Signs of PID (potential-induced degradation), cell cracks, soiling and wear.
- A 2018 "virtual flasher" digital twin that works out STC (standard test conditions) values per module.
- Retrofit kits for plants already built.
Pricing: No published pricing. PV Tech (November 2018) quoted the company’s own claim that the built-in sensor costs under 1 euro-cent per Wp. Checked October 2026 via the PV Tech article.
Pros (from our research, based on 2015-2020 papers):
- It measures each module directly, so losses are seen, not estimated.
- Data runs over the power line, so there is no extra data wiring.
- Retrofit kits suit plants that are already running.
Cons (from our research):
- No news or product updates found after 2020.
- It needs hardware on every module, not just software.
- No reviews to judge support or reliability.
Reviews: No user reviews found as of October 2026.
Want to see Sunsniffer working? Book a demo with the SolarSoftwares team.
Book a demoYour request goes by email to the SolarSoftwares team. A time is set only after we reply. It does not change any score or ranking.
4. PowerTrack: best for actual-vs-modelled tracking on mixed hardware
Best for: C&I and utility owners, EPCs and O&M teams with mixed inverter brands. Score: 59.9/100.
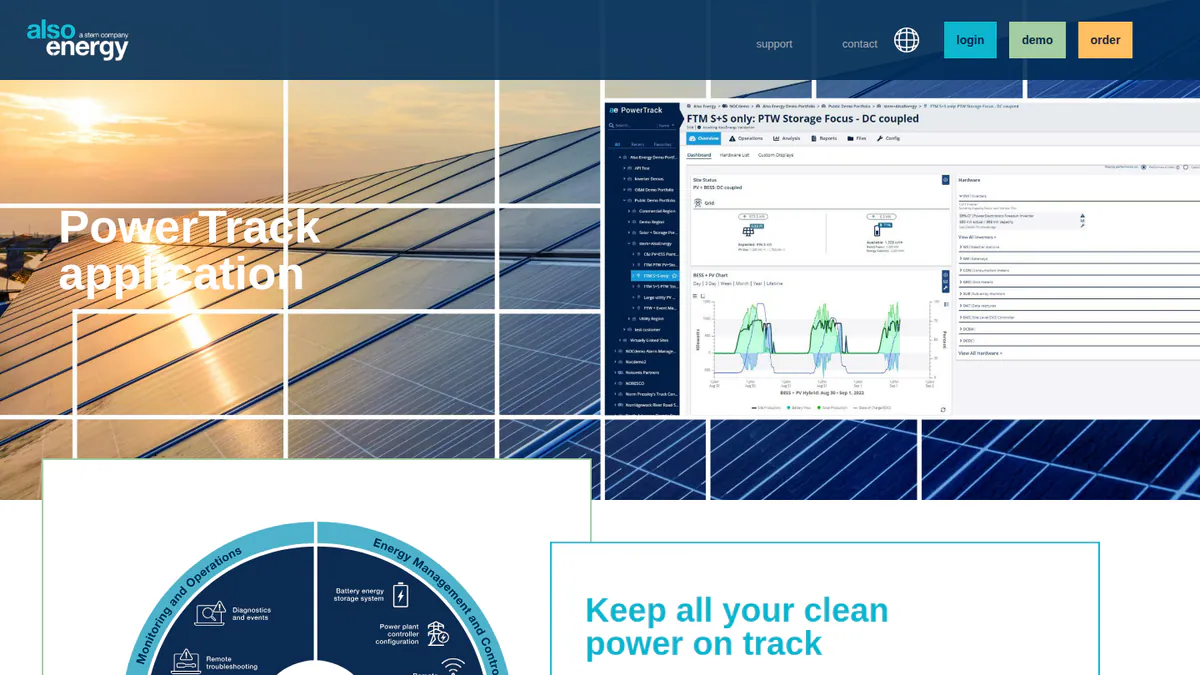
What it is: PowerTrack is AlsoEnergy’s monitoring and asset tool, and it works with any brand of hardware. Stem now owns AlsoEnergy, and the product is moving to the Stem PowerTrack name. It sets real output against modelled output across the fleet.
Why we picked it: It sets real output against a modelled baseline on mixed hardware, with weather data built in. It also has more user ratings than any other tool on this page.
Key features:
- Actual against modelled performance.
- Drill down to each device, and fix faults remotely.
- SolarGIS virtual weather data built in.
- Work orders from alert events.
Pricing: Quote only. Checked October 2026 on the AlsoEnergy website.
Pros (from our research):
- It works with mixed hardware, with links to Tesla Powerhub and the Enphase API.
- Built-in SolarGIS weather data feeds the modelled baseline.
- Alerts become work orders, and it links to third-party CMMS ticketing.
Cons (from reviews and our research):
- App reliability is mixed. Older App Store reviews report crashes and login failures, though recent ones say the latest version fixed them.
- One user says reliability problems led them to steer customers elsewhere.
- No published pricing.
Reviews: App Store 3.1/5 (42 ratings), checked October 2026. There is no G2 or Capterra listing. That low user rating cut its score.
Read our full PowerTrack review.
Want to see PowerTrack working? Book a demo with the SolarSoftwares team.
Book a demoYour request goes by email to the SolarSoftwares team. A time is set only after we reply. It does not change any score or ranking.
5. Solytic: best for root-cause alerts on published pricing
Best for: Installers and service firms in Europe that watch many small and mid-sized systems. Score: 59.2/100.
What it is: Solytic, from Berlin, reads 40+ inverter and logger brands with no extra hardware. S.E.E. (PV Secure) bought it in October 2024. It is alert-led and lighter than a loss-model tool, but its prices are public.
Why we picked it: It is the only tool here with a public price for European fleets of any size. Root-cause alerts help you decide whether a site visit is needed.
Key features:
- Real-time alerts you can set up, with root-cause details. These help a technician decide if a site visit is needed.
- Portfolio view across mixed fleets.
- Automatic tickets.
- GraphQL API (a flexible data link for developers).
Pricing: Corporate clients only, checked October 2026 on the Solytic pricing page.
- Sites up to 200 kWp (kilowatts of peak panel power): EUR 5 per site per month, plus EUR 60 setup per site.
- Sites above 200 kWp: EUR 0.02 per kWp per month, plus EUR 0.50 per kWp setup.
- White-label licence: EUR 500 per month plus monitoring fees, with a one-year minimum.
Pros (from our research):
- Public per-site and per-kWp prices let you cost a fleet before you call sales.
- It covers 150+ data protocols, so mixed fleets connect without extra hardware.
- You can try it with free demo access and no credit card.
Cons (from our research):
- It is alert-led, with no written-up loss-type model, so it flags faults rather than lost energy by cause.
- The latest dated product update we found is from February 2021.
- No user reviews to judge it.
Reviews: No user reviews on G2 or Capterra as of October 2026.
Want to see Solytic working? Book a demo with the SolarSoftwares team.
Book a demoYour request goes by email to the SolarSoftwares team. A time is set only after we reply. It does not change any score or ranking.
6. Solar Analytics: best for Australian residential and small commercial fleets
Best for: Australian solar retailers and installers who sell monitoring with their systems. Score: 59.2/100.
What it is: Solar Analytics runs automatic checks for faults, shade and low output, on data down to 5-second steps. Catch Power said in May 2024 that it was buying the company. It works with Fronius, Sungrow, GoodWe, GE Solar and LG inverters.
Why we picked it: It is the clear choice here for Australian home and small business fleets. Prices are public, and you can trial it for 30 days.
Key features:
- Automatic checks for faults, shade and low output.
- Data down to 5-second steps.
- Power use tracked per circuit when a device is fitted.
- Load control through CATCH Control. The old Wattwatchers device closed to new installs on 1 July 2026. New hardware sales go through CATCH Control.
Pricing: Inverter-linked plans cost AUD 6 per inverter per month including GST, AUD 60 per year, or AUD 250 for five years paid up front. It is free with CATCH Control hardware, which the retailer quotes with the install. The page’s meta description shows AUD 5.99 and 59.99 (Solar Analytics pricing page, checked October 2026).
Pros (from user comments and our research):
- Some users praise the product after the CATCH move (SolarQuotes comment thread, April 2026).
- Analytics come free with CATCH Control hardware, so customers pay no monthly fee.
- You can try it for 30 days, then pay a published AUD 6 per inverter per month.
Cons (from user comments):
- Support is mixed: some users praise it, but several report slow or unanswered emails.
- The 3G shutdown forced hardware swaps and lost data.
- New customers can no longer buy lifetime plans.
Reviews: No G2 or Capterra listing. Google Play shows 10,000+ installs of the My Solar app with no rating (checked October 2026).
What we could not confirm: an installer fleet portal on the company’s pages.
Want to see Solar Analytics working? Book a demo with the SolarSoftwares team.
Book a demoYour request goes by email to the SolarSoftwares team. A time is set only after we reply. It does not change any score or ranking.
7. VCOM Cloud: best for alarm-led analysis on meteocontrol hardware
Best for: C&I and utility operators already on meteocontrol blue’Log dataloggers. Score: 57.2/100.
What it is: VCOM Cloud is meteocontrol’s monitoring and portfolio tool, from Augsburg. It watched 50,000 systems and about 18 GWp as of December 2020. Its strengths for loss work are clean data from its own loggers and alarm rules that open tickets. Logins are moving to meteocontrol’s mc Cloud.
Why we picked it: It suits fleets already on meteocontrol loggers, where data quality is high. Its API lets your own engineers run the deeper loss work.
Key features:
- Portfolio monitoring and data hosting.
- Alarm rules and automatic tickets.
- Custom report templates.
- VCOM API to export data into your own analysis.
Pricing: Quote only. Checked October 2026 on the VCOM O&M app page.
Pros (from our research):
- A long track record, so the platform is well tested on large fleets.
- Logger and cloud come from one company, so you have one supplier to call.
- The API lets your own team run deeper analysis.
Cons (from our research):
- It is built around meteocontrol loggers, so mixed fleets fit less well.
- Quote only, with no published prices.
- No user reviews to judge it.
Reviews: No user reviews on G2 or Capterra as of October 2026.
What we could not confirm: how it finds losses, such as an expected-energy model or loss breakdown. Ask for a demo of its low-output analysis before you buy it for that job.
Read our full VCOM Cloud review.
Want to see VCOM Cloud working? Book a demo with the SolarSoftwares team.
Book a demoYour request goes by email to the SolarSoftwares team. A time is set only after we reply. It does not change any score or ranking.
How do the 7 solar performance analytics tools compare?
Product | Expected-energy baseline | Loss breakdown | Granularity | Prioritisation | Starting price |
|---|---|---|---|---|---|
APM and REMI (method not public) | Not documented publicly | Fleet to device | Energy and revenue loss | Quote only | |
Satellite irradiation, physics-based | 21 categories (13 recoverable) | Not documented | ROI-ranked actions | Quote only | |
Virtual flasher, STC per module (2018) | PID, cracks, soiling, diodes, degradation | Module and string | Not documented | Quote only | |
Modelled, SolarGIS weather option | Not documented | Device level | Alert severity | Quote only | |
Not documented | Root-cause alerts | Site | Alerts | EUR 5/site/month | |
Not documented | Fault, shading, under-performance | Inverter and circuit | Alerts | AUD 6/inverter/month | |
Not documented | Not documented | Not documented | Alarms to tickets | Quote only |
Also considered
- Raptor Maps (scored 53.9/100): It puts a power and money loss on each fault found in drone thermal images, and tracks wear between inspections. It is not in the top 7 because it has no expected-energy or loss-type model, and pricing is quote only. See our drone inspection ranking.
- kWh Analytics HelioStats (scored 43.5/100): A benchmark database with data on 300,000+ US projects, built for lenders, investors and insurers. It is not in the top 7 because it is not a fault-finding tool, and we could not confirm it is still sold as stand-alone software.
- SolarAnywhere: A sun and weather data service from Clean Power Research. It feeds expected-energy models but is not analytics software, so it is not ranked.
- Design-stage tools (PVsyst and similar): Left out because they model yield before a plant is built. See our solar simulation software page.
- Sitemark and Zeitview: Inspection tools that rank defects by estimated lost output. We score them on our drone inspection page instead.
- GreenPowerMonitor and BaxEnergy: Large suites with analysis and loss modules. We rank them for the owner’s and operator’s view on our asset management and solar farm management pages.
How do you choose solar performance analytics software?
- Run utility-scale fleets and want analytics in the same suite as SCADA and work orders? Pick Power Factors Unity.
- Want losses split into named types you can win back, even on roofs with no sensors? Pick 3E SynaptiQ.
- Fleets already on PowerTrack or VCOM should test those low-output views before adding a second tool.
- European installers with many small systems and a fixed budget can start with Solytic’s root-cause alerts at EUR 5 per site per month.
- If you sell systems in Australia and want fault checks bundled with the sale, choose Solar Analytics. Plan for slow support replies.
- When losses hide at module level, pair data analytics with drone thermal scans from a tool such as Raptor Maps (also considered). Consider Sunsniffer sensors only after you confirm the firm’s status.
- Lenders or insurers who want to benchmark a portfolio should ask kWh Analytics if HelioStats (also considered) is on sale as a product.
For installer fleet dashboards rather than deep loss analysis, see our fleet monitoring for installers ranking.
Want more choices? Browse every tool we checked in our monitoring and asset management category.
Solar performance analytics software FAQs
How do you detect underperformance in a solar PV system?
You compare measured output with what the weather says the plant should make, then study the gap. Tools do this with models, sensors or images. As of October 2026, PowerTrack tracks actual against modelled output, and 3E SynaptiQ models expected yield from satellite data.
What is performance ratio (PR) and how is it calculated?
PR is the energy a plant made divided by what it would make at its rated DC size in the sunlight it got. That takes the weather out. A falling PR shows a loss but not its cause. 3E SynaptiQ splits losses into 21 types (October 2026).
What is the difference between solar monitoring and performance analytics?
Monitoring logs output and raises alarms when a device fails. Analytics explains slow, silent losses such as soiling, shade, clipping and wear, and puts a value on them. 3E SynaptiQ and Power Factors show the most analytics in our October 2026 ranking. See our solar monitoring page for monitoring.
How do weather-adjusted expected-energy models work?
They run measured or satellite sunlight and heat data through a model of the plant. The result is what the plant should have made in that time. 3E SynaptiQ uses satellite data, so sites need no pyranometer. PowerTrack takes SolarGIS virtual weather data (October 2026).
What causes power loss at solar assets?
Common causes are string outages, hotspots, PID, cell cracks, soiling, shade, weeds, failed diodes and connectors, tracker faults and wear over time. Sunsniffer’s papers list signs of PID, cracks, soiling and wear. Drone tools such as Raptor Maps (also considered above) find hotspots and string outages in thermal images.
Sources
All checked 22 to 25 October 2026.
- Power Factors: website, Solar Power World, April 2026, App Store
- 3E SynaptiQ: product page, case study, distributor listing, Insaver story
- Sunsniffer: pv magazine, PV Tech, 2018, sensor datasheet, 2020
- PowerTrack: AlsoEnergy, what’s new, App Store
- Solytic: pricing, product update
- Solar Analytics: pricing, subscription help, SolarQuotes
- VCOM Cloud: O&M app, ticket system help
- Raptor Maps: website, Solar Builder, 2021, App Store
- kWh Analytics HelioStats: US DOE success story, company profile
- SolarAnywhere: Clean Power Research
Last updated 28 October 2026. Next scheduled review: 23 January 2027.