Key takeaways
- Billed demand can be higher than the month’s own peak. Alberta’s guide shows a 50 kW peak and 85% ratchet billing 42.5 kW for the next 11 months.
- In our example (12 USD per kW, 80% ratchet), the ratchet raised the year’s bill from 16,380.00 to 18,513.60 USD.
- In the same example, one 38 kW July spike cost 456.00 USD with no ratchet and 3,830.40 USD with the ratchet.
- Interval length changes the reading: a 200 kW burst was billed anywhere from 200 down to 108 kW.
- Of the four tools listed, three document ratchet or billing-demand inputs.
To size a battery against a billed demand peak, see the best solar battery storage design software.
Demand charge management at a glance
Demand charge management works on the kW the utility bills, not the kWh used. Start by reading the tariff.
| Item | Detail |
|---|---|
| Formula | Charge = billed demand (kW) × price per kW. Billed demand is the largest of the month’s peak, any ratchet floor and any minimum. |
| Unit and range | kW averaged over an interval. Sources describe 15, 30 or 60 minutes. Our example uses 12 USD per kW per month. |
| Where it matters | Commercial and industrial sites on demand tariffs, and battery and controls proposals. |
| Standard or rule | No standard. Each utility tariff sets the interval, the ratchet and the price. |
| In software | Rate engines that read tariffs and interval data (see below). |
Why does demand charge management matter for installers?
Demand charges can be a large share of a commercial bill. A proposal that ignores them can get the saving wrong. A July 2017 Berkeley Lab briefing said demand charges "often comprise 50% or more of the customer bill". That is a 2017 figure, so read the customer’s own bill.
The same briefing says billing demand is an average over a set interval, "from 15 minutes to an hour or more". Solar that cuts kWh may leave the billed kW unchanged. For battery sizing and the 15-minute maths, see peak shaving. This page covers how the charge is built and how it stays on the bill.
How is a demand charge billed?
The meter records average kW in each interval. The bill uses the highest reading, then applies tariff rules to set billed demand.
- The meter averages load over the tariff’s interval. Massachusetts OTA says this is "typically 15, 30 or 60 minutes".
- The highest interval in the billing month is the measured demand. El Paso Electric’s Schedule 24 defines it as "the highest measured thirty (30) minute interval kW load during the billing month".
- Next, the tariff sets billed demand. Alberta’s guide says "The highest metered demand may not be the billing demand used."
- Billed kW is multiplied by the price per kW, which may vary by season or tier.
The same Berkeley Lab briefing lists seasonal rates, tiers and peak-hour windows as variations. Get the real tariff from a tariff rate database and match it to the site’s consumption load profile.
What is a demand ratchet?
A demand ratchet bills at least a set percentage of an earlier peak. PNNL’s FEDS page defines billed demand in one line. It is "the larger of the actual peak demand for the billing period, or a percentage of the highest peak reached during the previous X months".
Two sources give examples. PNNL says a 1,000 kW peak under a typical 80% ratchet is billed at 800 kW or more. That lasts for the next 11 months. Alberta’s guide (a Canadian example) gives 50 kW at 85%, which is 42.5 kW. Both pages are undated.
Ratchets differ. El Paso Electric’s Schedule 24 is Revision 21, effective 1 July 2025. It bills the highest of three. These are 15 kW, the maximum demand, or 60% of the highest summer (June to September) demand in the twelve-month period. The page does not confirm that the sheet is current, so always read the live tariff.
Worked example: a 12-month ratchet on example data
All inputs here are example. The site has 12 monthly peaks and pays 12 USD per kW. The ratchet is 80% over the previous 11 months, with a 10 kW minimum. We assume earlier years had the same peaks.
| Item | Value (example) |
|---|---|
| Monthly peaks Jan to Dec (kW) | 92, 90, 95, 105, 118, 140, 152, 148, 130, 108, 96, 91 |
| Ratchet floor | 80% of 152 kW = 121.6 kW |
| Months where the ratchet sets billed demand | 8: January to May and October to December |
| Annual charge, no ratchet | 16,380.00 USD |
| Annual charge, with ratchet | 18,513.60 USD (2,133.60 USD or 13.0% more) |
One spike. Now add 38 kW to the July peak (152 becomes 190 kW), in one year only.
| Case | Months with extra charge | Extra cost (example rate) |
|---|---|---|
| No ratchet | 1 (July) | 456.00 USD |
| 80% ratchet, 11-month look-back | 12 (July to the next June) | 3,830.40 USD |
The spike sets a new floor of 152 kW (80% of 190). That is 4 kW over August’s own peak, so it adds cost at once. From October the floor is 152 kW, against 121.6 kW without the spike. That is a 30.4 kW gap. The total, 3,830.40 USD, is 8.4 times 456.00 USD.
Limits: the model looks back over the previous N months and ignores the current month. Real sheets differ, as the El Paso case shows. We do not model power factor, kVA, tiers or seasons.
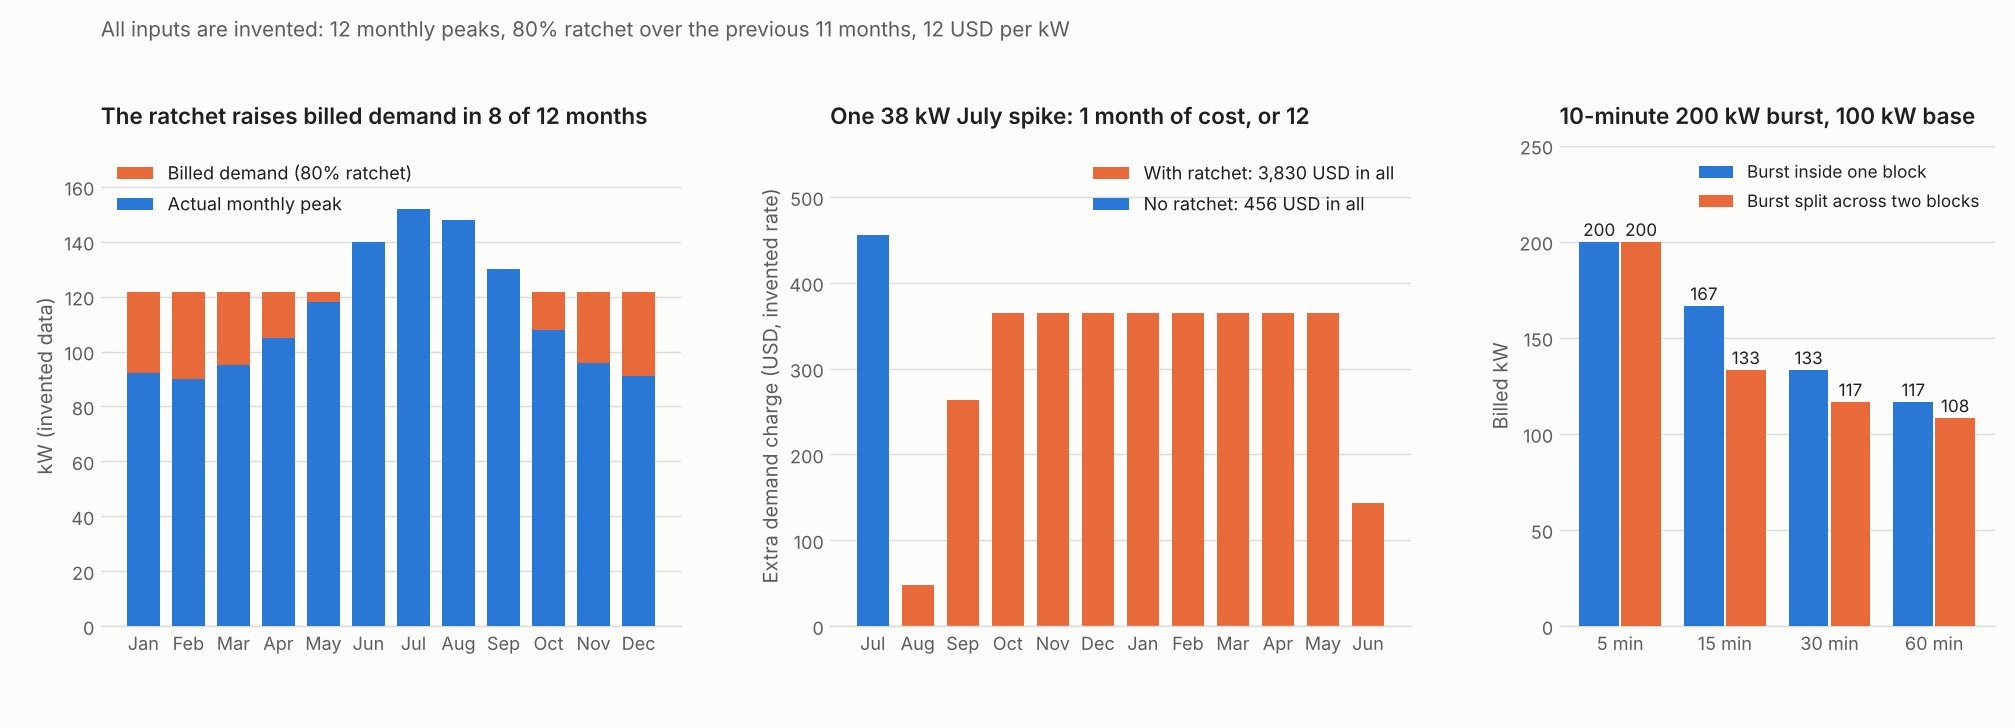
Figure 1 (example data). An 80% ratchet raised billed demand in 8 of 12 months, and one 38 kW spike cost 12 months of extra charge instead of one.
Demand charge ratchet calculator
Enter 12 monthly peaks from the customer’s bills, then the tariff’s price, ratchet percentage, look-back and minimum. It shows billed demand by month and the cost of one spike. The defaults give the same numbers as the tables above. The calculator’s look-back runs from 0 to 11 months.
How does the interval change the reading?
A short interval reads a burst at full height. A long one dilutes it. Match any analysis to the tariff’s own interval. This example’s burst is 200 kW for 10 minutes on a 100 kW base load.
| Interval | Billed kW, burst inside one block | Billed kW, burst split across two blocks |
|---|---|---|
| 5 minutes | 200.0 | 200.0 |
| 15 minutes | 166.7 | 133.3 |
| 30 minutes | 133.3 | 116.7 |
| 60 minutes | 116.7 | 108.3 |
The 5-minute burst fills a whole block either way. A rolling window finds the worse alignment, so it matches the left column. HOMER Grid’s manual says to use load data with the same time-step as a sub-hourly peak interval. Hourly data hides short peaks, as the peak shaving page shows on its own data.
What are the ways to manage demand charges?
Two ways to cut the peak appear in the sources. Pick by what the site can change.
- Storage: a battery can cover the peak. See peak shaving.
- Load control: Massachusetts OTA advises extending or staggering equipment start-up and using soft starters on large motors.
In a proposal, Energy Toolbase’s October 2025 blog recommends caution. Remove demand savings from year one, or use its demand throttle to cut demand by a chosen percentage.
How solar software handles demand charge management
Three of the four tools we checked in October 2026 document ratchet or billing-demand inputs, and the Aurora page we cite does not.
| Software | Models ratchets or billing demand? | Source |
|---|---|---|
| HOMER Grid | Yes | HOMER Grid manual 1.10, UL LLC 2022, undated |
| Energy Toolbase (ETB Developer) | Yes | ETB help article, undated. ETB blog, 9 October 2025 |
| SAM | Yes | PySAM Utilityrate5 docs, version 3.0.0, no date |
| Aurora Solar | Not stated | Aurora blog |
Not stated: the company page we cite does not say.
What each page says:
- HOMER Grid: Seasonal ratchet set as "a percent of the peak demand for the ratchet period". 15, 30 or 60 minute intervals.
- Energy Toolbase (ETB Developer): "Our utility rates account for a variety of demand ratchets". Uses monthly bills and interval data. A 9 October 2025 blog names Billing Demand Configurations.
- SAM: PySAM 3.0.0 lists "Enable billing demand ratchets" and a look-back period of 0 to 12. The SAM desktop help is not cited.
- Aurora Solar: A blog (3 May 2017, modified 1 May 2024) shows a chart of the demand share of a bill. It does not mention ratchets or say how the tool calculates demand.
Our ranking of the best solar battery storage design software covers storage sizing, and the best commercial solar design software list covers commercial site design.
Common mistakes with demand charge management
FAQs
Is demand charge management the same as peak shaving?
Peak shaving is one method, usually with a battery. Demand charge management also covers reading the tariff, ratchets, load control and billing checks. Peak shaving has its own page.
What is billing demand?
Billing demand is the kW the utility multiplies by the demand price. Alberta’s guide says it may not be the highest metered demand. It can include a minimum or a ratchet.
How long does a ratchet last?
The PNNL and Alberta examples use 11 months, and El Paso Electric uses a twelve-month window of summer peaks. The tariff sets the length, so read the live sheet.
Do I need interval data to quote?
Yes, for a firm number. Use data at the tariff’s interval length. Monthly bills show only the billed peak, not how long it lasted. Label any saving without interval data as an estimate.
Related terms
- Peak shaving: cutting the peak, usually with a battery.
- Tariff rate databases: where the real tariff comes from.
- Time-of-use optimisation: moving load to cheaper hours.
- Peak load and base load: two readings of site demand in kW.
Next step: pull the customer’s tariff sheet and interval data, then test a battery against the billed peak in the best solar battery storage design software. For the wider site, see the best commercial solar design software.
Sources
- PNNL FEDS: what is a demand ratchet, undated (checked October 2026).
- Alberta Utilities Consumer Advocate: Demand charge, undated (checked October 2026).
- El Paso Electric, Schedule 24 General Service Rate, Revision 21, effective 1 July 2025 (checked November 2026).
- Berkeley Lab and NLR (formerly NREL): Exploring Demand Charge Savings from Commercial Solar, July 2017 (checked October 2026).
- Massachusetts OTA: Saving Money on Demand Charges and Power Factor, undated (checked October 2026).
- HOMER Grid manual 1.10: demand rate (checked October 2026).
- Energy Toolbase help: Understanding Demand Ratchets in ETB, undated, and ETB blog, 9 October 2025 (checked October 2026).
- NREL-PySAM 3.0.0: Utilityrate5 (checked October 2026).
- Aurora Solar blog: Making Sense of Demand Charges, 3 May 2017 (checked October 2026).
Last updated 3 November 2026. Next scheduled review: 3 February 2027.