Key takeaways
- Base load has no single reading. One invented shop-year gives 4.50 kW (lowest hour), 4.86 kW (5th percentile) and 5.00 kW (overnight median).
- The overnight base is not the daytime floor. The lowest solar-window hour was 9.32 kW. A modelled array first exported at 14.3 kWp DC, more than twice the 6.25 kWp implied by the overnight base.
- A few hours set the peak. The highest hour was 36.00 kW and the 20th-highest 25.31 kW, so load factor reads 0.285 or 0.405.
- Across 20 re-runs of the example load, the peak ranged from 31.7 to 38.4 kW, which shows how few spike hours set it.
- Solar at 30 kWp cut the highest grid-import hour from 36.00 to 32.34 kW (3.66 kW, 10.2%) because the peak falls at 17:00.
To see which tools take interval load before you size an array, see the best commercial solar design software.
Peak load and base load at a glance: why they matter for installers
Peak load is the most power a site draws. Base load is the steady floor of demand, but the lowest load in daylight is what solar output can always be used against. Both depend on the interval and period you read.
| Item | Detail |
|---|---|
| Formula | Peak = highest interval kW. Base = a stated low reading. Load factor = average kW divided by peak kW. |
| Unit / typical range | kW, from hourly or 15-minute intervals. Load factor runs from 0 to 1. |
| Where it matters | Array size where export is limited or poorly paid, battery power, backup and inverter ratings, demand charges. |
| Standard or rule | No single standard for base load. EIA’s glossary gives grid-level wording for base load, peak load and load factor. |
| In software | Interval load inputs, with the peak used for demand charges. Few tools name base load. |
The lowest daytime load decides how much solar output is used on site before any export, and the overnight base understates it. In the worked example below, a 14.3 kWp array first exports, against 6.25 kWp if you size to the overnight base. Peak load decides what a battery, backup inverter or generator must carry, and what a demand tariff bills. A wrong reading gives a wrong array, a wrong power rating or a wrong savings estimate. Ratios are on the self-consumption page and billing is on demand charge management.
How do the grid and customer meanings differ?
On the grid, base load is the steady minimum demand that some plants serve. On a customer’s meter it is the always-on load, such as refrigeration. Peak load is the maximum in both cases.
EIA’s glossary gives three definitions that matter here.
- Base load: "The minimum amount of electric power delivered or required over a given period of time at a steady rate".
- Peak load: "The maximum load during a specified period of time".
- Load factor: "The ratio of the average load to peak load during a specified time interval".
EIA’s Today in Energy article (21 February 2020) uses the customer sense: "The generally constant amount of electricity demand is called baseload". It links that load to appliances that run continuously. It also says US demand is lowest around 5:00 a.m. This page uses the customer meaning. Base-load and peaking power plants are a different subject.
How do you read base load and peak load from interval data?
List the interval kW values. Take the highest as the peak and choose a stated method for the base. Write the interval, the period and the method beside each number.
- Get 12 months of interval kW, values only. Convert kWh per interval to kW by dividing by the interval in hours (see consumption (load) profile).
- Find the peak: the highest value, with its date and hour. A 15-minute peak is never lower than the hourly average that contains it.
- Choose a base method: lowest interval, 5th percentile, overnight median or lowest value in the solar window.
- Work out load factor: average kW divided by peak kW. Average kW is the energy divided by the hours in the period (8,760 in a normal year).
- Test the peak: re-read it as the 20th-highest hour and see how far the answer moves.
The table below shows four base readings from the same example shop-year, in hourly steps. The solar window is the hours starting 09:00 to 15:00.
| Base-load reading | kW | When it suits |
|---|---|---|
| Lowest hour of the year | 4.50 | A hard floor. One odd hour can set it. |
| 5th percentile of all hours | 4.86 | Steady always-on load, ignoring the lowest 5% of hours. |
| Median of 00:00 to 04:59 | 5.00 | What a battery or backup carries overnight. |
| Lowest hour in the solar window | 9.32 | Array size without export. Weekday minimum: 11.84. |
The average, 10.25 kW, is not a base: it is more than twice the 5th percentile.
Worked example: one example shop and one modelled array
The load is example: a small shop with a cold room, hourly for a year, 89,808 kWh. The sun is modelled for Greensboro, NC, from NLR (formerly NREL) typical-year weather laid on 2023’s weekdays. Tilt 25 degrees south, 14% losses (assumed), DC/AC 1.2, no battery. None of it is measured data.
| Measure (example shop) | Value |
|---|---|
| Average load | 10.25 kW |
| Highest hour (starts 17:00, Wednesday 9 August) | 36.00 kW |
| 20th-highest hour | 25.31 kW |
| Hours above 25 kW | 21 of 8,760 |
| Load factor against the highest hour | 0.285 |
| Load factor against the 20th-highest hour | 0.405 |
| 5th percentile as a share of the peak | 0.135 |
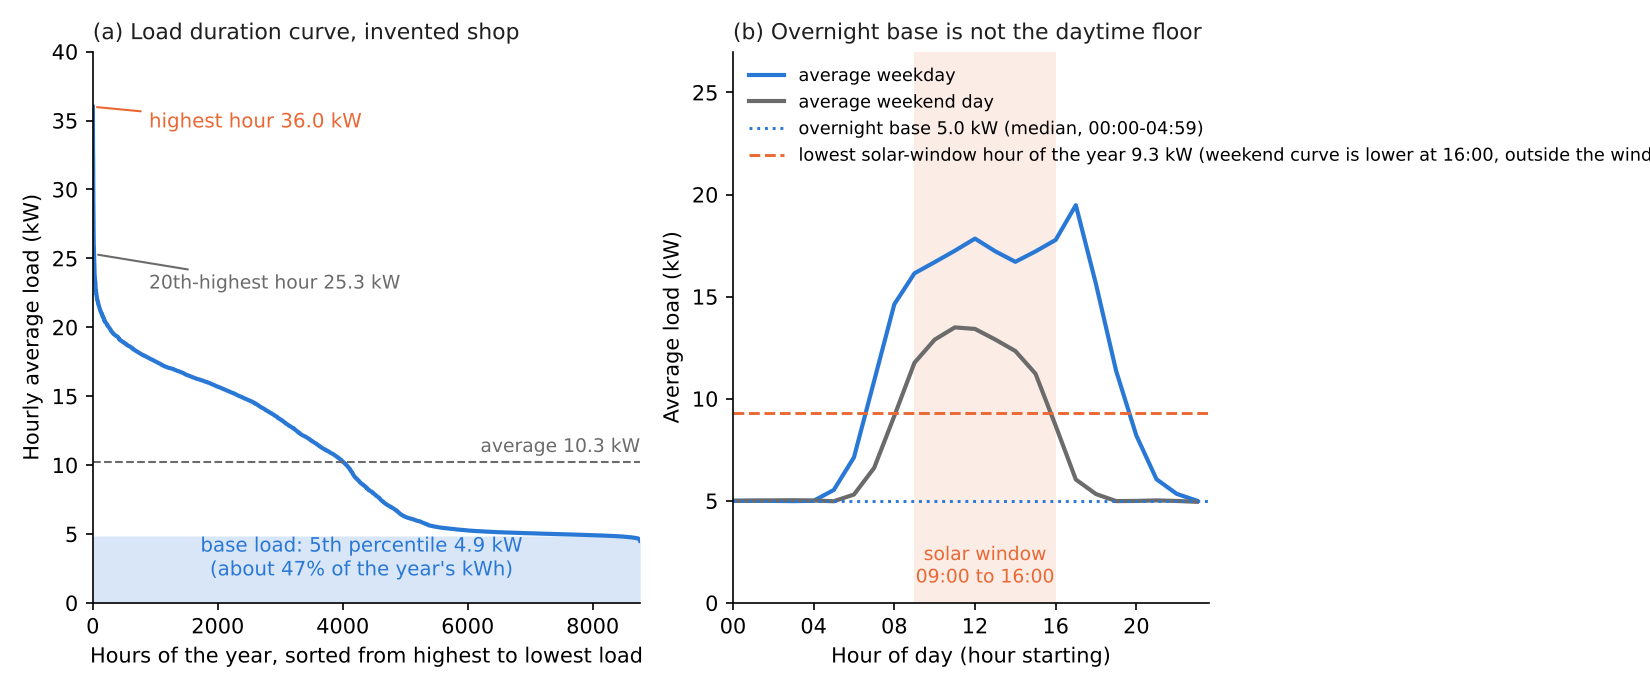
Figure 1. One example shop has a 36.0 kW highest hour, a 25.3 kW twentieth-highest hour and an overnight base near 5.0 kW, while its lowest solar-window hour is 9.3 kW.
Now size the array. Output scales with kWp (DC). The array peaks at 0.80 kW AC per kWp in this model. Export stays near zero until the array is large, while the peak cut grows steadily.
| Array (kWp DC) | Output (kWh) | Export: kWh, share of output, hours |
|---|---|---|
| 5 | 7,009 | 0 kWh, 0%, 0 hours |
| 10 | 14,018 | 0 kWh, 0%, 0 hours |
| 15 | 21,027 | 0.6 kWh, 0.003%, 2 hours |
| 20 | 28,035 | 248 kWh, 0.9%, 197 hours |
| 30 | 42,053 | 4,612 kWh, 11.0%, 1,166 hours |
The next table shows the highest grid-import hour for the same arrays.
| Array (kWp DC) | Highest grid-import hour (kW) | Cut from 36.00 kW (hour that sets it) |
|---|---|---|
| 5 | 35.23 | 0.77 (August) |
| 10 | 34.45 | 1.55 (August) |
| 15 | 33.68 | 2.32 (August) |
| 20 | 33.16 | 2.84 (July) |
| 30 | 32.34 | 3.66 (July) |
Export first appears at 14.3 kWp, in the hour from noon on Saturday 18 March, when the shop drew 11.2 kW. A quick check divides the lowest solar-window load, 9.32 kW, by 0.80 kW per kWp. That gives 11.7 kWp, below 14.3 because the lowest-load hour was not the sunniest. The 5.0 kW overnight base at 0.80 kW AC per kWp implies 6.25 kWp, less than half the size that first exports.
Solar only trims the peak. The highest hour starts at 17:00 on 9 August, when the model gives 0.155 kW per kWp. That hour falls by 3.09 kW at 20 kWp and 4.64 kW at 30 kWp. From 20 kWp up, a July 17:00 hour with 34.81 kW of load becomes the highest import hour. At 30 kWp the highest import hour is 32.34 kW, a 10.2% cut.
These are single-run values. Now take 20 other re-runs of the example load, with the same solar. The highest hour ranged 31.7 to 38.4 kW and load factor 0.267 to 0.319. The lowest solar-window hour ranged 8.7 to 9.7 kW and the first-export size 13.4 to 15.4 kWp. The 5th percentile held at 4.85 to 4.86 kW. The lowest hour ranged 4.35 to 4.53 kW.
What do the two numbers change in system sizing?
The lowest daytime load, not the overnight base, limits how large an array can be before it exports. Peak load limits what a battery, backup inverter, generator or service must carry. They rarely set the same size.
- Array: compare modelled output with the lowest load in the solar window, not the overnight base. Where exports earn less than imports cost, that gap sets the savings. See net billing.
- Battery and backup: power in kW follows the peak you must carry. Energy in kWh follows hours times load. See backup power and critical loads.
- Interval: our model is hourly. Equipment ratings and tariffs use their own interval, so read the document, not our table.
Peak and base load calculator
Paste interval kW values only, with no header row. It returns the peak, load factor, four base readings and the lowest solar-window value. It rejects negatives, text and commas inside numbers. The examples are example. The calculator also opens on its own page, which suits a phone.
How solar software handles peak load and base load
HOMER Pro and OpenSolar state a peak, Energy Toolbase states one in part, and Aurora Solar states none. Only Aurora names base load, as a kWh figure, and no tool reports a kW floor. Ratings come from the company’s own pages only.
| Software | Peak load? | Base load? | Page read |
|---|---|---|---|
| HOMER Pro | Yes | Not stated | HOMER Pro 3.16 manual, no date shown |
| OpenSolar | Yes | Not stated | OpenSolar support, bill-savings article, no date shown |
| Energy Toolbase | Partly | Not stated | ETB help, Storage Capacity Optimizer, no date shown |
| Aurora Solar | Not stated | Partly | Aurora help, energy consumption page, no date shown |
Not stated: the company page we cite does not say. Partly: the page covers only part of the term. What each page says:
- HOMER Pro: "The average load is reported in kWh/day but the peak load is reported in kW". Another page defines load factor as average load divided by peak load.
- OpenSolar: builds a demand (kW) profile. For demand charges it finds "the maximum hourly demand (kW)". It says "maximum demand", not peak.
- Energy Toolbase: the Storage Capacity Optimizer shows "Annual Peak Demand: displays the post-ESS Max Annual (kW) demand". That is the peak after storage only.
- Aurora Solar: takes 15, 30 or 60 minute interval data. Its modelled load profile lists "Base load (kWh)", defined as the minimum energy the home needs for essential equipment. It reports no kW floor.
Tools that take interval load data are in the best commercial solar design software list.
Common mistakes with peak load and base load
FAQs
Is base load the same as minimum load?
Not always. The minimum is the single lowest interval. Base load is usually the steady always-on level, so a percentile or a night median ignores odd low hours. Our four readings span 4.50 to 5.00 kW overnight and 9.32 kW in the solar window.
Does solar reduce peak load?
Only if the peak falls in daylight. In our model the highest hour started at 17:00, and 30 kWp cut the highest grid-import hour by 3.66 kW, or 10.2%. The customer’s own peak hour decides whether solar helps.
Is a low load factor bad?
It means the peak is high against the average, so equipment sized for the peak runs lightly. In our model it was 0.285 against the highest hour. It rose to 0.405 against the 20th-highest hour, so the peak definition matters.
Can I find base load from a monthly bill?
No. A bill gives kWh, and kWh divided by hours is the average kW, not the floor. For our shop that is 10.25 kW against a 4.86 kW 5th percentile. You need interval data.
Related terms
- Consumption (load) profile: a site’s use over time, in kWh or kW.
- Peak shaving: cutting a site’s highest kW, often with a battery.
- Demand charge management: how the highest kW is billed and how to cut it.
- Demand response: cutting load on request for a payment.
Next step: once you have the peak in kW, compare how battery tools size power against it in the best solar battery storage design software.
Sources
- Definitions. EIA glossary entries for base load, load factor and peak load (glossary letter P page), none dated. EIA, Hourly electricity consumption varies throughout the day and across seasons, 21 February 2020.
- Software. HOMER Pro load profile and load factor pages (3.16). OpenSolar bill savings. Energy Toolbase Storage Capacity Optimizer. Aurora, entering energy consumption. All opened October 2026.
- Worked example. NLR (formerly NREL) TMY3 file 723170 (Greensboro, NC) and pvlib 0.16.1.
Last updated 30 October 2026. Next scheduled review: 30 January 2027.