Key takeaways
- On SRP’s E-36 plan, one 15-minute reading sets the month’s demand charge. The winter price is 4.37 USD per kW over 5 kW.
- A 30 kW, 60 kWh battery cut the peak of our synthetic 151.9 kW month by 19.7%. At the winter price, that is worth 131.10 USD for the month.
- Deeper cuts needed far more energy: 15.4 kWh for a 10% cut, 49.9 kWh for 20% and 119.4 kWh for 30%.
- One 40 kW spike lifted the peak to 173.0 kW, and the same battery could then only hold 143.0 kW.
- Solar alone cut the peak by 0.0% for an evening-peak building and by 12.7% for a daytime-peak one.
To model a battery against a demand charge in software, see the best solar battery storage design software.
Peak shaving at a glance
Peak shaving pays by the kW cut in one interval, not by the kWh moved.
| Item | Detail |
|---|---|
| Formula | Demand charge = (monthly peak kW minus any uncharged kW) × price per kW. Saving = kW cut × price per kW. |
| Unit / typical range | kW over an averaging interval of 15, 30 or 60 minutes, per an NREL and Berkeley Lab study. SRP E-36 uses 15 minutes and 4.37 to 7.13 USD per kW by season. |
| Where it matters | Commercial proposals, battery sizing and tariff checks. |
| Standard or rule | No standard. Each tariff sets the interval, the price and any season or time window. |
| In software | Storage tools that dispatch against a tariff: HOMER, SAM and Energy Toolbase (see below). Compare them in the best solar battery storage design software. |
Why does peak shaving matter for installers?
On a 15-minute tariff, a demand charge prices the worst 15 minutes of the month. A battery sold on kWh saved will mislead the customer, so quote the saving on kW cut.
The peak is narrow. In our example month only 12 of 2,976 intervals (0.4%) were within 10% of the peak. That is why a small battery can cut the peak, and why one missed interval can wipe out a month’s saving.
You need the tariff and 15-minute data to quote it. See tariff rate databases and the consumption load profile.
How does peak shaving work with a battery?
The battery discharges whenever site load would push grid import above a chosen cap. It recharges when load is below the cap. The cap becomes the new billed peak.
- Collect 12 months of 15-minute load data and the tariff. Note the interval length, price per kW, season windows and any minimum billing demand.
- Find each month’s peak and the energy that sits above each possible cap.
- Set the battery power at the cut you want: peak minus cap, in kW.
- Set the energy to cover the deepest stretch above the cap, plus losses. Check the battery can recharge below the cap before the next peak.
- Price the saving month by month: kW cut × that month’s price per kW.
A battery kept ready for tomorrow’s peak cannot also be emptied to raise solar use today. For that job, see self-consumption. For kWh against kW and usable capacity, see battery storage design. For the wider practice, see demand charge management.
Why does solar alone often fail to cut the peak?
Solar cuts the peak only if it is producing during the peak interval. A peak after sunset gets nothing, and a passing cloud can set the month’s peak.
An October 2017 NREL and Berkeley Lab study simulated commercial customers. The study covered 15 building types, 15 cities and ten PV and ten storage sizes. Median billing demand cuts were 8% for solar alone. They were 23% for storage alone and 42% for both. Storage dispatch assumed perfect foresight, so storage results are an upper bound. The authors name poor match between solar and load. They also write that "passing clouds can cause solar generation to temporarily drop, setting that month’s peak".
The model tests this on two invented buildings with a 100 kWp array. It is clear-sky Phoenix with 4 overcast and 12 partly cloudy days, all assumed. The evening-peak building peaks after sunset, so solar cut its monthly peak by 0.0%. In the daytime-peak building, solar cut the best weekday’s peak by 34.9% but the month’s by 12.7%. A partly cloudy day set the peak. The same argument for homes, with 20 re-runs, is on the consumption load profile page.
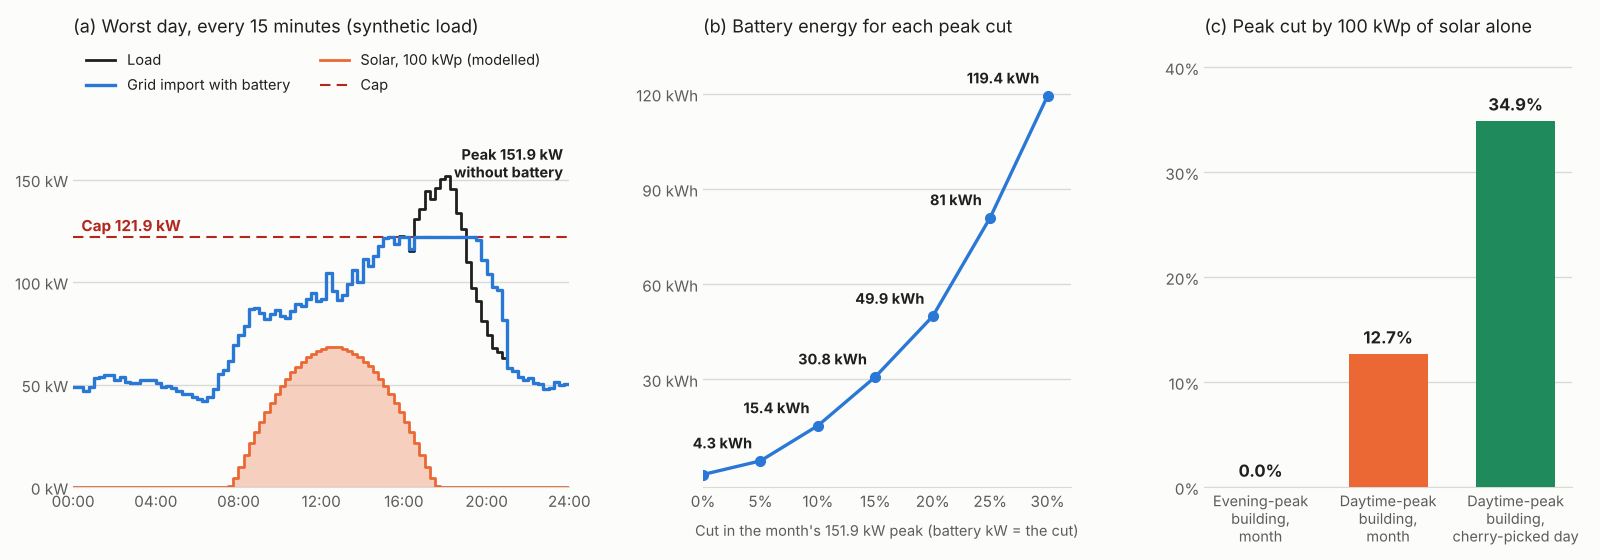
Figure 1 (synthetic load). A 30 kW, 60 kWh battery holds the worst day at 121.9 kW instead of 151.9 kW. Each extra slice of cut needs more energy. Solar alone cut the month’s peak by 0.0% in one building and 12.7% in the other.
Worked example: one synthetic month, 30 kW and 60 kWh
The data are synthetic. We generated a 15-minute load for 31 days (2,976 readings, one random draw). It is shaped like a shop that trades into the evening. It is not measured, not from an open dataset and not an SRP customer. SRP’s plan supplies only the price.
| Input | Value |
|---|---|
| Load | Synthetic, 15-minute, 31 days from Thursday 1 January 2026. Mean 67.8 kW, 50,416 kWh. |
| Battery | 30 kW, 60 kWh usable, 90% round trip (assumed), starts full. Discharges to hold a cap and recharges only below it. |
| Solar test | 100 kWp, south, 20 degree tilt, 0.80 derate. Clear-sky model with example cloud days. |
The tariff is SRP Standard Price Plan for General Service (E-36):
- Ratebook "Effective: November 2025 Billing Cycle", with a transmission cost adjustment decrease from the January 2026 cycle.
- Winter (November to April) demand price is 4.37 USD per kW over 5 kW.
- Billing demand is "the maximum fifteen-minute integrated kW demand occurring during the billing cycle". The ratebook states no ratchet.
SRP’s website also has an older E-36 sheet (published 23 October 2023, winter price 4.56 USD per kW). We used the newer ratebook. Check the live sheet before quoting.
| Result | Before | After |
|---|---|---|
| Monthly peak (Wednesday 14 January, 18:00) | 151.9 kW | 121.9 kW |
| Demand charge: (peak minus 5 kW) × 4.37 | 641.95 USD | 510.85 USD |
| Saving: 30.0 kW × 4.37 | 131.10 USD (19.7% cut) | |
The battery discharged on 12 of 31 days. The 121.9 kW cap is the lowest this battery can hold, found with hindsight. A real controller must forecast, so treat it as a best case.
Battery needed for a given cut. Power equals the cut. Energy is the smallest that still holds the cap all month.
| Peak cut | Cut / cap (kW) | Energy (kWh) | Hours at full power | Winter saving (USD) |
|---|---|---|---|---|
| 5% | 7.6 / 144.3 | 4.3 | 0.57 | 33.21 |
| 10% | 15.2 / 136.7 | 15.4 | 1.01 | 66.42 |
| 15% | 22.8 / 129.1 | 30.8 | 1.35 | 99.64 |
| 20% | 30.4 / 121.5 | 49.9 | 1.64 | 132.85 |
| 25% | 38.0 / 113.9 | 81.0 | 2.13 | 166.06 |
| 30% | 45.6 / 106.3 | 119.4 | 2.62 | 199.27 |
The first 5% costs 0.86 kWh per percentage point. The last 5% costs 7.68, about nine times more. The saving per kW is flat, so the last kWh are the least profitable.
One spike. We added 40 kW to one interval, Friday 9 January at 17:30 (133.0 kW became 173.0 kW).
| Case | Monthly peak | What it means |
|---|---|---|
| No spike, no battery | 151.9 kW | Baseline. |
| Spike, no battery | 173.0 kW | Up 21.1 kW, so 92.21 USD more that month. |
| Spike, same 30 kW, 60 kWh battery | 143.0 kW | Power-limited: 173.0 minus 30. The old 121.9 kW cap is lost. |
| To remove only the spike’s excess | 151.9 kW | Needs 21.1 kW and 5.6 kWh. |
| To keep the old 121.9 kW cap | 121.9 kW | Needs 51.1 kW and 48.8 kWh. |
A spike is cheap to shave if the battery has spare power and charge at that moment. It is costly if not.
Solar alone. Same 100 kWp array, two example buildings. Building A is the shop above. Building B peaks mid-afternoon, like an office.
| Case | Monthly peak before | Peak after | Cut |
|---|---|---|---|
| A: evening peak, solar only | 151.9 kW | 151.9 kW | 0.0% |
| A: solar plus the same battery | 151.9 kW | 121.9 kW | 19.7% |
| B: daytime peak, solar only, month | 149.3 kW | 130.4 kW | 12.7% |
| B: solar only, best weekday of the month | Day’s own peak | Day’s own peak | 34.9% |
In building B, solar cut the day’s peak by 15% or more on 14 of 22 weekdays. The month still gets only the worst day’s cut.
Re-run check. One month is one random draw, so we re-ran the example month 20 times with a new random draw each time. The month above is one of those draws.
- Building A’s peak ran from 137.4 to 170.5 kW.
- The 30 kW, 60 kWh cut ran from 16.1% to 21.6%.
- Energy for a 20% cut ran from 25.8 to 91.4 kWh.
- For B, solar cut the month’s peak by 7.2% to 27.3%, against 28.5% to 41.1% for the best weekday.
Limits. We model no battery ageing, derating or reserve. Round trip efficiency is assumed. We ignore kVA charges, ratchets and one-off site limits. We give no battery cost, payback or annual saving.
Peak shaving battery calculator
The calculator runs your own 15-minute month. Paste one kW reading per line and set the battery. It shows the peak before and after, the saving, and the battery needed for a target cut. The page’s example data is loaded by default.
How solar software handles peak shaving
Of the five tools read, HOMER Grid, HOMER Pro and SAM say they dispatch a battery against the demand charge. Energy Toolbase partly does, and PVsyst’s page does not mention demand charges.
| Software | Models demand-charge peak shaving? | Method | Source |
|---|---|---|---|
| HOMER Grid | Yes | Modelled, with a 48-hour look-ahead | HOMER Grid manual 1.10, © 2022, Oct 2026 |
| HOMER Pro | Yes | Modelled. Lower the grid purchase capacity in steps | HOMER knowledge base, undated, Oct 2026 |
| SAM | Yes | Modelled. Forecast-based, recalculated every 24 hours | SAM webinar slides, 20 Sep 2023. Current help pages not cited |
| Energy Toolbase (ETB Developer) | Partly | Modelled | ETB help article, undated, Oct 2026 |
| PVsyst | Not stated | Not stated | PVsyst help, undated, Oct 2026 |
Not stated: the company page we cite does not say. Partly: the page covers only part of the job. What each page says:
- HOMER Grid: sets a monthly limit on grid purchases. "HOMER Grid will strategically discharge batteries to lower the monthly demand charge." Time step not stated.
- HOMER Pro: demand rates are modelled. "Peak shaving requires the Advanced Grid module."
- SAM: a "Peak Shaving" battery dispatch option lists "Peak Demand Charges" as its use. It uses a load and generation forecast.
- Energy Toolbase: the Storage Capacity Optimizer charts demand savings and post-ESS annual peak demand. The article does not use "demand charge" or "peak shaving".
- PVsyst: its page defines peak shaving as storing energy when production exceeds grid injection limits. Demand charges are not mentioned.
This table rates demand-charge dispatch only, so it can differ from the battery storage design page, which rates battery sizing. The PVsyst row shows a trap: the same words can mean an export limit, not a demand charge. For commercial work, see the best commercial solar design software.
Common mistakes with peak shaving
FAQs
What is the difference between peak shaving and load shifting?
Peak shaving cuts the kW in a few intervals to lower a demand charge. Load shifting moves kWh from dear hours to cheap ones to lower an energy price. A battery can do both, but the rules for when it charges and discharges differ.
What data do I need before I quote?
You need at least 12 months of 15-minute meter data and the customer’s tariff sheet. Check the interval, the season windows, the price per kW and any minimum billing demand. Without interval data, mark the saving as an estimate.
Does a bigger battery always save more?
No. Returns fall as the battery grows. The study found diminishing returns with storage size for some buildings. Clipped peaks get wider. In our month, the last 5% of cut was costly. It took about nine times the energy per percentage point of the first 5%.
How much do demand charges cost?
A demand charge bills each kW of the month’s highest reading. One example is SRP’s E-36 plan, at 4.37 to 7.13 USD per kW by season, so a 30 kW cut saves 131.10 USD in a winter month. Other utilities set their own price and interval, so use the customer’s tariff.
Can solar alone do peak shaving?
Rarely. In our two example buildings, solar alone cut the monthly peak by 0.0% for the evening-peak shop and 12.7% for the daytime-peak one. A peak after sunset gets no solar, and a cloudy day can set the peak.
Related terms
- Demand charge management: the wider practice of controlling the charge.
- Battery storage design: choosing a battery’s kWh and kW.
- Consumption load profile: a site’s use over time.
- Tariff rate database: where the price per kW comes from.
- Self-consumption: using more solar on site.
- Peak load and base load: two readings of site demand in kW.
Next step: compare tools that dispatch a battery against a demand charge, such as HOMER and SAM, in the best solar battery storage design software list.
Sources
- SRP, 2025 Ratebook E-36 with TCA, "Effective: November 2025 Billing Cycle" (checked October 2026).
- SRP general-service page (checked 26 October 2026) shows the same 4.37, 4.73 and 7.13 USD per kW. An older E-36 sheet, published 23 October 2023, shows 4.56 and predates the November 2025 ratebook.
- SRP, older E-36 sheet, published 23 October 2023 (checked October 2026).
- SRP, E-32 sheet, published 23 October 2023 (checked October 2026).
- Gagnon et al., Solar + Storage Synergies for Managing Commercial-Customer Demand Charges, NREL and Berkeley Lab, October 2017 (checked October 2026).
- HOMER Grid manual, how Grid calculates demand charge savings (checked October 2026).
- HOMER knowledge base, peak shaving (peak lopping) (checked October 2026).
- SAM webinar, behind-the-meter battery dispatch, 20 September 2023 (checked October 2026).
- Energy Toolbase help, Storage Capacity Optimizer (checked October 2026).
- PVsyst help, grid systems with storage (checked October 2026).
Last updated 30 October 2026. Next scheduled review: 30 January 2027.