Key takeaways
- Air mass is about 1 / cos(zenith). That gives 1.00 overhead, 1.50 at a 48.19° zenith and 2.00 at 60°. The Kasten-Young formula gives exactly 1.5 at 48.26°.
- Module ratings use the AM1.5G reference spectrum, which integrates to 1,000.4 W/m² over 280 to 4,000 nm. Real site light shifts with sun height and altitude.
- The 1 / cos shortcut runs 0.3% above Kasten-Young at 60° and 3.1% above it at 80°. Near the horizon the error grows fast.
- AM1.5 is an absolute air mass. At 1,500 m (standard atmosphere, 84,556 Pa) the sun must sit at a 56.3° zenith to give 1.5, not 48.3°.
- At the example 52°N site, noon air mass was 1.62 on 20 March, 1.14 on 21 June and 3.91 on 21 December. Only June reached 1.5 or lower, for 6.85 hours.
To apply spectral correction in a yield model, see the best solar simulation software list. Pvlib and PVsyst document it.
Air mass and solar spectrum at a glance
Air mass says how much atmosphere the sun’s light crosses. The spectrum says what that light is made of. A module’s rating assumes one fixed spectrum, AM1.5.
| Item | Detail |
|---|---|
| Formula | Relative AM ≈ 1 / cos(zenith). Absolute AM = relative AM × site pressure ÷ 101,325 Pa (pvlib). |
| Unit / typical range | No unit. 1.0 with the sun overhead at sea level, rising towards about 38 at the horizon in the Kasten-Young formula. |
| Where it matters | The datasheet rating, spectral correction in yield models, and thin-film and CdTe yield. |
| Standard or rule | ASTM G173-03 (data via NREL, ASTM’s page lists G173-23 as the active version and G173-03 as historical). Module STC cites IEC 60904-3, as in the Qcells datasheet on the standard test conditions page. |
| In software | Air mass is computed inside simulation engines. Some apply it in a spectral correction. |
Why air mass and the spectrum matter for installers
They explain why a module rated at AM1.5 rarely sees that spectrum. They also explain why spectral losses differ by module technology. Sandia’s PVPMC treats it as one step between broadband plane-of-array irradiance and effective irradiance.
The rating itself is set under standard test conditions. See our standard test conditions page. HelioScope applies a spectral adjustment to CdTe modules. PVsyst corrects amorphous modules automatically when spectral correction is on. See thin-film solar.
Air mass is also a quick check on sun height. See DNI and solar irradiance.
How is air mass calculated?
Divide 1 by the cosine of the sun’s zenith angle. That is exact for a flat Earth and good for a high sun. Near the horizon, use a fitted formula such as Kasten-Young (1989).
- Find the sun’s zenith angle for the time and site. See solar zenith and incidence angle. pvlib says most air mass models expect the apparent zenith.
- Take relative air mass as 1 / cos(zenith) for a high sun. Sandia’s PVPMC calls this quite accurate below 80°. Our test puts it 0.7% above Kasten-Young at 70° and 3.1% above it at 80°.
- Near the horizon, use Kasten-Young: AM = 1 / (cos z + 0.50572 × (96.07995 − z)^(−1.6364)), with z in degrees. The exponent −1.6364 applies to the bracket (96.07995 − z), not to the whole sum. This is the form in pvlib’s code, and it is pvlib’s default model.
- For absolute air mass, multiply by site pressure and divide by 101,325 Pa. Get pressure from a measurement, or from altitude with pvlib’s alt2pres.
Table 1 feeds the same zenith number to each model. pvlib says Young 1994 expects the true zenith and the others expect the apparent zenith. So rows near the horizon include that difference.
Table 1. Relative air mass by model (pvlib 0.16.1).
| Zenith (°) | 1 / cos z | Kasten-Young 1989 | Young 1994 | 1 / cos z vs Kasten-Young |
|---|---|---|---|---|
| 0 | 1.00 | 1.00 | 1.00 | +0.0% |
| 30 | 1.15 | 1.15 | 1.15 | +0.1% |
| 48.19 | 1.50 | 1.50 | 1.50 | +0.1% |
| 60 | 2.00 | 1.99 | 1.99 | +0.3% |
| 70 | 2.92 | 2.90 | 2.90 | +0.7% |
| 80 | 5.76 | 5.59 | 5.54 | +3.1% |
| 85 | 11.47 | 10.31 | 10.06 | +11.3% |
| 88 | 28.65 | 19.43 | 18.06 | +47.4% |
Kasten-Young and Young 1994 agree within 0.3% up to 70°. At 88° they run from 18.1 (Young 1994) to 28.7 (1 / cos z). The 1 / cos z shortcut passes 1% error at 72.9° and 5% at 82.2° in our scan.
What is the AM1.5 spectrum?
AM1.5 is the reference sunlight spectrum behind module ratings. NLR (formerly NREL)’s page says ASTM G173-03 holds two terrestrial spectra. One is direct normal (AM1.5D). One is total (AM1.5G) on a plane tilted 37° towards the equator.
NREL lists these conditions: the 1976 U.S. Standard Atmosphere, 0.34 cm of ozone, 1.42 cm of water vapour and an aerosol optical depth of 0.084. It also lists an absolute air mass of 1.5. ASTM’s page says the tables assume a cloudless atmosphere favourable to PV. They were made with the SMARTS model. The 37° tilt represents the average latitude of the 48 contiguous US states. AM0 is the spectrum outside the atmosphere, as PVEducation puts it.
On the sea-level secant model, an absolute air mass of 1.5 means a zenith of 48.19°. Kasten-Young puts it at 48.26°. Sandia’s page gives the tilt as 38°. NREL and pvlib say 37°.
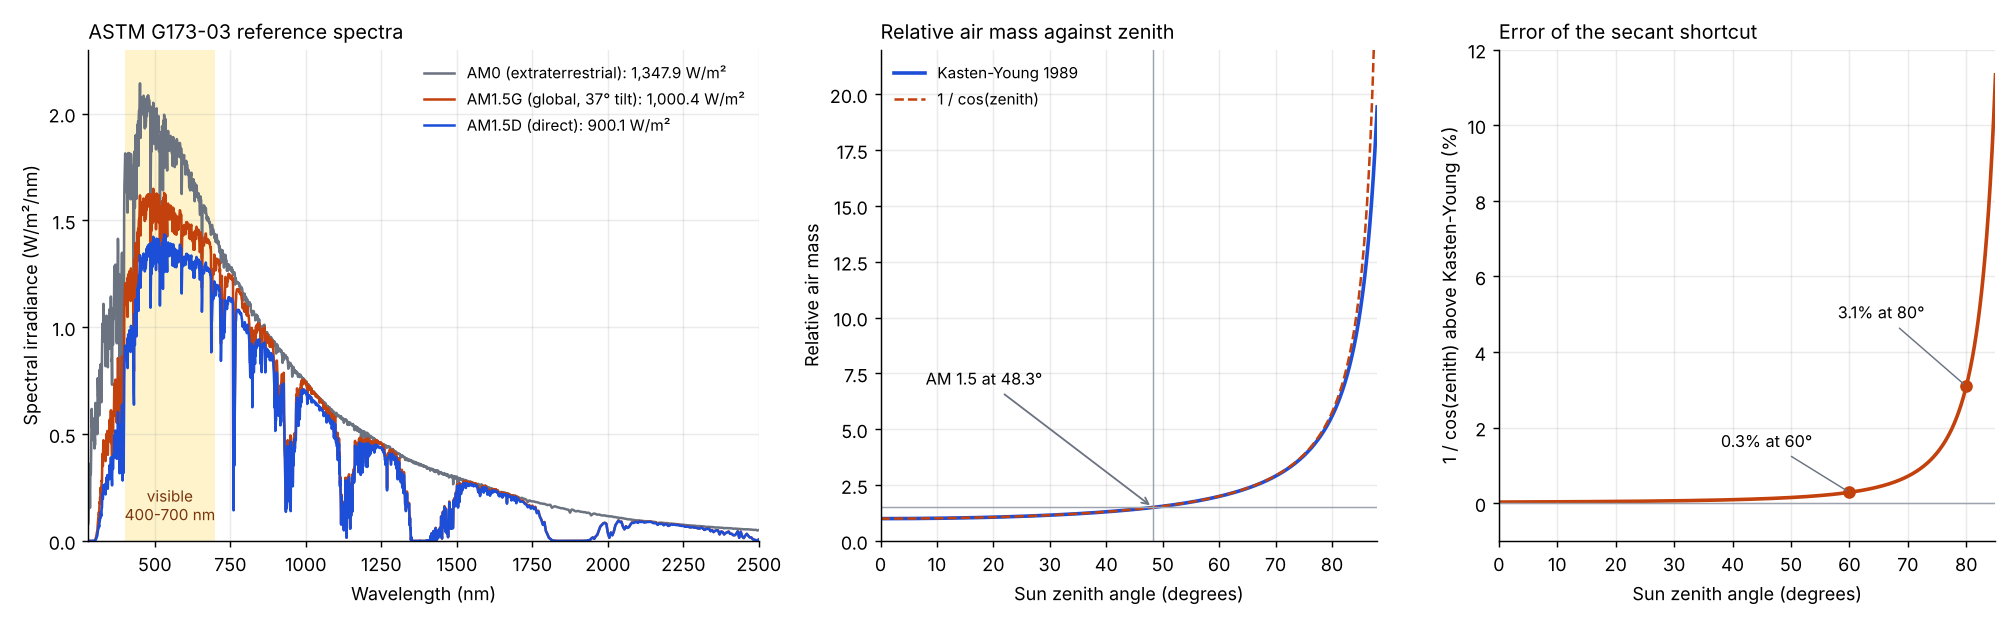
Figure 1. The direct spectrum totals 900.1 W/m², 33% below AM0, and the 1 / cos error grows fast above 70°. Totals integrate 280 to 4,000 nm. The plot shows to 2,500 nm.
The totals come from integrating pvlib’s copy of the G173 data. pvlib states about 1000.37 W/m² for the global spectrum, and we get 1000.37. PVEducation says AM1.5D can be approximated by reducing AM0 by 28%. On these totals the cut is 33.2%, so treat the 28% as a rough rule.
Worked example: air mass through the year, then altitude
At an example sea-level site at 52°N, the noon sun reached AM 1.5 only in summer. Inputs: 0°E, one-minute steps, apparent zenith from pvlib’s NREL SPA, Kasten-Young air mass, 2026 dates, UTC clock.
Table 2. Noon air mass and time at or below AM 1.5 (example site).
| Day | Noon apparent zenith (°) | Noon air mass | Daylight hours | Hours at or below AM 1.5 |
|---|---|---|---|---|
| 20 March | 52.02 | 1.62 | 12.12 | 0.00 |
| 21 June | 28.55 | 1.14 | 16.65 | 6.85 |
| 21 December | 75.38 | 3.91 | 7.68 | 0.00 |
The sun was never that high on 20 March or 21 December. In June, 6.85 of 16.65 hours qualified. Noon zenith is about latitude minus declination. So on an equinox, AM 1.5 at noon needs a latitude below about 48°. See the sun path diagram.
Altitude changes the answer. Table 3 keeps relative air mass at 1.50 (zenith 48.26°) and applies pvlib’s standard-atmosphere pressure.
Higher sites reach lower absolute air mass for the same sun position.
Table 3. Absolute air mass for a relative air mass of 1.50, by altitude.
| Altitude | Pressure, Pa | Pressure ÷ 101,325 | Absolute air mass |
|---|---|---|---|
| sea level | 101,325 | 1.000 | 1.500 |
| 500 m | 95,461 | 0.942 | 1.413 |
| 1,500 m | 84,556 | 0.835 | 1.252 |
| 3,000 m | 70,109 | 0.692 | 1.038 |
At 1,500 m the sun must drop to a 56.3° zenith before absolute air mass reaches 1.5. Real pressure varies with weather. See weather and solar resource data.
Spectrum detail (optional)
Table 4 shows how much power each wavelength band loses between AM0 and the AM1.5 spectra.
The atmosphere cuts UV most. Visible light holds up best.
Table 4. Power in four wavelength bands, W/m² (share of that spectrum). The band edges are our own round numbers.
| Band | AM0 | AM1.5D | AM1.5G |
|---|---|---|---|
| UV 280-400 nm | 102.8 (7.6%) | 30.5 (3.4%) | 46.1 (4.6%) |
| Visible 400-700 nm | 530.0 (39.3%) | 374.8 (41.6%) | 429.8 (43.0%) |
| Near-IR 700-1,100 nm | 377.3 (28.0%) | 305.1 (33.9%) | 328.6 (32.9%) |
| IR 1,100-4,000 nm | 337.8 (25.1%) | 189.7 (21.1%) | 195.8 (19.6%) |
| Total, 280-4,000 nm | 1,347.9 | 900.1 | 1,000.4 |
Going from AM0 to AM1.5D removes 70% of the 280 to 400 nm power. It removes 44% of the 1,100 to 4,000 nm power. The visible share rises from 39.3% to 41.6% of a smaller total.
How does the spectrum change as air mass rises?
More atmosphere removes blue light faster than red. The blue-to-red ratio of the direct beam (400 to 500 nm over 600 to 700 nm) falls as air mass rises. That shifts the light towards wavelengths that suit some cell types better than others.
Table 5 uses pvlib’s SPECTRL2 (Bird simple spectral model, cloudless sky, 300 to 4,000 nm). Inputs are G173-style: 101,325 Pa, 1.42 cm water, 0.34 cm ozone, aerosol optical depth 0.084, Kasten-Young air mass. The model is a lower-detail estimate. At AM 1.5 it gives 882 W/m² direct against 900 in G173 (-2.0%, 300 to 4,000 nm against 280 to 4,000 nm). Its blue-to-red ratio at AM 1.5 is 0.994 against 0.914 in the G173 direct data. Use the trend, not the levels.
Table 5. Modelled direct beam (SPECTRL2, modelled not measured) by air mass.
| Relative air mass | Direct beam total, W/m² | 400-500 nm, W/m² | 600-700 nm, W/m² | Blue-to-red ratio |
|---|---|---|---|---|
| 1.00 | 966 | 115.1 | 105.4 | 1.093 |
| 1.50 | 882 | 97.6 | 98.2 | 0.994 |
| 1.99 | 812 | 82.9 | 91.5 | 0.906 |
| 2.90 | 710 | 61.6 | 80.6 | 0.764 |
| 5.59 | 510 | 26.1 | 55.9 | 0.467 |
From AM 1.0 to 5.6 the modelled direct beam falls 47%, and the 400 to 500 nm band falls 77%. The 600 to 700 nm band falls 47%.
Air mass calculator
Enter an apparent zenith or elevation angle and an altitude or pressure. Defaults reproduce the AM1.5 sea-level case.
How solar software handles air mass and the spectrum
pvlib and PVsyst document both air mass and spectral correction. SAM has air mass equations inside some models, HelioScope adjusts CdTe modules only, and PV*SOL’s page mentions neither. Ratings reflect the page read, not model quality.
| Software | Documents air mass or spectrum handling? | Page read |
|---|---|---|
| pvlib python | Yes | pvlib 0.16.1 docs, October 2026 |
| PVsyst | Yes | PVsyst help, two pages, no date shown, October 2026 |
| SAM | Partly | NREL/TP-6A20-64102, May 2015 (SAM 2015.1.30), so older than current SAM |
| HelioScope | Partly | HelioScope help, no date shown, October 2026 |
| PV*SOL premium | Not stated | PV*SOL help, irradiation page, no date shown, October 2026 |
Partly: the page covers air mass or the spectrum for only some models. Not stated: the page we read does not mention either. The notes below give each page’s detail.
- pvlib python: get_relative_airmass offers eight models, default kastenyoung1989. get_absolute_airmass multiplies by pressure ÷ 101325. get_reference_spectra returns ASTM G173-03. spectral_factor_firstsolar takes precipitable water and absolute air mass.
- PVsyst: The Spectral Correction page says the FirstSolar model takes air mass and precipitable water. It is "Disabled by default; user must enable it manually in ‘Detailed losses’". Amorphous and Sandia-database modules get an automatic correction when spectral correction is on.
- SAM: The 2015 technical reference says the sun position algorithm does not include an air mass equation. The Perez diffuse model has an absolute air mass equation, and the Sandia and CEC module models have their own.
- HelioScope: The Spectral Analysis page describes a "Spectral Adjustment" for CdTe modules based on precipitable water, calculated hourly. It does not mention air mass.
- PV*SOL premium: The irradiation calculation page lists seven steps, from sun position to ground reflection, with no mention of air mass or spectrum. Other PV*SOL pages are not covered here.
For more tools that run spectral and air mass corrections, see the best solar simulation software list. Library users can read our pvlib page.
Common mistakes with air mass
FAQs
Why are modules rated at AM1.5?
AM1.5 is the reference spectrum behind module ratings. NREL says ASTM G173-03 holds two terrestrial spectra, direct normal (AM1.5D) and total (AM1.5G), so ratings compare on one fixed light.
What do AM1.5G and AM1.5D mean?
AM1.5G is the global spectrum on a 37° tilted plane. AM1.5D is the direct normal spectrum. PVEducation calls AM1.5G the standard spectrum at the Earth’s surface.
What is AM0?
AM0 is sunlight outside the atmosphere. PVEducation quotes a solar constant of 1.353 kW/m². The G173 AM0 data totals 1,347.9 W/m², but it covers only 280 to 4,000 nm.
Does altitude change air mass?
Yes. Absolute air mass scales with pressure, so the same sun position gives a lower value at altitude. Standard-atmosphere pressure falls with height, so the sun must sit lower in the sky to reach the same absolute air mass. See Table 3.
Can air mass be below 1?
Absolute air mass can. With the sun overhead at 3,000 m it is about 0.69, because pressure there is 70,109 Pa against 101,325 Pa at sea level. Relative air mass is 1.0 overhead, and the Kasten-Young fit reads 0.9997.
Related terms
- Standard test conditions: the lab conditions, including AM1.5, behind a module’s rating.
- Solar irradiance: the power of sunlight per square metre.
- Solar zenith and incidence angle: the sun geometry that sets air mass.
Next step: check whether your yield tool corrects CdTe or amorphous modules for spectrum (PVsyst and HelioScope do, per the table above). Then compare options in the best solar simulation software list.
Sources
- ASTM, G173 standard page (scope text only, checked October 2026).
- NLR (formerly NREL), Reference Solar Spectral Irradiance: ASTM G173-03 (the old rredc subdomain now redirects, URL updated, checked November 2026).
- Sandia PVPMC, checked October 2026: Air Mass (metadata 6 February 2024), Spectral Mismatch Models (18 November 2022) and AM 1.5 Standard Spectrum (17 November 2022).
- PVEducation, Air Mass (no date shown). Checked October 2026.
- pvlib 0.16.1 documentation: get_relative_airmass, get_absolute_airmass, alt2pres, get_reference_spectra, spectral_factor_firstsolar and spectrl2. The Kasten-Young formula text comes from the pvlib package code.
- PVsyst help: Spectral Correction and FirstSolar Spectral Correction (no date shown). Checked October 2026.
- Gilman, SAM Photovoltaic Model Technical Reference, NREL/TP-6A20-64102, May 2015.
- HelioScope help, Spectral Analysis (no date shown). PV*SOL help, Irradiation (no date shown). Checked October 2026.
Last updated 30 October 2026. Next scheduled review: 30 January 2027.