Key takeaways
- Each curve is one date, usually the 21st (SunEye, PV*SOL, ESRU). At 36°N paired months such as February and October differ by at most 0.35° in noon elevation.
- Hour lines differ by tool. SunEye draws clock time and ignores daylight saving, while Solar Pathfinder uses solar time. The SunEye guide is from 2009.
- The tree hides the sun on 9 of the 12 monthly 21st lines, up to 133 minutes on 20 March against 37 in December. The house touches 3 lines, but only 21 December matters: 37 minutes, against 1 in January and 2 in November.
- At example 36°N the noon sun is 30.6° high on 21 December and 77.4° on 21 June. Sunrise moves from azimuth 119.4° to 60.6°.
- An obstruction’s elevation is arctan(height ÷ distance): 6 m at 14 m gives 23.2°. The sun is hidden where its curve dips below that shape.
To print or overlay sun paths in software, see the best solar shading analysis software.
Sun path diagram at a glance
A sun path diagram answers one question: where is the sun, on this date, at this hour? A skyline drawn on the same chart then shows when something is in the way.
| Item | Detail |
|---|---|
| Formula | Noon elevation = 90° − |latitude − declination|. Obstruction elevation = arctan(height ÷ distance). |
| Unit and range | Azimuth 0° to 360°. Elevation 0° to 90°. Our noon elevations: 30.6° to 77.4° at 36°N. |
| Where it matters | Shade checks on site, shade reports, horizon and tree surveys, row spacing. |
| Standard or rule | No single standard. The 21st of each month is a common choice, and each chart is made for one latitude. |
| In software | Handheld shade tools overlay it on a skyline. Design tools print it in a shade report. |
Why sun path diagrams matter for installers
They show when shade falls, not only how much. A tree that hides the March afternoon sun stands out at a glance. The chart pairs with the sun angle geometry, the azimuth conventions and the shading analysis that turns hidden hours into a percentage.
How do you read a sun path diagram?
Find the curve for your date, find the hour along it, and read the azimuth and elevation there.
- Find the axes. A Cartesian chart puts azimuth across and elevation up. A polar chart puts compass bearings round the edge. In the stereographic polar type (Figure 1 panel B), concentric circles show altitude and the horizon is the outer circle, as ESRU describes.
- Pick the date line. The December curve is lowest and the June curve highest in the northern hemisphere. Solar Pathfinder’s manual says its December arc is farthest from the centre and June closest, with seasons reversed in the southern hemisphere.
- Find the hour. Hour lines cross the date curves. Check whether they mean solar or clock time (see below).
- Read the position. The crossing gives azimuth and elevation. Ours: on 21 June at 10:00 solar time the sun is at 108° azimuth and 61° elevation.
- Compare with the skyline. Where the curve runs below an obstruction’s outline, the sun is hidden.
Table 1. Reading anchors for example 36°N (pvlib SPA, true elevation).
| Date (solar time) | Sunrise azimuth | Sunset azimuth | Highest elevation | Sun-up time |
|---|---|---|---|---|
| 21 December | 119.4° | 240.5° | 30.6° | 9.6 h |
| 20 March | 90.2° | 270.1° | 54.0° | 12.0 h |
| 21 June | 60.6° | 299.4° | 77.4° | 14.4 h |
Solar time and clock time differ, so check which one a chart uses.
| Time basis | What shifts it | Size of the shift | Tool example |
|---|---|---|---|
| Solar time | Longitude from the time-zone meridian | 4 minutes per degree | Solar Pathfinder: solar time equals standard time only at the centre of a time zone |
| Solar time | Equation of time | In 2026 it ran from -14.2 to +16.5 minutes | Solar Pathfinder hour lines |
| Clock time | Daylight saving | An hour | SunEye: hour lines are clock time without daylight saving |
The pvlib gallery page shows a Cartesian type as well as a polar one. Ladybug’s SunPath component offers orthographic and stereographic projections.
How do you use one to find shade?
Turn each obstruction into an azimuth span and an elevation angle. Draw it on the chart and mark where the sun curve passes behind it.
- Stand at the point of interest, such as the array corner.
- Note each obstruction’s left and right azimuth.
- Find its top elevation, by clinometer or as arctan(height ÷ distance).
- Draw the shape on the chart and mark where each date curve runs behind it.
- Read the hours from the hour lines.
Our two example obstructions are in Table 2. The house is flat-topped, the tree is opaque, and both are seen from one point.
Table 2. Example obstructions.
| Obstruction (example) | Height above the point | Distance | Elevation angle | Azimuth span |
|---|---|---|---|---|
| House | 6.0 m | 14.0 m | 23.2° | 140° to 200° |
| Tree | 12.0 m | 15.0 m | 38.7° | 235° to 260° |
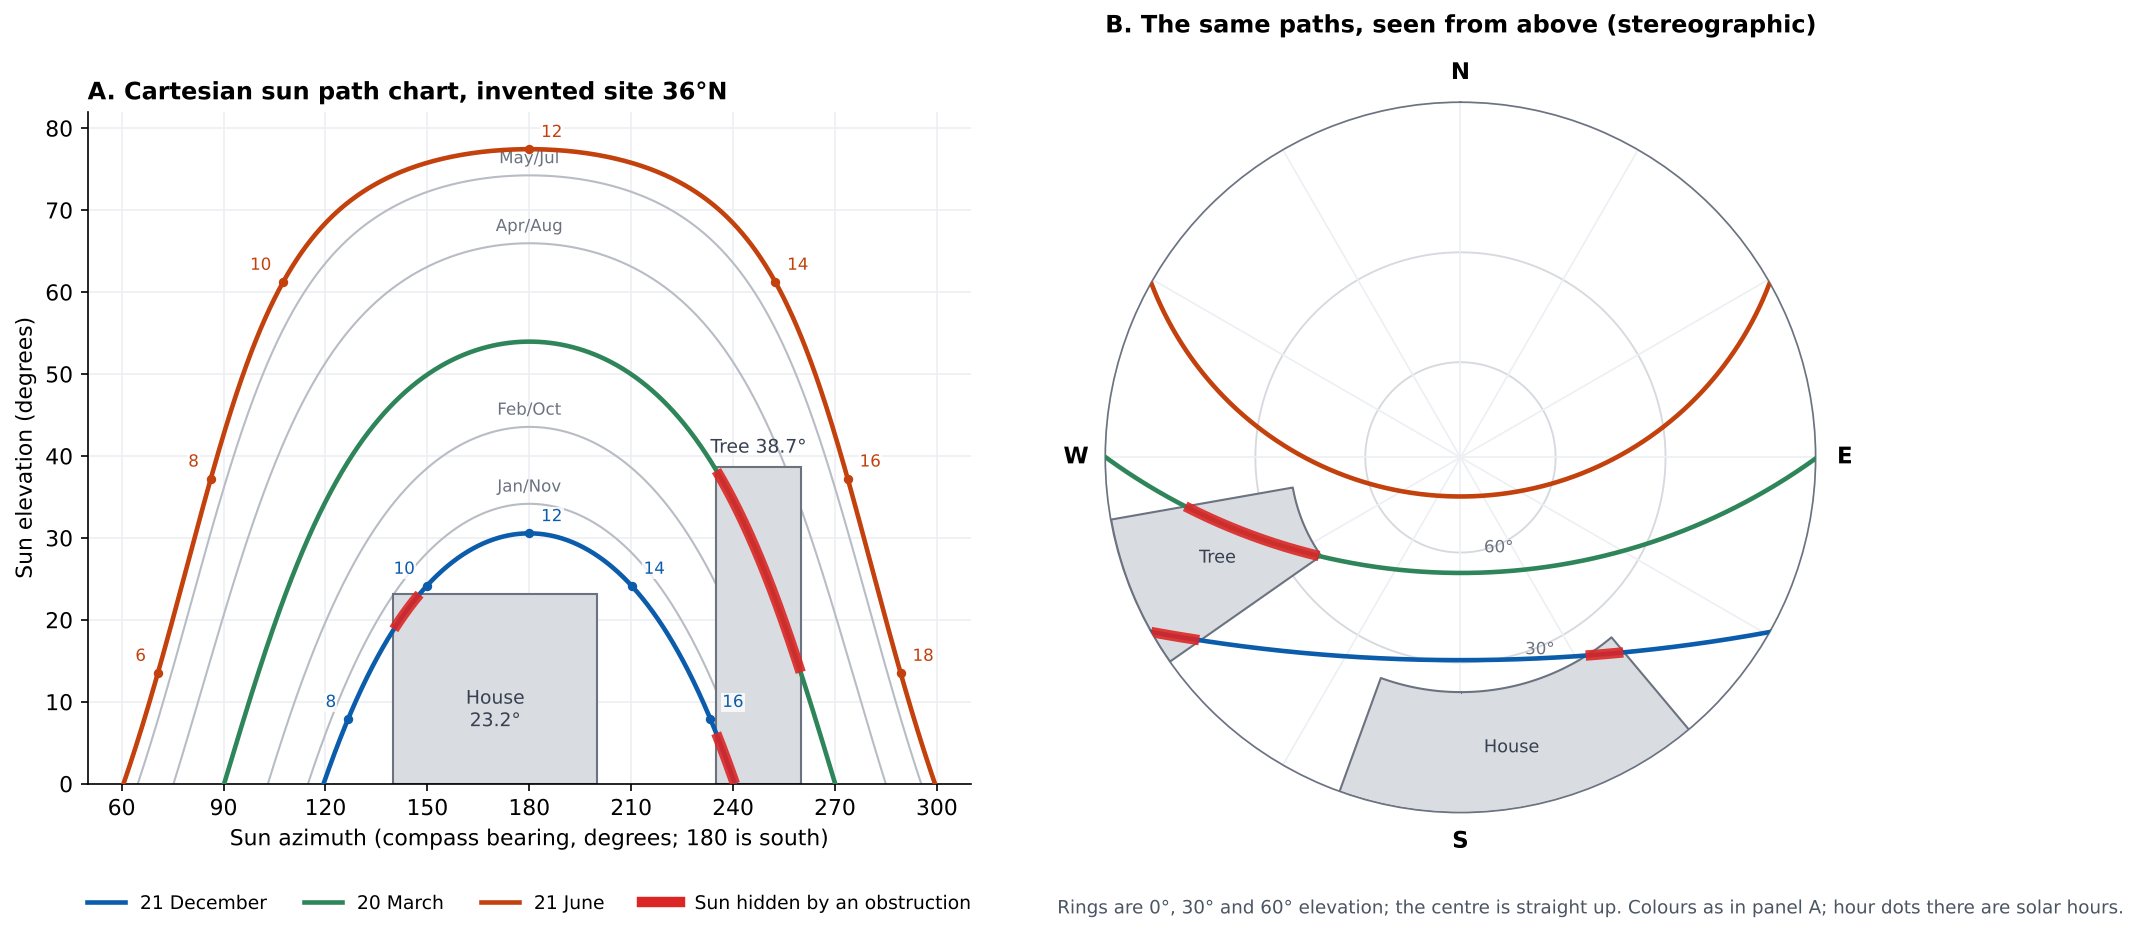
Figure 1. At example 36°N the house and tree hide the sun for 74 minutes on 21 December. The tree alone hides it for 133 minutes on 20 March.
The tree costs the most at the equinox, the house matters only in December, and June is clear.
Table 3. Hidden windows in solar time.
| Date | House hides the sun | Tree hides the sun | Hidden, both | Share of sun-up time |
|---|---|---|---|---|
| 21 December | 09:14 to 09:51 | 16:10 to 16:47 | 74 min | 12.9% |
| 20 March | none | 14:40 to 16:53 | 133 min | 18.5% |
| 21 June | none | none | 0 min | 0.0% |
The house only matters in winter, when the low December sun dips below its 23.2° top for a short spell. The tree stands in the south-west. The 21 December sun sets at azimuth 240.5°, before it crosses the tree’s full width, so the tree costs more at the equinox. Where an obstruction stands matters as much as its height.
On 21 December the hidden windows are 09:14 to 09:51 and 16:10 to 16:47. The point loses direct sun in those hours, and a shading analysis can check any modules there.
Height errors move the answer. Make the house 10% lower or higher (5.4 m or 6.6 m). Its hidden time on 21 December becomes 18 or 57 minutes, against 37.
Hidden minutes are not lost energy. Low sun carries little energy, and a chart does not show cloud. For percentages see solar access and TSRF. For distant hills see horizon profiles.
Calculator: when does an obstruction hide the sun?
Enter a latitude, a day, an obstruction and a time. The defaults are the example house in Table 2 on 21 December.
Day of year: 21 December is 355, 20 March is 79, 21 June is 172.
The calculator uses the Spencer declination series, so its minutes can differ slightly from Table 3.
How solar software handles sun path diagrams
Four of the six tools below document a sun path diagram outright, and PVsyst and PV*SOL only partly. Ratings reflect the page read, not model quality.
| Software | Documents a sun path diagram? | Best used for |
|---|---|---|
| Solmetric SunEye | Yes | Sunpaths over a captured skyline |
| Solar Pathfinder | Yes | Printed diagram with energy weights |
| OpenSolar | Yes | Printed in the Shade Report |
| pvlib python | Yes | Scripted plots from get_solarposition |
| PVsyst | Partly | Iso-shading diagram |
| PV*SOL premium | Partly | Sun position graph in the horizon editor |
Partly: the page mentions sun paths only inside another view or editor.
- Solmetric SunEye: The annual sunpath view draws the sunpaths over the captured skyline. Month lines are the 21st of each month. Hour lines are clock time and ignore daylight saving. Page read: SunEye User’s Guide version 2.8, revision 1/13/2009, October 2026. Current models may differ.
- Solar Pathfinder: The printed diagram has 12 monthly arcs and hour lines in solar time. Weights along each arc add to 100%, so a month’s site percentage is the sum of the unshaded half-hours. Diagrams are chosen by latitude band. Rated Yes for documenting the diagram. Our shading analysis page rates output figures separately. Page read: Instruction manual, copyright 2016, October 2026.
- OpenSolar: "The sun-path diagram is provided in our Shade Report." The article says azimuth and tilt can be read off the chart. Page read: OpenSolar support article, page stamp 21 October 2026.
- pvlib python: A gallery example builds sun path diagrams from get_solarposition, as a polar plot and as a Cartesian plot. Page read: pvlib 0.16.1 gallery page, no date shown, October 2026.
- PVsyst: The iso-shading diagram page says it shows lines of shading factors "superimposed on the sun paths". It does not describe a stand-alone sun path chart. Page read: PVsyst help, iso-shading diagram, no date shown, October 2026.
- PV*SOL premium: The administrator says the sun position graph is in the horizon editor and month lines are the 21st. The help Shading page shows the horizon in Cartesian coordinates and does not mention a sun path. Page read: Forum reply 16 April 2020 and help Shading page (footer 2026), October 2026.
Tools that check shade against a skyline are compared in the best solar shading analysis software. Design tools that print a shade report are in the best solar design software. For reports, see the shade report page.
Common mistakes with sun path diagrams
FAQs
Do I need a different diagram for each site?
Latitude sets the shape of the curves, so use one per latitude. ESRU says different latitudes need different charts, and Solar Pathfinder sells diagrams by latitude band. Longitude only shifts the hour lines between solar and clock time.
How do I get a sun path diagram for my site?
Use a tool that prints or plots one. OpenSolar prints it in its Shade Report. SunEye and Solar Pathfinder overlay it on a skyline, and pvlib can plot it from get_solarposition.
Is the sun path the same every year?
Yes, closely enough for planning. In our model at example 36°N the 21 June noon elevation moved by only 0.007° between 2026 and 2033, and 21 December by 0.005°.
Does it work in the southern hemisphere?
Yes, mirrored. At 36°S on 21 June the noon sun was 30.6° high at azimuth 0° (360°), due north. That is the 36°N December value.
Does a sun path diagram show how much energy is lost?
No. It shows when the sun is hidden. Solar Pathfinder prints energy weights on its arcs, and tools such as SunEye report solar access. See near and far shading for how models treat it.
Should I use a Cartesian or a polar (stereographic) chart?
Use the one your tool prints. Both hold the same data, as Figure 1 shows. Cartesian is easier for reading numbers, and the polar view shows the whole sky at once.
Related terms
- Solar zenith and incidence angle: the angles that place the sun.
- Azimuth: the compass direction and its zero in each tool.
- Horizon profile: distant terrain as one elevation per azimuth.
Next step: SunEye and Solar Pathfinder overlay a skyline, and OpenSolar prints the chart in its Shade Report. Compare them in the best solar shading analysis software.
Sources
- pvlib 0.16.1 documentation: Sun path diagram (gallery, no date shown). The declination_spencer71 and SPA values follow the pvlib docstrings.
- ESRU, University of Strathclyde: Sun charts (no date shown).
- Solar Pathfinder: Instruction Manual (copyright 2016) and Sunpath Diagrams (no date shown).
- Solmetric: SunEye User’s Guide, version 2.8, revision 1/13/2009.
- PVsyst help: Iso-shading diagram (no date shown).
- PV*SOL: help, Shading (footer 2026) and forum thread on sun position graphs (administrator reply 16 April 2020).
- OpenSolar: What is a Sun-path Diagram? (page stamp 21 October 2026).
- Ladybug Tools: SunPath component (no date shown).
Last updated 30 October 2026. Next scheduled review: 30 January 2027.