Key takeaways
- STC fixes three things: 1,000 W/m², a 25 °C cell (not 25 °C air) and an AM1.5 spectrum. Datasheet Wp and array kWp are STC figures.
- The Qcells Q.TRON BLK M-G2+ 425 W datasheet (Rev06, March 2025) prints 321.2 W at 800 W/m² and its NMOT. That is 75.6% of the STC rating.
- With an invented 900 W/m² and 35 °C air, one 425 W module gives 341.3 W (80.3% of STC). Thirty-two modules give 10.92 kW against 13.6 kWp.
- By the NMOT rule, a cell reaches 25 °C at 1,000 W/m² only in air near -3.8 °C. The NMOT range of 43 ± 3 °C moves that to -7.5 to 0 °C.
- The same sheet prints a +5 W / -0 W power tolerance and a ±3% measurement tolerance on Pmpp. On 13.6 kWp, ±3% is ±408 W.
To check live array output against the STC rating, see the best solar performance analytics software.
Standard test conditions at a glance
STC is a lab recipe, not a weather forecast. It rates every module under the same three conditions. So field output is almost never the same number.
| Item | Detail |
|---|---|
| Conditions | 1,000 W/m² irradiance, 25 °C cell temperature, AM1.5 spectrum. The Qcells sheet footnote reads "1000 W/m2, 25 ± 2 °C, AM 1.5 according to IEC 60904-3". |
| Unit / typical range | Watts at STC (W or Wp). Example: 425 W with a +5 W / -0 W power tolerance. No typical range. Each model prints its own. |
| Where it matters | Array kWp, DC/AC ratio, specific yield, performance ratio, datasheet comparison and field checks. |
| Standard or rule | IEC 60904-3 is the standard the Qcells sheet cites. The AM1.5 reference spectrum is ASTM G173-03, per the pvlib docs and an APsystems note. |
| In software | Tools keep the STC rating as array size. They then correct for cell temperature and irradiance inside the model. |
What do the three conditions mean?
Irradiance is the sunlight power on the module. Cell temperature is the temperature of the cells. AM1.5 describes how the sunlight is spread across wavelengths. The field rarely matches any of the three.
| Condition | STC value | What it means | Field reality |
|---|---|---|---|
| Irradiance | 1,000 W/m² | Light power on the module plane. See solar irradiance. | Changes minute by minute. Measure it with a pyranometer or reference cell. |
| Cell temperature | 25 °C (the Qcells footnote allows ± 2 °C) | The temperature of the cells, not of the air. See ambient and cell temperature. | Sunlit cells run above air temperature, so the field value is usually higher. |
| Spectrum | AM1.5 | Sunlight crossing 1.5 atmosphere thicknesses, with the sun at a 48.19° zenith angle (Penn State EME 810). The reference is ASTM G173-03, global, on a 37° tilted surface (pvlib docs). | Air mass changes with sun height, so the field spectrum is rarely this one. |
Sandia’s report SAND2011-4180C writes the same trio as standard reporting conditions (SRC). They are 1000 W/m², 25 °C and absolute air mass 1.5 (AMa 1.5). Sinovoltaics (4 November 2011) says they are rarely met in the real world.
Why do datasheets rate modules at STC?
One fixed test lets you compare one module’s watts with another’s. Seaward’s FAQ says a rating-plate value is not meaningful unless you know the test conditions.
Makers measure STC power with a flash test (APsystems). The Qcells sheet prints two separate tolerances. They do different jobs.
- Power tolerance +5 W / -0 W: the sheet’s heading calls the table "minimum performance" at STC. Read 425 W as a floor, with up to 5 W above it.
- Measurement tolerance: Pmpp ± 3% and Isc and Voc ± 5% at STC. That is the test’s uncertainty, not the module’s spread.
To check a module in the field, you must convert the reading back to STC. Seaward says that needs the irradiance and module temperature at that time. One trade article (EcoGeneration, via Solar Directory) says handheld tracers often correct for up to 400 W/m² and 10 °C. It adds that they do not usually correct for spectrum. See I-V curve tracing and the best solar commissioning software.
Why is field output lower than the STC rating?
Real cells are usually hotter than 25 °C. Real sunlight is usually below 1,000 W/m². Power falls in proportion to irradiance. It then falls again by the Pmax coefficient for each kelvin above 25 °C.
Datasheets add a second rating at NMOT (nominal module operating temperature). The Qcells sheet prints NMOT as 43 ± 3 °C. It also prints a table at 800 W/m². For the 425 W module that table gives 321.2 W. Dualsun’s FAQ, titled "NMOT ex NOCT", lists the NMOT test as 800 W/m², 20 °C air and 1 m/s wind, and EEPower lists the same values for NOCT. We use the NOCT cell-temperature rule for the NMOT point. The abstract of IEC 61215-2:2021 lists "Removal of the nominal module operating test (NMOT)" from that series, so confirm which standard your datasheet cites. See NOCT and NMOT.
PTC (PVUSA test conditions) uses 1,000 W/m², 20 °C air and 1 m/s wind, per EEPower and APsystems. It starts from air temperature, so it is a nearer field figure than STC. The California Energy Commission Solar Equipment List shows listed PTC ratings for US modules, though the list page does not define PTC. Treat the NOCT and PTC test values as secondary-source figures, since EEPower and APsystems are undated.
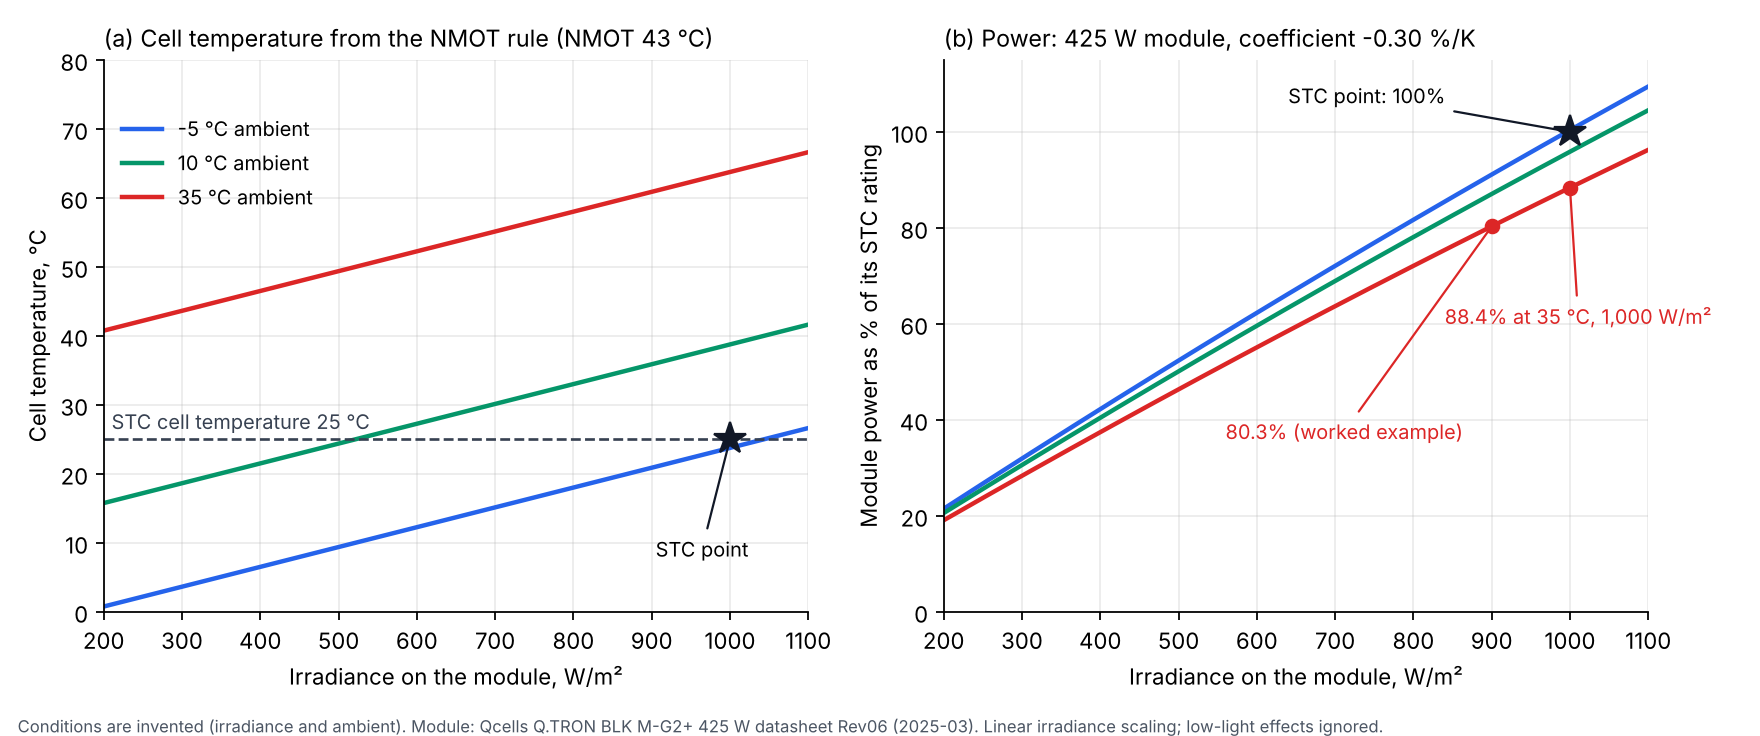
Figure 1. At 1,000 W/m², 35 °C air (example) gives 88.4% of the STC rating. Only air near -3.8 °C returns a cell to 25 °C.
Cold, bright conditions can reach the rating. At an example -5 °C and 1,000 W/m², the same model gives 100.4%.
Where does STC appear in sizing?
STC supplies the denominator of most sizing ratios. So array kWp is a rating, not an expected output. The table lists where it enters.
| Quantity | How STC enters | Page |
|---|---|---|
| Array DC size | Modules × Wp at STC. 32 × 425 W = 13.6 kWp. | Wattage, kW and kWp |
| DC/AC ratio | Array kWp divided by inverter kW. DC power in the field usually sits below the numerator. | DC/AC ratio |
| Specific yield, performance ratio | Specific yield is annual kWh divided by kWp at STC. Performance ratio divides that by sunlight in kWh/m². | Specific yield, performance ratio |
| Vmp, Imp, Voc, Isc | Printed at STC. Strings need hot and cold corrections. | Vmp and Imp, Voc and Isc |
| Simulation report | PVsyst’s nominal array power (Pnom) is the STC figure. | PVsyst report |
The power tolerance changes kWp slightly. Thirty-two modules at +5 W / -0 W are at least 13.60 kWp and at most 13.76 kWp. The ±3% measurement tolerance is ±12.75 W per module. That is ±408 W on the array if every module shared one bias.
How do you convert an STC rating to expected power?
Correct the rating for irradiance, then for cell temperature. Then multiply by the module count. The steps below give DC power at the array.
- Read the STC power (P), Pmax coefficient (γ) and NMOT from the exact datasheet print.
- Find the cell temperature: Tcell = Tair + (NMOT - 20) × G ÷ 800. The 20 °C reference follows the NOCT rule. The Qcells sheet does not print it, as on our Vmp and Imp page.
- Find module power: P × G ÷ 1,000 × (1 + γ × (Tcell - 25)), with γ as -0.0030 per K.
- Multiply by the number of modules. Wiring, mismatch, soiling and inverter losses come after. See system losses.
Datasheet values: 425 W, -0.30 %/K, NMOT 43 °C. The irradiances and air temperatures are example. Light scales in a straight line. Low-light and spectral effects are ignored. The table runs one module through six cases, from cold to hot.
| Case | Irradiance (W/m²) | Air (°C) | Cell (°C) |
|---|---|---|---|
| STC (lab) | 1,000 | none (lab test) | 25.0 |
| Cold bright (example) | 1,000 | -5 | 23.8 |
| Cool clear (example) | 1,000 | 10 | 38.8 |
| Hot clear (example) | 1,000 | 35 | 63.8 |
| Hot hazy (example) | 900 | 35 | 60.9 |
| NMOT point (datasheet condition) | 800 | 20 | 43.0 |
The same six cases, as module and array power, are in the next table.
| Case | Module (W) | Module (% of STC) | 32 modules (kW) |
|---|---|---|---|
| STC (lab) | 425.0 | 100.0% | 13.60 |
| Cold bright (example) | 426.6 | 100.4% | 13.65 |
| Cool clear (example) | 407.5 | 95.9% | 13.04 |
| Hot clear (example) | 375.6 | 88.4% | 12.02 |
| Hot hazy (example) | 341.3 | 80.3% | 10.92 |
| NMOT point (datasheet condition) | 321.6 | 75.7% | 10.29 |
In the hot hazy case, irradiance alone takes 10% off. Heat then takes a further 10.8% of what is left (a factor of 0.8924). The array is 2.68 kW under its 13.6 kWp rating before any other loss. Moving NMOT by ±3 °C changes that module’s power from 345.2 W to 337.5 W.
The NMOT row is a check. The model gives 321.6 W, which is 0.14% above the 321.2 W the sheet prints. It checks linear irradiance scaling and the coefficient at one point only. It does not test the cell-temperature rule, because the cell is set to 43 °C by definition at NMOT.
STC rating to hot-day power calculator
Enter your datasheet values and your own conditions. The defaults reproduce the hot hazy row, and three presets reproduce the table.
How solar software handles standard test conditions
Of the four tools below, only PVsyst documents STC by name in the pages we checked. These ratings test the documentation, not the quality of the model.
| Software | Documents STC or an STC-rated power? | Method |
|---|---|---|
| PVsyst | Yes | Modelled |
| pvlib python | Partly | Library you code against |
| HelioScope | Not stated | Modelled |
| PVWatts API v8 (NLR) | Not stated | Modelled |
Not stated: the company page we cite does not name STC. Partly: the page gives the formula and a 25.0 default but does not name STC. How each tool treats it:
- PVsyst: Defines Pnom as the array’s nominal installed power at STC, as the module maker specifies, in kWp. The reference yield Yr is the ideal yield from Pnom without losses. Source: PVsyst help, Normalised performance index, undated, checked October 2026.
- pvlib python: The pvwatts_dc page prints Pdc = Gpoa_eff ÷ 1000 × Pdc0 × (1 + γ × (Tcell - Tref)). It defaults temp_ref to 25.0. The page does not name STC. The get_reference_spectra page says the ASTM G173-03 standard "returns extraterrestrial, global and direct spectrum on a 37-degree tilted surface". Source: pvlib 0.16.1 docs (stable), checked 30 October 2026.
- HelioScope: The "HelioScope vs PVsyst" page says to set the "Diffusion Model" temperature model (the default is Sandia). It also says to check coefficients under "Edit model Coefficients". The page does not name STC. Source: HelioScope help centre, no date shown, checked October 2026.
- PVWatts API: The page does not name DC or STC. It describes system_capacity only as "Nameplate capacity (kW)". module_type 0, 1 and 2 are Standard, Premium and Thin film, with no coefficients listed. Source: PVWatts v8 API page, no date shown, checked October 2026.
For field comparison against STC, see the best solar performance analytics software list and the best solar O&M software list.
Common mistakes with standard test conditions
FAQs
What are standard test conditions?
STC are the lab conditions for rating a module: 1,000 W/m² irradiance, 25 °C cell temperature and an AM1.5 spectrum. They are not the Australian small-scale technology certificates, also called STCs (see STCs).
What is the difference between STC and NOCT?
STC fixes a 25 °C cell at 1,000 W/m². NOCT fixes 800 W/m², 20 °C air and 1 m/s wind. The cell temperature is whatever results (EEPower).
What is the difference between STC and PTC?
PTC keeps 1,000 W/m² but starts from 20 °C air with 1 m/s wind (EEPower, APsystems). EEPower says PTC and SOC (standard operating conditions, based on NOCT) peak figures come out lower than STC figures.
Why is my array not producing its rated kWp?
Rated kWp is an STC figure. Sunlight below 1,000 W/m² and hot cells both lower output. Look at irradiance and module temperature before treating a gap as a fault. Convert field readings to STC first, as the worked example shows in reverse.
Can a module produce more than its STC rating?
Yes. The sheet’s power tolerance allows up to 5 W above 425 W. A cold, bright day can also lift output above the rating. The model gives 100.4% at an example -5 °C and 1,000 W/m².
Related terms
- Wattage, kW and kWp: module watts and array kilowatts at STC.
- NOCT and NMOT: the operating-temperature rating and its test.
- Temperature coefficient: percentage change of a value per kelvin.
- Equipment datasheets: where the STC values and their print revisions live.
- Vmp and Imp: voltage and current at maximum power.
- DC/AC ratio: array kWp over inverter kW.
- Air mass and solar spectrum: how far sunlight travels through air and what light reaches the cell.
- Peak watt (Wp): module rated power at standard test conditions.
Next step: take one live array reading and convert it back to STC with the steps above. To size new jobs from STC ratings, use the best solar design software.
Sources
- Qcells Q.TRON BLK M-G2+ series datasheet, footer "Q.TRON_BLK_M-G2+_series_DCA_415-440_2025-03_Rev06_NA", distributor copy (checked October 2026).
- Sandia, SAND2011-4180C, Successful Transfer of Sandia’s Outdoor Test Technology to TUV Rheinland PTL (checked October 2026).
- Penn State EME 810, The Air Mass used in Engineering Testing (no date on the page, checked October 2026).
- pvlib 0.16.1, get_reference_spectra and pvwatts_dc (checked 30 October 2026).
- Seaward, What is STC and why is it significant (no date shown, footer 2026, checked October 2026).
- Sinovoltaics, Standard Test Conditions: definition and problems (4 November 2011, checked October 2026).
- Solar Directory, a deep dive into STC power measurements (EcoGeneration, no date shown, checked October 2026).
- EEPower, Understanding PV System Standards, Ratings, and Test Conditions (no date shown, checked October 2026).
- Dualsun FAQ, NMOT ex NOCT values (no date shown, checked 30 October 2026).
- IEC 61215-2:2021, abstract (iTeh catalogue) (checked 30 October 2026).
- APsystems, STC vs PTC (file name dated 18 September 2020, Rev 5, checked October 2026).
- Company pages (checked October 2026): PVsyst help, HelioScope vs PVsyst and PVWatts v8 API.
Last updated 30 October 2026. Next scheduled review: 30 January 2027.