Key takeaways
- Irradiance is power in W/m² at one moment. Irradiation is that power summed over time, in kWh/m², and peak sun hours equal kWh/m² per day.
- Our three typical-year files (Miami, Greensboro, Sand Point) give 1,793, 1,566 and 829 kWh/m² a year on a horizontal plane. That is 4.91, 4.29 and 2.27 peak sun hours a day.
- Peak sun hours are not daylight hours. Greensboro’s 4.29 peak sun hours fall inside about 12 hours of daylight a day, the time the sun is above the horizon.
- The plane matters. Panel-plane irradiation was 5.3%, 10.9% and 20.2% above horizontal, so yield sums that used horizontal values came out 5.0%, 9.9% and 16.8% too low.
- One kWh/m² is 86.04 langleys, using 41,840 J/m² per langley. Reading MJ/m² as kWh/m² overstates sunlight 3.6 times.
To get panel-plane irradiation for yield estimates, see the best solar simulation software.
Irradiation at a glance
Irradiation is the energy form of sunlight. Irradiance, the power form, has its own solar irradiance page. Datasets are in weather and solar resource data. The yield ratio is performance ratio.
| Item | Detail |
|---|---|
| Formula | Irradiation (kWh/m²) = sum of irradiance (W/m²) × hours ÷ 1,000. Peak sun hours = daily kWh/m² ÷ 1 kW/m². |
| Unit and range | kWh/m² per day, month or year. Our three typical-year files give 829 to 1,793 kWh/m² a year on a horizontal plane. |
| Where it matters | Yield estimates, the number you divide by in performance ratio, array sizing, site comparison. |
| Standard or rule | No single standard for the names. Sources use irradiation and insolation for the same energy, so read the unit. |
| In software | Weather and simulation tools report monthly and annual kWh/m², horizontal and in the panel plane. See the best solar simulation software. |
Why are the four terms confused, and how do they differ?
Irradiance is power per area at one moment, in W/m². Irradiation and insolation are the same energy per area over a period, in kWh/m². Peak sun hours restate daily irradiation as hours at 1,000 W/m². They have their own peak sun hours entry.
| Term | Quantity | Usual unit | Example |
|---|---|---|---|
| Irradiance | Power per area | W/m² | 750 W/m² at 12:15 |
| Irradiation | Energy per area | kWh/m² (or Wh/m²) | 4.6 kWh/m² today |
| Insolation | Same as irradiation | kWh/m² per day | 4.29 kWh/m² a day |
| Peak sun hours | Irradiation as equivalent hours | hours (per day) | 4.29 hours a day |
The irradiance and irradiation examples come from the WPO knowledge base. It calls irradiation the integral of irradiance. NREL’s 2024 slides define "insolation/irradiation" as the integral of irradiance over a period and say kWh/m² is sometimes called a "sun-hour". PVEducation defines insolation as the energy received in a stated period.
Solar Energy International describes peak sun hours as the width of a rectangle. The rectangle is 1,000 W/m² high and has the same area as the day’s irradiance curve. Vaisala says the value can swap with kWh/m²/day. Figure 1 shows that rectangle on a real day.
Labels are not always the same. Solargis lists its GHI entry with W/m², kWh/m² and Wh/m². Aurora’s help article calls an annual kWh/m² figure "irradiance". Read the unit, not the name.
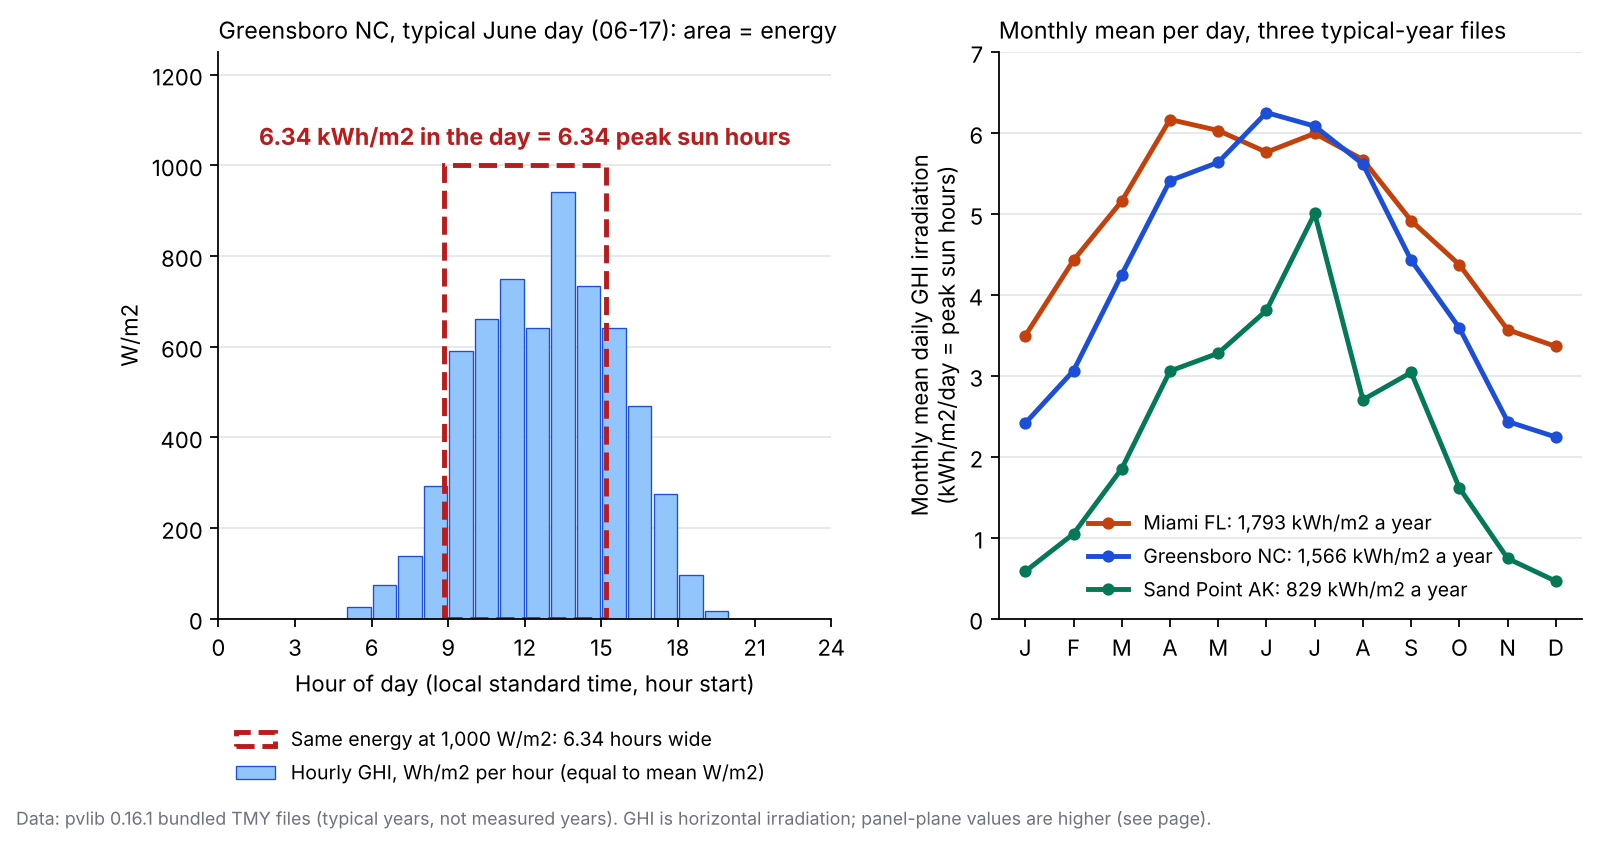
Figure 1. On a typical Greensboro June day, 6.34 kWh/m² of sunlight equals 6.34 hours at 1,000 W/m². Monthly means across the three sites range from 0.46 to 6.25 kWh/m² a day.
Which units are used, and how do they convert?
Solar design uses kWh/m². Weather data and older data may use MJ/m² and langleys. 1 kWh equals 3.6 MJ, and 1 langley is 41,840 J/m², so 1 kWh/m² is 86.04 langleys.
| Greensboro, NC, horizontal (GHI), typical year | Value |
|---|---|
| kWh/m² per year | 1,566.2 |
| Wh/m² per year | 1,566,203 |
| MJ/m² per year | 5,638 |
| Langleys per year | 134,759 |
| kWh/m² per day (÷ 365) | 4.29 |
| Peak sun hours per day | 4.29 |
The 3.6 factor follows from 1 W being 1 J/s. The langley value is from Wikipedia, which gives 41,840 J/m² (one thermochemical calorie per cm²). PVEducation notes insolation may be quoted in MJ/m² per year. HOMER’s help shows how to enter data held in Wh/m² instead of kWh/m², a factor of 1,000.
How do you convert hourly irradiance to daily, monthly and annual irradiation?
Multiply each irradiance by the hours it lasted, then add them up. Divide watt-hours by 1,000 to get kWh/m². The worked example follows these steps.
- Take hourly values. In the files used, each GHI value is the Wh/m² from the 60 minutes before its timestamp, per pvlib’s file-reader documentation. That equals the hour’s mean W/m².
- If you have W/m² readings instead, multiply each by its duration. 500 W/m² for half an hour is 250 Wh/m².
- Add up the values in each day and divide by 1,000. You get kWh/m² per day.
- Add up the days for each month and for the year. Divide a month by its days for a mean per day. The example uses 365 days.
- Divide daily kWh/m² by 1 kW/m² to get peak sun hours. The number stays the same.
- For yield, use irradiation in the panel plane, not the horizontal value.
Worked example: three sites, one method
The typical-year weather files in pvlib 0.16.1 supply Miami FL (TMY2 format), Greensboro NC and Sand Point AK (TMY3). These are typical years, not measured years. See TMY.
The first table gives horizontal sunlight at each site. The second shows how much the panel plane adds.
| Site | Annual GHI (kWh/m²) | Mean per day (= peak sun hours) | Best month, per day | Worst month, per day |
|---|---|---|---|---|
| Miami FL | 1,792.6 | 4.91 | Apr 6.16 | Dec 3.36 |
| Greensboro NC | 1,566.2 | 4.29 | Jun 6.25 | Dec 2.24 |
| Sand Point AK | 829.2 | 2.27 | Jul 5.00 | Dec 0.46 |
| Site | Annual panel-plane (kWh/m²) | Ratio to GHI |
|---|---|---|
| Miami FL | 1,886.8 | 1.053 |
| Greensboro NC | 1,737.7 | 1.109 |
| Sand Point AK | 996.9 | 1.202 |
Panel-plane values assume a fixed south-facing plane. Tilt is the latitude rounded to whole degrees (26°, 36° and 55°). Albedo is 0.20. The model is Hay-Davies in pvlib, with solar position at mid-hour. Monthly sums matched the annual sum. The peak-sun-hour series matched the daily kWh/m² series to rounding error, as it must by definition. The sun is up about 12 hours a day on average at all three sites (pvlib solar position).
Next, a cross-check for a 6.0 kW DC array at each site. The simple line is kW × panel-plane kWh/m² × PR, with PR assumed to be 0.80. The chain uses pvlib’s PVWatts-style DC model. It adds the SAPM open-rack glass-glass cell-temperature model, -0.35%/K, 7% other losses, 96% inverter efficiency and DC/AC 1.2. All are our assumptions.
| Site | Simple yield, kWh a year (kWh/kW) | Same sum with GHI |
|---|---|---|
| Miami FL | 9,057 (1,509) | 8,605 (-5.0%) |
| Greensboro NC | 8,341 (1,390) | 7,518 (-9.9%) |
| Sand Point AK | 4,785 (798) | 3,980 (-16.8%) |
Chain results and gaps:
| Site | pvlib chain, kWh (implied PR) | Simple vs chain |
|---|---|---|
| Miami FL | 9,454 (0.835) | -4.2% |
| Greensboro NC | 8,870 (0.851) | -6.0% |
| Sand Point AK | 5,373 (0.898) | -10.9% |
The simple yield line sits below the chain at every site. For a 6 kW array in Greensboro, the simple line gives 8,341 kWh a year and the chain 8,870 kWh. The gap is the assumed PR of 0.80 against the chain’s implied 0.835 to 0.898. Both use the same weather. The chain has no snow, shading or soiling beyond the flat 7%, so its Alaska figure is high. The assumed PR matters most. Use 0.75 or 0.85 instead of 0.80 and the simple yield moves by 6.25% either way.
Calculator: unit converter and yield check
Enter an irradiation in any unit, per day or per year. You see the other units and the peak sun hours. The example buttons repeat the tables above.
Not showing? Open the irradiation unit converter on its own page.
How solar software handles irradiation
PVGIS and HOMER Pro report irradiation in kWh/m², each with a unit caveat in the table. The other three of the five tools checked do so partly, and Aurora labels an annual kWh/m² figure "irradiance". The rows use pages read in October 2026.
| Software | Reports irradiation? | How / where | Notes |
|---|---|---|---|
| PVGIS | Yes | Output lists daily and monthly plane-of-array irradiation: H(i)_d in kWh/m²/d and H(i)_m in kWh/m²/mo. | JRC grid-connected PV page, undated. The page gives no unit for the yearly value. |
| HOMER Pro | Yes | Shows monthly average radiation. Baseline data is in kWh/m² per time step. Monthly entry is kWh/m² per day. | HOMER Pro 3.16 help, undated. The same page also says kW/m² for imported files, so check the unit. |
| Aurora Solar | Partly | Help reports "irradiance" as annual kWh/m². | Updated 24 August 2026 per the page. |
| PVsyst | Partly | Glossary defines the transposition factor as incident irradiation (GlobInc) over horizontal irradiation (GlobHor). | Page read shows no units or date. |
| Solargis Prospect | Partly | Solargis glossary lists irradiation variables in W/m², kWh/m² and Wh/m². | Glossary updated 24 March 2026. It does not say what Prospect itself exports. |
Partly: the page mentions the value but does not present it as a plain irradiation output.
For tools that track measured output against modelled yield, see the best solar performance analytics software list.
Common mistakes with irradiation
FAQs
Is irradiation the same as insolation?
In practice, yes. Both mean solar energy per unit area over a period, usually kWh/m². Some texts use "irradiance" for power only. Always check the unit printed with the number.
Is one peak sun hour the same as 1 kWh/m² a day?
Yes. A peak sun hour is one hour at 1,000 W/m², which is 1 kWh/m². In our three files the two daily series matched to rounding error, as the definition makes them the same.
How do I convert MJ/m² or langleys to kWh/m²?
Divide MJ/m² by 3.6. Multiply langleys by 0.011622. For example, 5,638 MJ/m² is 1,566 kWh/m². The converter above does both directions.
Should I size an array with GHI or panel-plane irradiation?
Use panel-plane irradiation, since that is what the modules receive. With a latitude tilt facing south, horizontal values made our yield sums 5.0% to 16.8% too low. On a flat roof the two are close.
Related terms
- Solar irradiance: sunlight power in W/m², and its GHI, DNI and DHI parts.
- Peak sun hours: daily irradiation as hours at 1,000 W/m².
- Specific yield: annual kWh per kW of array.
Next step: get panel-plane yield for your own site from the best solar simulation software. PVGIS and HOMER Pro print kWh/m² most directly. Then compare it with measured output using the best solar performance analytics software.
Sources
- WPO, irradiation vs irradiance (copyright 2025, checked October 2026).
- NREL, Technology Tips for Solar + Storage REAP Application Reviews (17 July 2024, link moved to the nlr.gov domain after the lab’s 2025 rename, re-verified November 2026).
- PVEducation, Measurement of Solar Radiation (undated, checked October 2026).
- Solar Energy International, Quantifying Sunlight for PV System Design (31 March 2026, checked October 2026).
- Vaisala, units of solar irradiance (undated, checked October 2026).
- Solargis, solar resource terms (updated 24 March 2026, checked October 2026).
- Wikipedia, Langley (unit) (checked October 2026).
- JRC, PVGIS grid-connected PV (undated, checked October 2026).
- HOMER Pro 3.16, solar GHI resource (undated, checked October 2026).
- Aurora Solar, key terms (updated 24 August 2026, checked October 2026).
- PVsyst, transposition factor (undated, checked October 2026).
Data: bundled weather files from pvlib, with fixed model code. Last updated 30 October 2026. Next scheduled review: 30 January 2027.