Key takeaways
- PSH is daily irradiation divided by 1 kW/m².
- In our typical-year file, the 30° plane gets 3.38 PSH in January and 5.80 in June. Hours with any sunlight (10.7 and 15.0) are not the same thing.
- The sizing shortcut is kWh/day = kWp × PSH × system factor. Invented inputs of 25 kWh/day, 4.2 PSH and 0.78 give 7.63 kWp, or 20 modules of 400 W.
- The plane changes the number. In one file, yearly PSH was 4.29 flat, 4.78 at 30° and 3.02 on a vertical wall.
- One yearly PSH hides the seasons. Against an hourly model it overstated January by 33% and understated June by 15%, while monthly PSH stayed within -6% to +3.3%.
To look up and convert PSH without a full model, see the best free solar calculators for installers.
Peak sun hours at a glance
PSH turns a day of changing sunlight into one easy number. It is the hours of full sun that would give the same energy. It is the same quantity as daily irradiation, with a different unit name.
| Item | Detail |
|---|---|
| Formula | PSH (hours a day) = daily irradiation (kWh/m² a day) ÷ 1 kW/m². |
| Unit and range | Hours a day, numerically equal to kWh/m² a day. The value depends on site, month and plane. Our flat-plane yearly means run from 2.27 to 4.91, so look it up for your plane. |
| Where it matters | Quick array sizing, off-grid design, sense checks on a proposal, comparing sites. |
| Standard or rule | We found no standard that defines the term "peak sun hours". Sandia PVPMC defines reference yield, used in an IEC 61724-based performance ratio, as plane-of-array insolation divided by 1,000 W/m² (see our performance ratio page). We did not read the IEC text. 1,000 W/m² is the reference level. Solar Energy International calls it "the established standard for peak sun". |
| In software | Tools print daily irradiation in kWh/m²/day, not the words "peak sun hours". |
PVEducation says the average daily insolation in kWh/m² per day "is sometimes referred to as peak sun hours". It adds that the number of peak sun hours is "numerically identical" to it. The power form is solar irradiance. GHI is its horizontal total.
Why peak sun hours matter for installers
PSH is the fastest route from a customer’s daily kWh to an array size. A wrong PSH, or one for the wrong plane, shifts every kWp and kWh in a quote by the same percentage.
It also lets a salesperson sanity-check a software result in seconds. If the shortcut and a simulation disagree by more than a few percent, an input differs: the plane, the weather file or the losses. The shortcut cannot replace an energy yield simulation, as the comparison below shows.
Why are peak sun hours not hours of daylight?
Daylight hours count time. PSH counts energy. Sunlight is weak near dawn and dusk, so a long day can hold few peak sun hours.
In the pvlib Greensboro NC typical-year file, January averaged 10.7 hours a day with any sunlight but only 3.38 PSH on a 30° south-facing plane. June averaged 15.0 hours and 5.80 PSH. Hour-ending rows count part hours at dawn and dusk, so June’s 15.0 overstates real daylight.
Plane irradiance reached 1,000 W/m² or more in only 49 hours of the year, with a peak of 1,091 W/m². Yet the year adds up to about 1,744 equivalent hours (kWh/m²) on the 30° plane (1,566 on the flat plane). The hours are an energy equivalent, not time spent at 1,000 W/m². This is a typical-year file, not a measured year.
How do you size an array with peak sun hours?
Divide the daily energy target by PSH and by a system factor. The system factor stands for all losses between sunlight and the energy you count. See derate factor and performance ratio.
- Pick the daily energy to supply, in kWh/day.
- Find PSH for your tilt and direction, for the month you design for. Use a yearly mean only for a yearly average.
- Choose a system factor, a fraction of 1. State where it came from.
- Array kWp = target ÷ (PSH × factor).
- Round up to whole modules, rated at STC watts. See kW and kWp.
- Check against an hourly model before you quote.
The reverse is also useful. Yearly kWh per kWp equals PSH × 365 × system factor. See specific yield.
Worked example: sizing with example numbers
All inputs are example. The target is 25 kWh/day. PSH is 4.2 on the array plane, as a yearly mean. The system factor is 0.78 and modules are 400 W.
| Step | Calculation | Result |
|---|---|---|
| PSH × factor | 4.2 × 0.78 | 3.276 kWh/kWp/day |
| Array needed | 25 ÷ 3.276 | 7.63 kWp |
| Modules, rounded up | 7.63 kWp ÷ 0.4 kW | 20 modules, 8.0 kWp |
| Energy from rounded array | 8.0 × 3.276 | 26.2 kWh/day |
| Yearly, at the yearly PSH | 8.0 × 3.276 × 365 | 9,566 kWh |
The result is an average day. It says nothing about January or June.
What does an hourly model change?
An hourly model adds each hour’s sun position, plane irradiance and cell temperature. It shows how the shortcut’s one number spreads across the year. See 8,760-hour simulation.
The same 8.0 kWp array was run through pvlib 0.16.1 on the Greensboro NC typical-year file. Tilt is 30°, facing south. Assumptions are ours: a -0.35%/K power coefficient and 7% other losses (our performance ratio page assumes 7% too). The inverter is 96% efficient and DC/AC is 1.2, with no angle-of-incidence loss. The shortcut here uses the model’s own yearly factor, 0.85, instead of the example 0.78 of the sizing example. The yearly totals therefore match by design, so the test is the seasons. Yearly PSH on the plane is 4.78.
The yearly shortcut is too high in winter and too low in summer, while the monthly shortcut stays close.
| Month (PSH, 30° plane) | Hourly model, kWh/day | Shortcut, yearly PSH (error) | Shortcut, monthly PSH (error) | Factor the model implies |
|---|---|---|---|---|
| January (3.38) | 24.5 | 32.5 (+33%) | 23.0 (-6.3%) | 0.907 |
| April (5.65) | 38.4 | 32.5 (-15%) | 38.4 (+0.1%) | 0.849 |
| June (5.80) | 38.4 | 32.5 (-15%) | 39.4 (+2.6%) | 0.828 |
| July (5.72) | 37.7 | 32.5 (-14%) | 38.9 (+3.3%) | 0.823 |
| November (3.48) | 24.2 | 32.5 (+34%) | 23.7 (-2.4%) | 0.870 |
| Year, kWh (4.78 mean) | 11,867 | 11,862 (0.0%) | Not used | 0.850 |
Errors are shortcut against the hourly model. Positive means the shortcut is too high.
- Seasons: the yearly PSH matched the year (0.0% apart). It was 33% high in January and 15% low in June.
- Temperature: the implied factor ran from 0.823 in July to 0.907 in January, because hot cells lose power. A flat factor cannot show this. Our yearly factor is 0.850. See temperature coefficient.
- Clipping: at DC/AC 1.2 the model lost 0.39% of the year’s energy to the inverter limit. The shortcut has no inverter. See inverter clipping.
PSH does not tell you the factor. Here we took it from the model. In design you must choose it. Shading and soiling also sit outside PSH. See shading analysis.
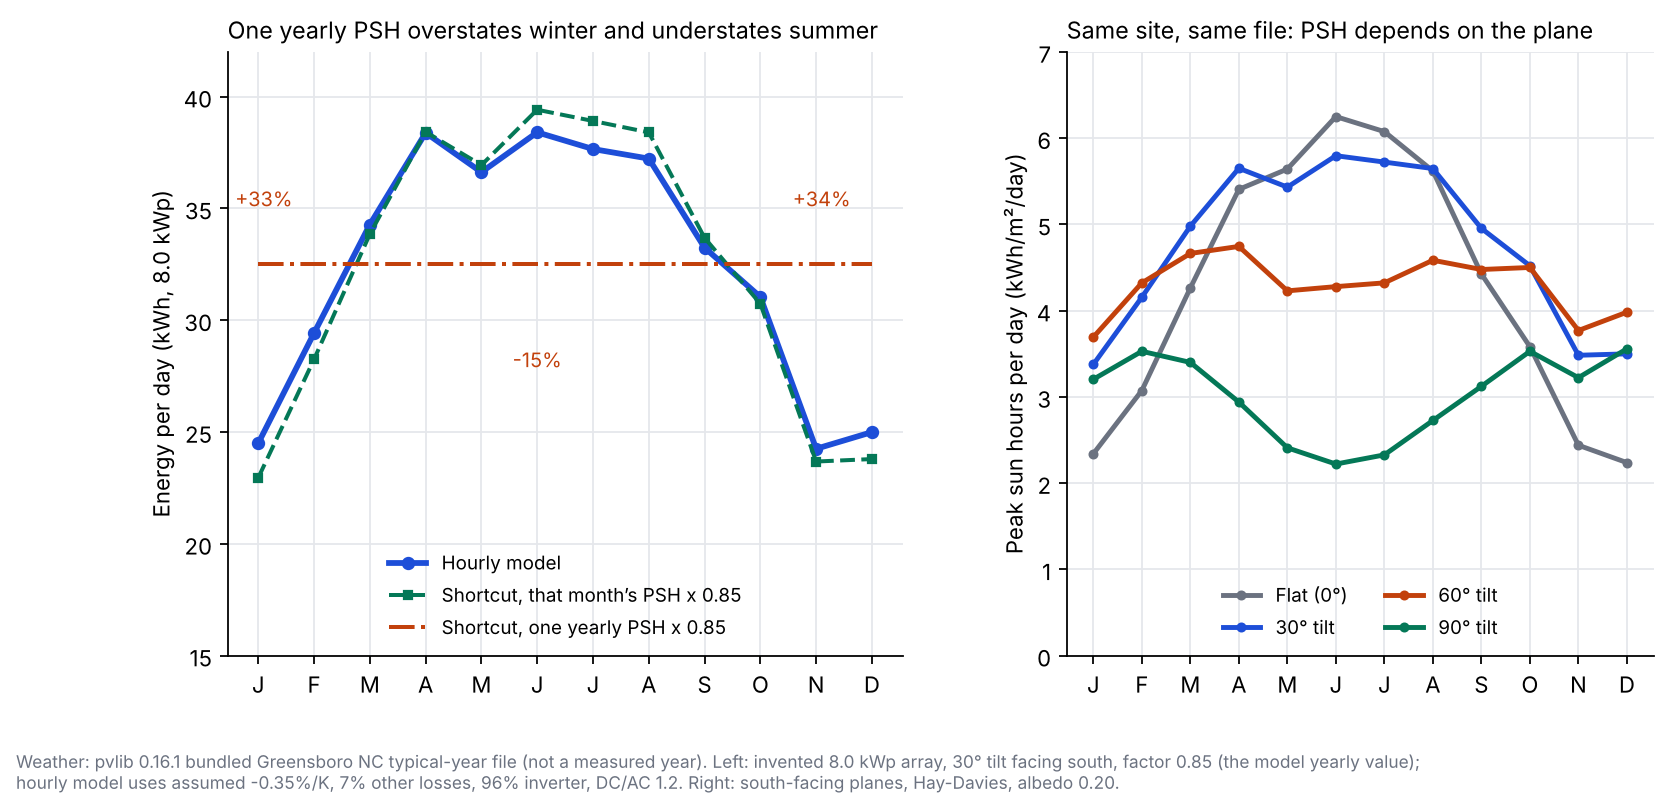
Figure 1. A single yearly PSH overstates winter by about a third and understates summer by about a sixth, while monthly PSH tracks the hourly model within -6% to +3.3% (example array, typical-year file). The same site’s PSH changes with tilt.
How does tilt change peak sun hours?
PSH belongs to a plane, not a site. A flat plane, a 30° plane and a wall at one place give different values. The best tilt for the year is not the best for winter. See tilt angle and azimuth.
| South-facing plane | Yearly mean PSH | January PSH | June PSH |
|---|---|---|---|
| Flat (0°) | 4.29 | 2.34 | 6.25 |
| 15° | 4.65 | 2.93 | 6.18 |
| 30° | 4.78 | 3.38 | 5.80 |
| 45° | 4.66 | 3.63 | 5.15 |
| 60° | 4.31 | 3.69 | 4.28 |
| 90° (vertical) | 3.02 | 3.20 | 2.22 |
Same Greensboro NC typical-year file, Hay-Davies transposition, albedo 0.20. Flat equals the file’s GHI mean of 4.29. Moving from flat to 30° adds 0.49 yearly PSH but lifts January by 1.04. For this example’s 25 kWh/day target and 0.78 factor, the flat value gives 7.47 kWp. Sized on the flat value, the array is 11% larger than sized on the 30° value (7.47 against 6.71 kWp). See plane-of-array sunlight.
Off-grid, size on the worst month. For an example 5 kWh/day load at a 0.78 factor, January (3.38 PSH) needs 1.90 kWp. The yearly mean needs 1.34 kWp, so January needs 1.42 times more. See off-grid system design for batteries.
Peak sun hours calculator
Step 1 converts irradiation in kWh/m², Wh/m² or MJ/m² to PSH. Step 2 applies the sizing shortcut. The presets reproduce the worked example and the off-grid case above. All default numbers are example or from our typical-year file.
How solar software handles peak sun hours
Of the three tools read, only PVGIS lists the plane-of-array value fully, and none prints the phrase "peak sun hours". PVWatts and Global Solar Atlas do so only partly.
| Tool | Prints daily irradiation in kWh/m²/day? | Page read (October 2026) |
|---|---|---|
| PVGIS | Yes | JRC PVGIS grid-connected PV page, no date shown |
| PVWatts (NLR, formerly NREL) | Partly | NLR developer page for PVWatts v8 (NLR was NREL), no date shown. The archive copy of v5 (URL stamp 24 December 2016) words solrad the same way |
| Global Solar Atlas | Partly | World Bank data catalogue copies of the layers (GTI page created 7 July 2023, PVOUT page undated), not the Atlas site |
- PVGIS: the grid-connected PV output lists "H(i)_d [kWh/m2/d] - Daily global irradiation on the plane-of-array" and the monthly H(i)_m. Yearly values are "the same quantities averaged over the whole year". System losses are an input. It prints no unit for the yearly figure.
- PVWatts: the version 8 API returns solrad_monthly and solrad_annual in kWh/m2/day, plus poa_monthly in kWh/m2. The page does not say which plane solrad uses. Losses are a required input, -5 to 99 percent.
- Global Solar Atlas: data layers include GTI for optimally tilted surfaces "in kWh/m²", labelled as average daily totals, with yearly equal to daily × 365.25. PVOUT is "in kWh/kWp".
Not stated: the company page we cite does not say. Partly: the page gives the figure but leaves out the plane or the period.
The yearly-to-daily factor differs by source: the Atlas copy uses 365.25 and our page uses 365. For free lookups and quick sizing, see the best free solar calculators for installers. For worst-month sizing, see the best off-grid solar design software.
Common mistakes with peak sun hours
FAQs
Is one peak sun hour the same as 1 kWh/m²?
Yes. One hour at 1,000 W/m² delivers 1 kWh on each square metre. PVEducation says the number of peak sun hours is numerically identical to the average daily insolation in kWh/m² per day.
How do I find the peak sun hours for a site?
Take daily irradiation in kWh/m² for your tilt and direction, for the month you design for. PVGIS prints it as H(i)_d. PVWatts returns monthly plane-of-array totals in kWh/m², so divide by the days. Name the source and weather period. Our irradiation page lists flat-plane yearly means from typical-year files: 4.91 (Miami), 4.29 (Greensboro) and 2.27 (Sand Point).
Why is PSH not the same as hours of daylight?
PSH is energy stated as time at full power. In our hourly file, January had 10.7 hours with any sunlight a day but 3.38 PSH on a 30° plane.
Which PSH should I use for an off-grid system?
Use the lowest month for your plane, because off-grid loads run all year. In the page’s example case, the worst month needs more array than the yearly mean does. Size batteries separately. See the off-grid system design page.
Does PSH include temperature, shading or inverter losses?
No. PSH is sunlight only. Temperature, shading, soiling and inverter limits sit in the system factor or in an hourly model. In the worked comparison, the implied factor moved with the season because hot cells lose power.
Related terms
- Irradiation and insolation: the energy form of sunlight in kWh/m².
- Specific yield: yearly kWh per kWp, equal to PSH × 365 × system factor.
- Weather and solar resource data: where the irradiation behind PSH comes from.
Next step: test a PSH shortcut against an hourly model with the best solar simulation software. For a free look-up, use the best free solar calculators for installers.
Sources
- PVEducation, Average Solar Radiation (no date on the page, checked October 2026).
- Solar Energy International, Quantifying Sunlight for PV System Design (no date in the text read, checked October 2026).
- Sandia PVPMC, Irradiance and Insolation (page updated 9 November 2022, checked October 2026).
- Sandia PVPMC, Performance Ratio (reference yield definition, checked 30 October 2026).
- European Commission JRC, PVGIS grid-connected PV (no date shown, checked October 2026).
- NLR developer network (formerly NREL), PVWatts v8 and the 2016 web archive of the v5 page (no dates shown, checked October 2026).
- Global Solar Atlas GTI layer, World Bank data catalogue copy (created 7 July 2023) and PVOUT layer page (undated, checked October 2026).
- Weather: pvlib 0.16.1 bundled Greensboro NC typical-year file (723170TYA.CSV). All design numbers are example.
Last updated 30 October 2026. Next scheduled review: 30 January 2027.