Key takeaways
- Specific yield = annual AC kWh ÷ array kWp at STC. It also equals performance ratio × array-plane sunlight in kWh/m².
- In our invented example, a performance ratio of 0.80 gives 880, 1,280 and 1,760 kWh/kWp at 1,100, 1,600 and 2,200 kWh/m². Sunlight, not design, drives the gap.
- DC capacity factor = specific yield ÷ 8,760. NREL’s ATB page says AC capacity factor = DC capacity factor × DC/AC ratio.
- In an example plant, a bigger array on one inverter cuts specific yield 3.0%. It lifts AC capacity factor from 15.5% to 19.6%. The 3% clipping loss is example.
- Two yields compare fairly only if four things match. These are the weather file, period, energy boundary and kWp basis.
To find tools that report kWh/kWp, see the best solar simulation software, or try the calculator below.
Specific yield at a glance
Specific yield is energy per kilowatt-peak of modules. Read each figure together with its basis, such as AC or DC energy and the period.
| Item | Detail |
|---|---|
| Formula | Specific yield = annual energy (kWh) ÷ array DC rating at STC (kWp). SAM’s energy yield uses year-one AC energy. Sandia says "kilowatt hours produced". |
| Unit / typical range | kWh/kWp a year. It changes with site and design. The FAQ gives one published range. |
| Where it matters | Comparing sites and designs, checking simulations against meter data, and quick sense checks on proposals. |
| Standard or rule | No standard defines specific yield itself. IEC 61724 defines PR as Yf ÷ Yr (Sandia PVPMC, PVsyst). |
| In software | Simulation tools print it in results. Monitoring tools report measured values. |
Sources differ a little. SAM names AC energy and year-one output. Sandia and PVsyst say energy produced per kWp. When you quote a figure, say which boundary you use.
Why specific yield matters for installers
It is the fastest sense check on a proposal. A quoted figure far from local systems like it usually means a wrong input or a different basis.
It also lets you compare a 6 kWp roof with a 600 kWp roof. You can compare two roof faces on one house too. In a design review, ask for it next to the full PVsyst report or an energy yield simulation. For the uncertainty on the same figure, see P50, P90 and P99.
How to calculate specific yield, and convert it
Divide a year of AC energy by the array’s kWp. One more step gives capacity factor or performance ratio.
- Take annual AC energy in kWh. Get it from a simulation, the meter or the inverter. Use one full year.
- Add up the module ratings at STC to get kWp. See kW and kWp.
- Specific yield = kWh ÷ kWp.
- DC capacity factor = specific yield ÷ 8,760 hours (8,784 in a leap year). SAM’s formula divides annual AC energy by capacity times 8,760.
- AC capacity factor = annual kWh ÷ (inverter AC kW × 8,760). NREL’s ATB page says to multiply or divide by the inverter loading ratio to switch between the two.
- Performance ratio = specific yield ÷ plane-of-array sunlight in kWh/m². IEC 61724 defines PR as Yf ÷ Yr (Sandia PVPMC). PVsyst uses the same form. Its tutorial says Yr equals GlobInc, so the 1 kW/m² reference drops out.
PVsyst gives its yields in kWh/kWp per day. Multiply by the days in the period for a monthly or yearly figure.
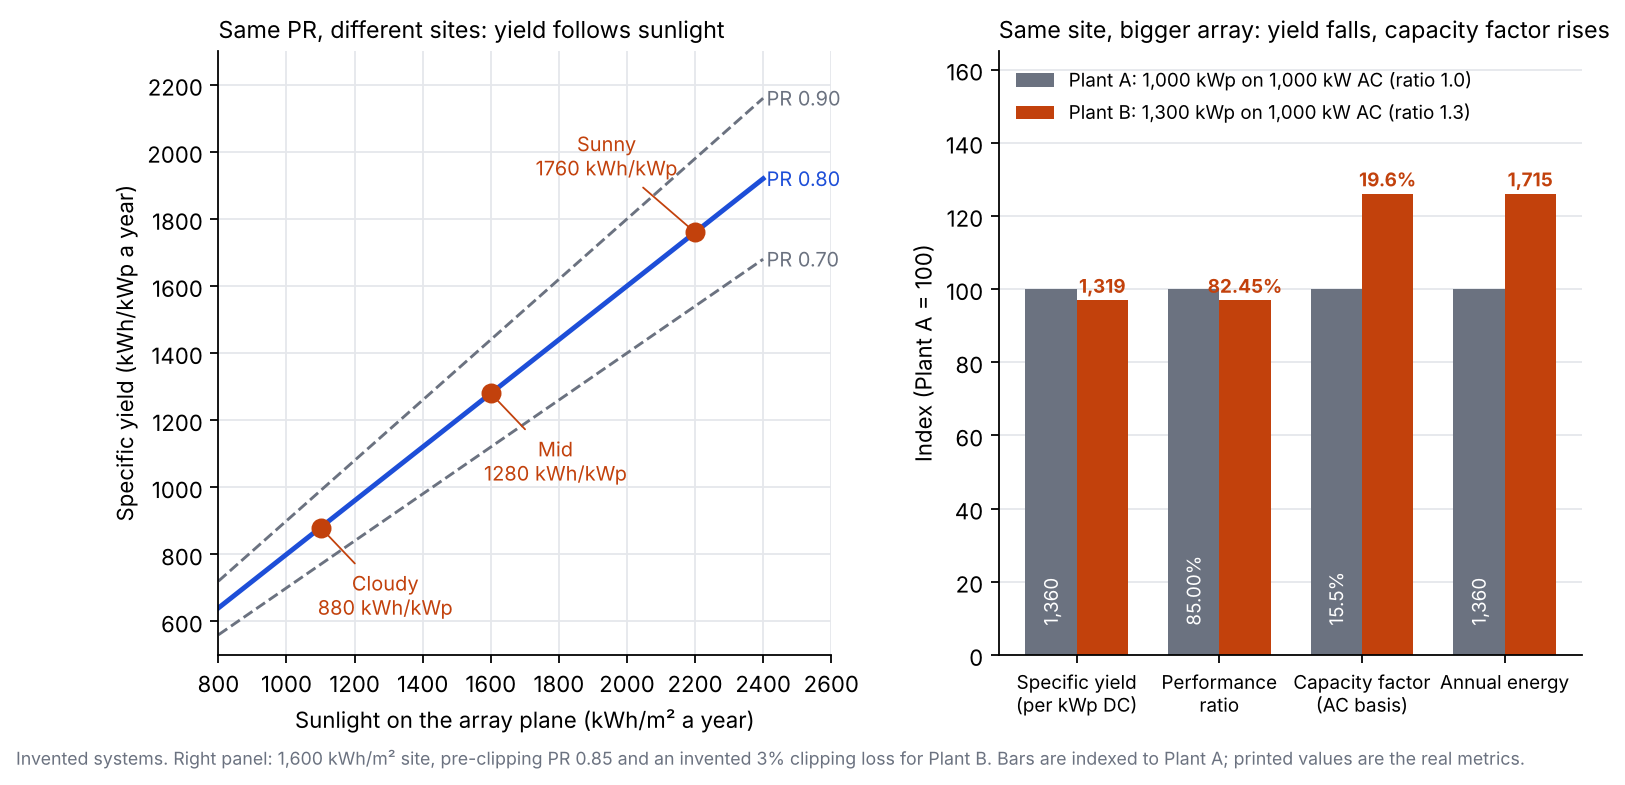
Figure 1. At one performance ratio, specific yield tracks sunlight. On one inverter, a bigger array lowers specific yield but raises AC capacity factor (example systems).
Worked examples: three sites, then two DC/AC ratios
All systems here are example. The first table fixes the performance ratio. The second fixes the site and changes the array size on one inverter.
Table 1. Three 1,000 kWp systems with the same assumed performance ratio of 0.80. Sunlight is yearly, on the array plane.
| Example site | Sunlight (kWh/m²) / PR (assumed) | Specific yield (kWh/kWp) | Annual energy (kWh) | DC capacity factor |
|---|---|---|---|---|
| Cloudy | 1,100 / 0.80 | 880 | 880,000 | 10.0% |
| Mid | 1,600 / 0.80 | 1,280 | 1,280,000 | 14.6% |
| Sunny | 2,200 / 0.80 | 1,760 | 1,760,000 | 20.1% |
The sunny site yields twice the cloudy one. The design is no different. Compare specific yield only within one site. Or divide by sunlight first.
Table 2. Two arrays on the same 1,000 kW AC inverter at the Mid site (1,600 kWh/m²). Pre-clipping PR is assumed at 0.85. Plant B’s 3% clipping loss is example, not a sourced figure. For real ranges, see inverter clipping.
| Metric | Plant A (1,000 kWp, ratio 1.0) | Plant B (1,300 kWp, ratio 1.3) |
|---|---|---|
| Annual energy (kWh) | 1,360,000 | 1,714,960 |
| Specific yield (kWh/kWp) | 1,360 | 1,319 |
| Energy per kW of AC (kWh/kW) | 1,360 | 1,715 |
| DC capacity factor | 15.5% | 15.1% |
| AC capacity factor | 15.5% | 19.6% |
| Performance ratio (DC nameplate basis) | 85.00% | 82.45% |
Plant B makes 26.1% more energy. Yet its specific yield and PR both fall. Its AC capacity factor rises 4.1 points. The same inverter works more hours. "Better" depends on the question. Specific yield asks how well each kWp performs. AC capacity factor asks how hard the inverter works.
Two cross-checks use published numbers. The PVWatts version 8 API page shows an example. It gives 4,131.35 kWh from a 4 kW system, with a capacity factor of 11.79. Dividing 4,131.35 by (4 × 8,760) gives 11.79%. EIA reported a 2017 AC capacity factor of 27% for US solar PV sites. With a capacity-weighted loading ratio of 1.25 at the end of 2016, EIA says the DC capacity factor would be about 22%. Dividing 27 by 1.25 gives 21.6%, which matches. The ratio and the factor date from different years, so treat it as a rough check.
Specific yield calculator
Enter annual AC energy and kWp. You get specific yield and DC capacity factor. Add AC kW for the AC capacity factor and sunlight for PR. The lower box turns a PR into specific yield. Capacity factor uses 8,760 hours. Use 8,784 in a leap year. The tool warns outside 600 to 2,200 kWh/kWp. That is our own rough check range, not a published norm.
What drives specific yield, and why comparisons need care
Sunlight on the array plane and performance ratio set specific yield. Change either one, and the figure changes. So does a change to the basis of the division.
- Sunlight and orientation: site, plane-of-array sunlight, tilt and azimuth. A single-axis tracker raises it. Take care when you compare fixed and tracked plants.
- Losses: temperature, shading, soiling, mismatch, wiring and inverter losses all sit inside PR. See system losses.
- DC/AC ratio: clipping lowers specific yield. A higher ratio raises AC capacity factor (Table 2). See DC/AC ratio.
- Weather year and file: Sandia says annual yield moves with the weather each year. The Folsom Labs article says weather files for one site can differ by 10% or more. See TMY.
- Year and boundary: SAM’s figure is for year one, before degradation. Meters may read after the inverter, the transformer or a curtailment limit.
- Module rating: kWp is the front-side STC rating. A bifacial array’s rear gain adds energy but not kWp. See bifacial modelling.
A comparison is fair only if four things match. These are the weather file, period, energy boundary and kWp basis. If DC/AC ratios differ, quote specific yield and AC capacity factor together.
How solar software handles specific yield
PVsyst, SAM and HelioScope name specific yield or kWh/kWp on the pages read, PVWatts gives only its inputs, and Aurora’s System Losses page names none. Tools also report on different bases: AC or DC energy, year one or lifetime, and kWp or kW of AC.
| Software | Reports specific yield or capacity factor? |
|---|---|
| PVsyst | Yes |
| SAM | Yes |
| PVWatts | Partly |
| HelioScope | Yes |
| Aurora Solar | Not stated |
"Not stated" means the page read does not name the metric. "Partly" means the page gives the inputs but not the metric by name. Ratings follow the October 2026 page read for each tool. How and where each tool reports it:
- PVsyst: "Specific production" is energy produced ÷ Pnom, shown on the main results page. Normalised yields are in kWh/kWp per day. These pages do not list capacity factor. Page read: PVsyst 7 tutorial, chapter 1 (figure labelled 7.2). Help page "Normalised performance index" (undated).
- SAM: Energy yield in kWh/kW (AC energy ÷ DC nameplate, year one). For PV models it gives a DC and an AC capacity factor. Page read: SAM help, "Energy Yield" and "Capacity Factor" (undated).
- PVWatts: The version 8 API returns capacity_factor (AC to DC) and ac_annual. Specific yield is ac_annual ÷ system capacity. Page read: PVWatts V8 API page (undated, examples show version 8.0.0).
- HelioScope: Its Metrics Bar lists "Specific Yield" as yield in kWh/kWp, total energy generated ÷ system DC nameplate. Capacity factor and PR are not listed there. Page read: HelioScope help, "Metrics Bar" (page shows last updated May 29, 2026).
- Aurora Solar: The System Losses help page names none of specific yield, kWh/kWp, capacity factor or PR. Page read: Aurora help, "System Losses" (page shows last updated 29 June 2026).
For scored company comparisons, see the best solar simulation software list.
Common mistakes with specific yield
FAQs
What is a good specific yield?
A good value is one close to local systems like it, because specific yield equals PR times plane-of-array sunlight. At PR 0.80, 1,100 to 2,200 kWh/m² gives 880 to 1,760 kWh/kWp. The Folsom Labs article on Solar Power World gives 1,000 to over 2,000 kWh/kWp as typical, and says the figure depends on location, orientation and losses.
Can I compare a monthly specific yield with an annual one?
No. A month has fewer hours and different sunlight. In an example 744-hour July, 150 kWh/kWp is a 20.2% DC capacity factor. Compare months with months, ideally at one site.
Does specific yield include degradation?
SAM’s energy yield is for year one, so it leaves out later degradation. Sandia notes that measured annual yield varies with the weather. For lifetime figures, see degradation rate.
Why do two tools give different specific yields for one site?
Weather files are a common cause, as the drivers section says. Loss defaults and clipping treatment add to the gap. First, run both tools on one weather file.
Related terms
- Performance ratio: specific yield divided by sunlight on the array.
- Capacity factor: energy as a share of running at rating for every hour.
- DC/AC ratio: array kWp divided by inverter AC kW.
- Capacity utilisation factor: the Indian name for capacity factor.
Next step: run your own system through the calculator above, then use the best solar simulation software list to find tools that report kWh/kWp. For measured specific yield, see the best solar monitoring software.
Sources
- Sandia PVPMC, Annual Yield (page metadata: last updated 28 September 2022, checked October 2026).
- SAM help, Energy Yield and Capacity Factor (undated, checked October 2026).
- NREL Annual Technology Baseline, PV AC and DC (undated page with a 2024 banner, checked October 2026).
- EIA, Today in Energy, 16 March 2018 (checked 30 October 2026).
- PVWatts V8 API documentation (undated, checked October 2026).
- PVsyst help, Normalised performance index and PVsyst 7 tutorial, chapter 1 (checked October 2026).
- Sandia PVPMC, Performance Ratio (checked October 2026).
- HelioScope help, Metrics Bar (page shows last updated May 29, 2026, checked October 2026).
- Zhang and Grana (Folsom Labs), Solar Power World, specific yield overview (August 2017 per its URL, checked 30 October 2026).
- Aurora Solar help, System Losses (page shows June 29, 2026, checked October 2026).
- Example systems: computed from the stated inputs.
Last updated 30 October 2026. Next scheduled review: 30 January 2027.