Key takeaways
- PR = AC energy ÷ (array kW at STC × plane-of-array sunlight in kWh/m²). Sandia says this is how the standard defines it.
- Our simulated 10 kW system scores 84.1% plain over one year, 87.7% corrected to 25 °C and 84.1% corrected to the annual mean, so always name the basis.
- In our simulated year with no faults, plain PR was 89.4% in January and 81.2% in July. That is a gap of 8.2 points.
- Adjusting for cell temperature cut that gap to 1.0 point (25 °C basis) or 0.8 point (annual mean basis).
- Published "good" values disagree: 75 to 85% (meteocontrol), up to 80% (SMA), 78.6% average for 75 US federal systems (NREL, 2021).
To see how monitoring and analytics tools report PR, see the best solar performance analytics software.
Performance ratio at a glance
PR is a percentage. It compares real output with an ideal output set by sunlight and nameplate power. This page reads one simulated year three ways: plain PR, PR corrected to 25 °C and PR corrected to the annual mean cell temperature.
| Item | Detail |
|---|---|
| Formula | PR = Yf ÷ Yr. Final yield Yf is AC kWh per kW of array. Reference yield Yr is plane-of-array kWh/m² divided by 1 kW/m². |
| Variants | Plain PR (nameplate basis). Temperature-corrected PR adds a cell temperature term to the expected energy. |
| Where it matters | Acceptance tests, performance guarantees, O&M reports and monitoring alerts. |
| Standard | IEC 61724-1, second edition, published 20 July 2021 per the Standards Council of Canada entry. The IEC text is not quoted here. |
| In software | Monitoring tools report PR from measured sunlight. Design tools report a simulated PR. |
Sandia’s PVPMC writes the daily AC form as YfAC ÷ Yr. It adds that IEC 61724 does not set the power rating. Sandia uses the DC rating at STC. Hukx also uses the nameplate rating. PVsyst says the PR definition fits grid-connected systems without storage.
Why performance ratio matters for installers
SMA calls PR a quality measure that does not depend on location. Plain PR still moves with cell temperature, as the next sections show. Compare plants only on the same basis and period.
PR lumps together every loss between sunlight and the meter: temperature, soiling, mismatch, wiring, inverter and downtime. Our system losses page splits it into steps. Mismatch loss is one of them. A simulation gives an expected PR. See energy yield simulation.
PVsyst has a help page on PR as a performance guarantee, so look at which basis a contract names. The commissioning report page covers handover paperwork. Once the plant is running, monitoring tools can raise alerts when output drops below expected. The risk is mistaking a seasonal swing for a fault, or a fault for a season.
Why does performance ratio change with the seasons?
Hot cells make less power, and cells run hottest in summer. Plain PR ignores that. It dips in warm months and rises in cold ones.
Sandia notes that PR is usually lower in warmer months. Hukx says the traditional PR ignores array temperature. That causes the seasonal swing. It puts the usual coefficient near -0.3% per kelvin. NREL’s 2013 report on weather-corrected PR says the plain ratio can swing by about 10% over a year. Its authors warn that a plant could pass in winter and fail in summer.
Our example shows this at work. Sunlight-weighted cell temperature is 46.6 °C in July and 18.9 °C in January. With -0.35% per kelvin, July power is 7.6% below the nameplate figure. January power is 2.1% above it. That is a 10% relative gap, which matches 89.4% against 81.2%.
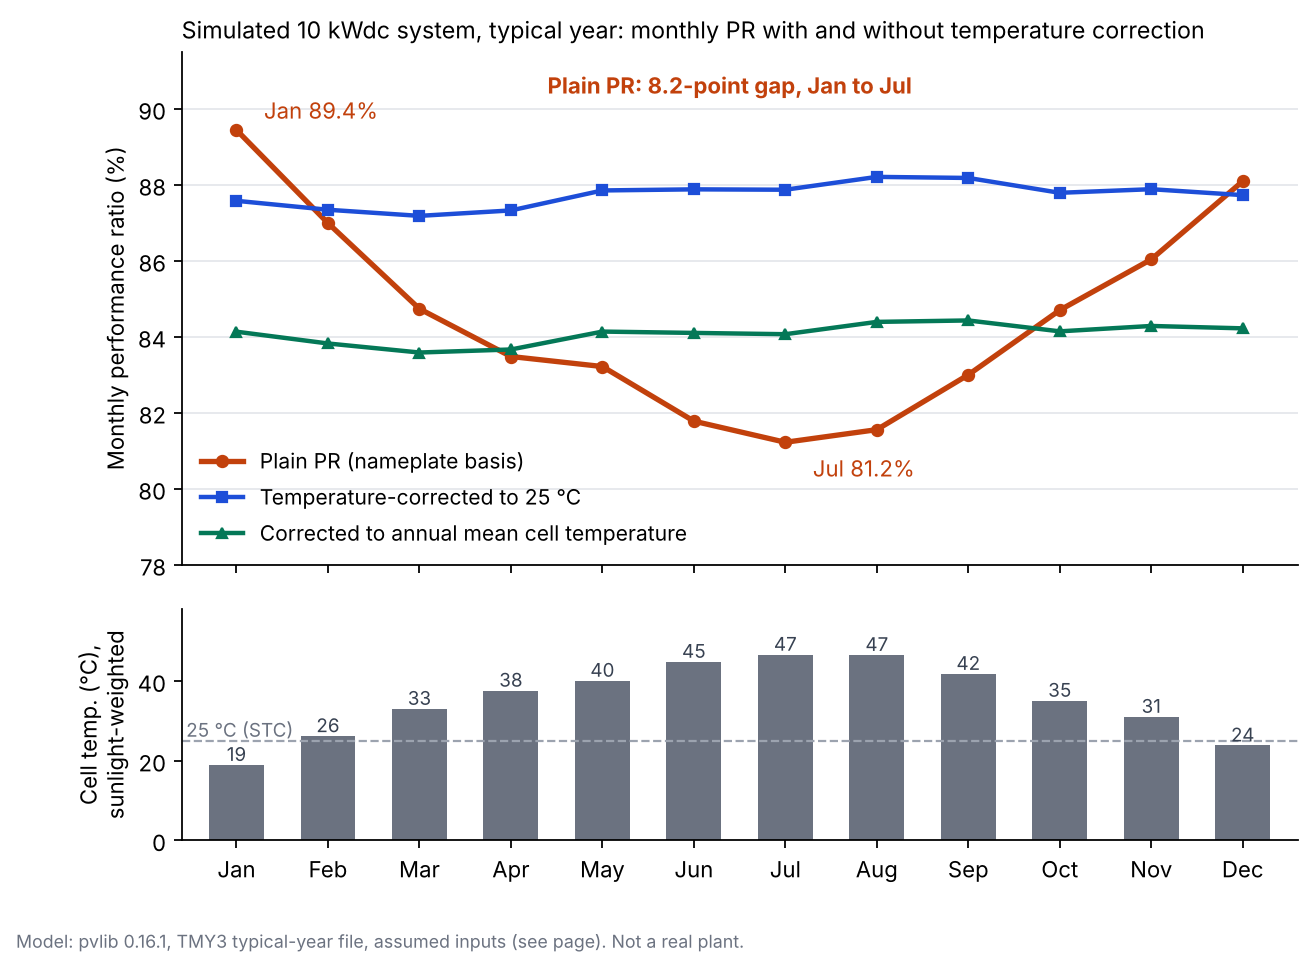
Figure 1. With no faults at all, plain PR swings 8.2 points between January and July. Temperature correction cuts the swing to about 1 point.
How to calculate performance ratio
Divide measured AC energy by what an ideal system would make from the same sunlight. For the corrected version, adjust that ideal for cell temperature.
- Pick a period. SMA recommends one year and at least one month. meteocontrol’s VCOM Cloud works out PR for periods of one day or longer.
- Read AC energy for the period in kWh from the meter or inverter.
- Read plane-of-array sunlight in kWh/m². A pyranometer in the array plane is best. Satellite data is the fallback.
- Plain PR = AC kWh ÷ (array kW at STC × plane-of-array kWh/m²).
- Corrected PR: for each interval, expected energy = array kW × (G ÷ 1,000) × (1 + γ × (Tmod − Tref)). Add these up. Then divide AC energy by the total. The coefficient γ is a negative number.
- Pick Tref and say which one you picked. Hukx uses 25 °C. PVsyst’s temperature-corrected PR uses the sunlight-weighted mean array temperature. NREL’s 2013 report uses the site’s typical average cell temperature.
The 25 °C basis lifts PR, since cells are usually warmer than 25 °C. In our example the annual-mean basis gives the same annual PR as the plain form. PVsyst warns that its version over-corrects fixed sheds and is nearly unusable for trackers. See temperature coefficient for γ.
Worked example: one simulated year
The model ran pvlib 0.16.1 on a typical-year weather file. PR is worked out each month, plain and corrected. This is a model, not a real plant.
| Input | Value |
|---|---|
| Weather | TMY3 file 723170 (Greensboro, North Carolina) bundled with pvlib. A typical-year file, not a measured year. |
| Array | 10 kW DC at STC, 30° tilt, facing south, Hay-Davies transposition, albedo 0.2 |
| Temperature | pvlib SAPM cell model, open-rack glass-glass. Γ = -0.35% per kelvin (assumed) |
| Other losses | 7% lumped for soiling, mismatch and wiring (assumed). ASHRAE angle-of-incidence loss on beam light |
| Inverter | 8.3 kW AC, 96% nominal, pvlib PVWatts curve |
Expected and actual energy come from one model. So there are no faults, outages or sensor errors. A real plant has those, so its PR would read lower.
Plain PR falls from winter to summer. Both corrected columns stay nearly flat.
| Month | AC kWh / sunlight kWh/m² | Cell °C (weighted) | Plain PR | Corrected PR (25 °C / annual mean) |
|---|---|---|---|---|
| Jan | 966 / 108.0 | 18.9 | 89.4% | 87.6% / 84.1% |
| Feb | 1,012 / 116.3 | 26.1 | 87.0% | 87.3% / 83.8% |
| Mar | 1,308 / 154.3 | 33.0 | 84.7% | 87.2% / 83.6% |
| Apr | 1,415 / 169.5 | 37.6 | 83.5% | 87.3% / 83.7% |
| May | 1,401 / 168.4 | 40.1 | 83.2% | 87.8% / 84.1% |
| Jun | 1,422 / 173.9 | 44.8 | 81.8% | 87.9% / 84.1% |
| Jul | 1,441 / 177.4 | 46.6 | 81.2% | 87.9% / 84.1% |
| Aug | 1,428 / 175.0 | 46.5 | 81.6% | 88.2% / 84.4% |
| Sep | 1,233 / 148.6 | 41.8 | 83.0% | 88.2% / 84.4% |
| Oct | 1,187 / 140.1 | 35.0 | 84.7% | 87.8% / 84.1% |
| Nov | 899 / 104.5 | 31.0 | 86.0% | 87.9% / 84.3% |
| Dec | 955 / 108.4 | 23.8 | 88.1% | 87.7% / 84.2% |
| Year | 14,666 / 1,744.5 | 36.9 | 84.1% | 87.7% / 84.1% |
Plain PR runs from 81.2% (July) to 89.4% (January). Corrected to 25 °C, it runs from 87.2% to 88.2%. Corrected to the annual mean of 36.9 °C, it runs from 83.6% to 84.4%. The annual figure is 14,666 ÷ (10 × 1,744.5) = 84.1%.
Correcting to 25 °C lowers PR in January (89.4% to 87.6%) and December (88.1% to 87.7%). Cells are cooler than 25 °C in those months. A rerun with a flat 96% inverter efficiency cut the annual-mean spread from 0.8 to 0.4 points. So about half of the leftover spread comes from inverter efficiency at low load.
Performance ratio calculator
Enter one period’s AC energy, array size and plane-of-array sunlight to get plain PR. Add a temperature to get the corrected values.
Use the sunlight-weighted module temperature, not a simple average. In July a simple all-hours mean of 37.9 °C gives 85.1% instead of 87.9%.
What is a good performance ratio?
Four sources give four different answers, because each uses its own definition, year and sample.
| Source (date) | What it says |
|---|---|
| meteocontrol VCOM Cloud help centre (page last modified 29 July 2026) | "Typically, an annual PR value of 75-85% is considered good." |
| SMA technical information, version 1.1 (Undated) | High-performance plants "can however reach a performance ratio of up to 80 %". |
| NREL for DOE FEMP, 75 federal PV systems (December 2021) | Average 78.6%, median 79.0%, range 46% to 101% (Table 6). About 85% may be possible with optimal O&M. |
| Reich et al., as quoted in that NREL report (2010 data) | 100 German systems: 70% to 90%, median 84%. |
Limits of each source:
- meteocontrol: Basis and sample not stated.
- SMA: Older note. Sample not stated.
- NREL report: PR here is measured output divided by modelled output. It counts only timesteps when the system was available. It is not the nameplate form. Its own text gives 105% for the top value, while its Table 6 and executive summary give 101%. We quote the table figure.
- Reich et al.: Second-hand. Definition not checked.
None of these is a pass mark for your contract. Use the guaranteed or modelled value for the site, and state the basis. Our 84.1% is a fault-free model, while the sources above sample real plants, so the two are not a like-for-like test. Read it only as an upper-end illustration.
How solar software handles performance ratio
All four tools report PR. PVsyst documents a temperature-corrected form in full and SolarEdge only in part, while SMA and VCOM do not describe one in the pages cited.
| Software | Reports PR? | Temperature-corrected PR |
|---|---|---|
| PVsyst | Yes | Yes: PRTemp, shown in the report only when requested |
| SMA Sunny Portal | Yes | Not stated |
| meteocontrol VCOM Cloud | Yes | Not stated |
| SolarEdge monitoring | Yes | Partly: an optional module temperature sensor with a Pmpp coefficient |
Not stated: the company page we cite does not say. Partly: the page covers an optional or partial correction. All pages were checked in October 2026.
- PVsyst: Method: modelled, with a measured-PR formula for guarantee checks. Source: PVsyst help, "Performance ratio (PR)" and "PR as performance guarantee".
- SMA Sunny Portal: Method: Measured. Needs irradiance sensors on all module areas. Source: SMA Sunny Portal manual, "System Monitoring". The page does not name Classic or ennexOS.
- meteocontrol VCOM Cloud: Method: Measured. Default IEC formula, one-day minimum period. Source: meteocontrol help centre, "PR/Performance ratio chart" and "KPI editor". A licensed KPI editor adapts the formulas.
- SolarEdge monitoring: Method: Measured sensors, or a satellite option in some regions. Source: SolarEdge application note, version 3.0, April 2024. The note says satellite services are no longer sold. The product page (undated) still lists one.
Common mistakes with performance ratio
FAQs
Can performance ratio be above 100%?
Yes. Readings above 100% happen. SMA lists a shaded, dirty or differently angled irradiance sensor as a cause. Check the sensor and data first, before you trust the value.
What is the difference between performance ratio and specific yield?
Specific yield is kWh per kW, and it moves with sunlight. PR divides the sunlight out, so it does not. Our example makes 1,467 kWh/kW, and 1,467 ÷ 1,744.5 gives 84.1%. See specific yield.
What is a good performance ratio?
No single value is agreed: the sources in the table above range from 75 to 85% (meteocontrol) to up to 80% (SMA) and a 78.6% federal average (NREL). Use the guaranteed or modelled value for your site and state the basis.
Does bifacial change the calculation?
PVsyst adds rear-side sunlight to the bottom of the formula, weighted by the bifaciality factor. It says versions before 8.0.12 left that factor out. See bifacial modelling.
How long a period should I use?
One year is best, since it covers every season. SMA gives a one-month minimum. For shorter periods, use the temperature-corrected form. You can also compare with a model run on the same weather.
How is it different from a performance index?
Hukx says the performance index uses a more detailed model of expected energy. The nameplate form does not. The index divides measured energy by a model-based expectation for the real weather. See energy performance index.
Related terms
- Energy performance index: measured energy divided by a model-based expectation for the real weather.
- Specific yield: annual kWh per kW of array.
- Temperature coefficient: the power change per kelvin that the correction uses.
- Digital twin: a plant model calibrated on measured data.
Next step: before you write a PR target into a contract, see which tools report the basis you need in the best solar performance analytics software list.
Sources
- Sandia PVPMC, Performance ratio (checked October 2026).
- Hukx, How to calculate PV performance ratio and performance index (checked October 2026).
- PVsyst help, Performance ratio (PR) and PR as performance guarantee (checked October 2026).
- Standards Council of Canada, IEC 61724-1:2021 entry (checked October 2026).
- NREL, Weather-Corrected Performance Ratio, NREL/TP-5200-57991, April 2013 (checked October 2026).
- Walker and Desai, NREL for DOE FEMP, Understanding Solar Photovoltaic System Performance, December 2021 (checked October 2026).
- meteocontrol help centre, PR/Performance ratio chart and KPI editor (checked October 2026).
- SMA, Performance ratio technical information, version 1.1 and Sunny Portal manual, System Monitoring (checked October 2026).
- SolarEdge, Performance Ratio Calculation and Activation, version 3.0, April 2024, and satellite-based PR page (checked October 2026).
- Weather and model: TMY3 file 723170 and pvlib 0.16.1, run with one script (October 2026).
Last updated 30 October 2026. Next scheduled review: 30 January 2027.