Key takeaways
- A Meteonorm typical year is generated, not picked from real months. The docs say "A TMY is generated stochastically" from interpolated monthly averages.
- The PVsyst tutorial (undated) says two generations from its own generator may differ by 0.5 to 1% in yearly energy. The Meteonorm API repeats a result if you reuse the same random_seed.
- The period depends on the version. Version 9 uses 2001 to 2020, and version 8 used 1996 to 2015 for radiation.
- For irradiance, Meteonorm uses the nearest station alone only within 2 km. Beyond 50 km it uses gridded data alone.
- On an illustrative ten-year series, a sigma of 3% or the real years put the lower level about 3.5% to 3.8% below the typical year.
To see which simulators ship Meteonorm weather data, see the best solar simulation software.
Meteonorm at a glance
Meteonorm supplies weather files and time series for any location. It builds them from station records, satellite data and climate projections.
| Item | Detail |
|---|---|
| What it is | A data source and generator from Meteotest, not design software. Its docs describe time series for "any location on Earth". |
| Products | Meteonorm Climate: a web application, a REST API and a C library. The Climate page calls it "the direct successor to Meteonorm 8" and lists those three forms. |
| Data types | Typical year (TMY) and actual year (AMY). |
| Where it matters | The weather input of a yield simulation. See weather and solar resource data. |
| Standard or rule | No standard. It exports formats such as EPW and TMY3. For how it differs from selected-month files, see TMY. |
Why does Meteonorm matter for installers?
Many simulators use Meteonorm data by default. So it can set the kWh in a proposal, and nobody chose it. The version and period behind it can change the number. The software table shows which tools document Meteonorm use.
A Meteonorm typical year also carries no year-to-year spread. A lender or guarantee needs one. See P50, P90 and P99.
How does Meteonorm make a typical year?
It interpolates long-term monthly averages for the site. Then a random (stochastic) model builds a realistic year of hourly values. The docs describe these two steps.
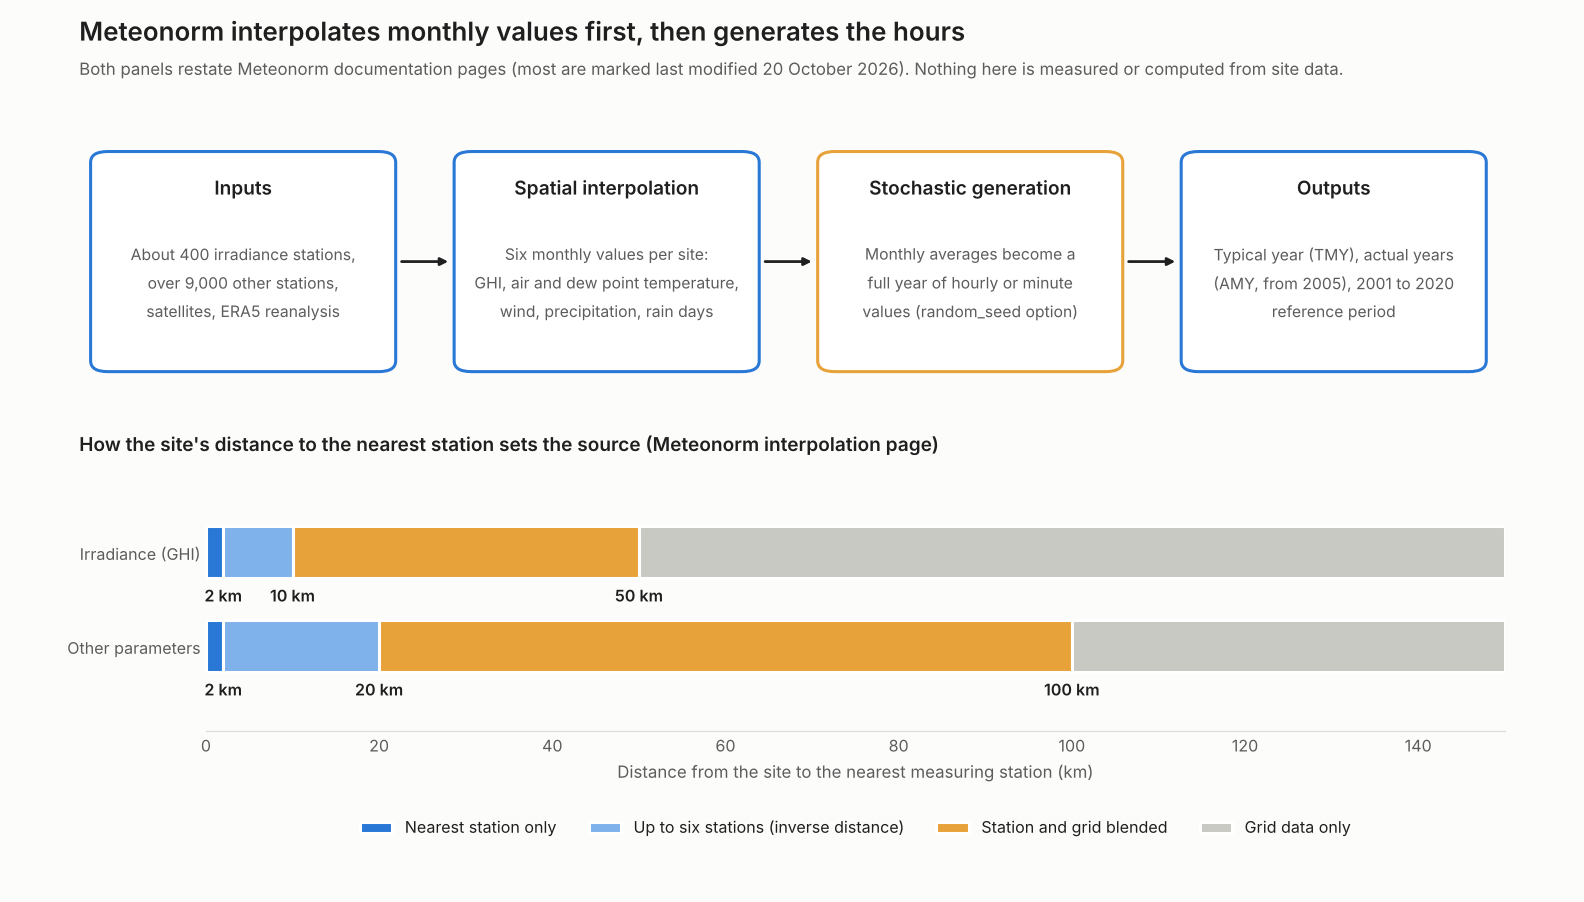
Figure 1. For irradiance, Meteonorm uses the nearest station alone only within 2 km and gridded data alone beyond 50 km. Other parameters use 2, 20 and 100 km.
- Collect. About 400 irradiance stations and over 9,000 other stations. Satellites supply irradiance where stations are few. ERA5 reanalysis is the fallback, mainly in polar regions (data page).
- Interpolate. It interpolates six monthly values: GHI, air temperature, dew point, wind speed, precipitation and rain days. It blends up to six stations by inverse distance weighting. That applies between 2 km and the second limit.
- Generate. The monthly averages become the baseline for a stochastic hourly or minute series. The API page lists a random_seed option (0 to 1000, default 0). It says identical requests with the same seed give identical results.
PVsyst describes its own generator for monthly data. It uses Markov transition matrices for irradiance. It says two generations from the same monthly data differ. That is PVsyst’s method, not Meteonorm’s API.
What does Meteonorm output?
It outputs a typical year (TMY) or an actual year (AMY). The Climate page says over 50 parameters. The API page lists time steps from one minute to one month.
- TMY: a typical year for a reference period. Hourly and minute data, 2001 to 2020 by default. Future-climate versions use scenarios SSP1-2.6, SSP2-4.5 and SSP3-7.0.
- AMY: weather for a real period. It runs from 2005 to the current year (Climate overview page, 20 October 2026). Irradiance comes from satellites, with ERA5 as fallback. Temperature and wind come from ERA5 (AMY overview page, 13 October 2026).
- Formats: the API page lists csv, json, epw, pvsyst, tmy3, pvsol, polysun and trj. These are the only formats the page names.
- Extreme settings: the API lists options such as poe_10_year, poe_90_year and worst_case_year. The pages read do not define them, so do not use one as a P90 until its meaning is confirmed.
Which Meteonorm version and period do you get?
Version 9 uses 2001 to 2020 for radiation and temperature. Version 8.x used 1996 to 2015 for radiation. A tool tied to an older version gives older-period data.
| Version | Release year (PVsyst’s page) | Periods as printed | Where printed |
|---|---|---|---|
| 8.0, 8.1, 8.2 | 2020, 2021, 2023 | Radiation 1996 to 2015. Temperature, wind and precipitation 2000 to 2019. | PVsyst help. HelioScope help for 8.2 rev 2 |
| 9.0 | 2025 | 2001 to 2020 for radiation, temperature and other parameters. Satellite data to 2023. | Meteonorm what’s-new page. PVsyst help |
In the changelog, the newest entry is v9.0.16 (27 October 2026), an irradiance nowcast update for Africa. The what’s-new page (no date) says version 9 moved from a desktop application to a web application. The Meteonorm 8 page says "Meteonorm Version 8 and older are no longer available."
PVsyst’s help prints these pairs. PVsyst 8.1 goes with Meteonorm 9.0. PVsyst 8.0 goes with 8.2. PV*SOL’s help lists Meteonorm 9, 2001 to 2020.
What does Meteonorm cost, and what do the terms say?
The Meteonorm pages print prices in Swiss francs (CHF). Neither the Climate page nor the app page prints a date. We re-read both on 3 November 2026 and the figures below matched, so recheck before you quote.
As printed (read October 2026):
- Web app plans, per year: Basic 320 CHF (unlimited TMY, 2 AMY requests a year). Pro 980 CHF (30 AMY). Expert 4,200 CHF (unlimited TMY and AMY). Education 260 CHF (10 seats). AMY top-up 120 CHF, only with an existing plan.
- API plans, per year: S 960 CHF (10,000 tokens a month). M 2,400 CHF (100,000). L 4,800 CHF (1,000,000).
- One-off bundles: S 2,000 tokens, 90 CHF. M 30,000 tokens, 600 CHF. L 100,000 tokens, 1,000 CHF. Tokens are valid for 4 years.
- Token cost: TMY request 500 tokens. AMY request 1,000 tokens, for a one-year period.
- Free option: A web app demo at demo.meteonorm.com, linked from the app page.
Token math: plan S buys 20 TMY or 10 AMY a month.
The terms for the Web App and API are headed April 24, 2025. They allow manual web app use by an assigned user. They limit passing the data to third parties. One permitted example is "documenting an assessment for a client of the User". You may use the API in your own applications. Their turnover must stay below 24,000 CHF. The text read does not say whose turnover this means. Read the full terms. This is not legal advice.
What do the docs say about accuracy?
Meteonorm’s accuracy page gives an RMSE of about 6% for interpolated yearly irradiance. For temperature it gives 0.9 °C. It names no sample size. Treat the figures as the company’s own claim.
The same page says natural change from year to year is often larger than model uncertainty. This is for measured global irradiance. It also says period choice typically shifts average irradiance by less than 1 to 3% (RMSE). These are the company’s own figures and are not checked here.
Typical year or real years: how much spread?
A typical-year run gives one number and no spread. To get a spread, add a sigma you supply. Or run several actual years and measure it. The calculator compares both routes.
The table (illustrative, invented) uses a typical-year run of 1,020.0 kWh per kWp. It also uses ten made-up real-year runs. It is not a site and not Meteonorm output. Sigma 3.0% is a placeholder.
| Route | Lower level (kWh per kWp) | Against typical year |
|---|---|---|
| A. Typical year alone | 1,020.0 | 0.00% |
| B. Typical year, sigma 3.0%, P90 | 980.8 | -3.84% |
| C1. Ten years: mean 1,017.8 less 1.2816 x 28.2 | 981.6 | -3.76% |
| C2. Ten years: 10th percentile | 984.0 | -3.53% |
| C3. Lowest of the ten years | 972.5 | -4.66% |
Here, PVsyst’s 0.5% to 1% re-run band is 5.1 to 10.2 kWh per kWp in the example series. That is smaller than the gap between route A and the others, which is 36.0 to 47.5. The method is on P50, P90 and P99.
Enter your typical-year figure and a list of real-year runs. If the calculator does not load, open the Meteonorm spread calculator on its own page. A ten-year AMY series is ten one-year requests. By the Climate page’s token costs, that is 10,000 tokens.
How solar software handles Meteonorm
PVsyst, PV*SOL, HelioScope and pvlib document Meteonorm use. For Polysun, the pages read do not state it. Not stated: the company page we cite does not say. The version a tool ships sets the data period.
| Software | Documents Meteonorm use? | Page read |
|---|---|---|
| PVsyst | Yes | PVsyst help and tutorial (undated) |
| PV*SOL premium | Yes | Valentin help (undated) |
| HelioScope | Yes | HelioScope help, 3 June 2026 |
| pvlib python | Yes | pvlib 0.16.1 docstrings |
| Polysun | Not stated | Meteonorm API page (undated) |
What each page says:
- PVsyst: Meteonorm monthly data are the built-in source. Imports make a synthetic hourly or 1-minute file. Version 8.1.5 lists 1, 5, 15 and 60 minute options.
- PV*SOL premium: Lists Meteonorm 9, worldwide, 2001 to 2020, among new-location sources. How hours are made is not stated.
- HelioScope: Meteonorm 8.2 rev 2. Monthly values, stochastic hours, a synthetic year labelled 2021.
- pvlib python: Functions for the Meteonorm API: TMY, forecast and observation data. An API key is needed.
- Polysun: Meteonorm lists a polysun export format. That does not show Polysun uses Meteonorm data. Polysun’s own docs are not among the pages read.
To compare tools, see the best solar design software.
Common mistakes with Meteonorm
FAQs
Is Meteonorm the same as a TMY?
Not quite. Meteonorm is a data source that generates a typical year from interpolated monthly averages. A typical-year file can also be built from selected real months. See TMY for how the two differ.
Is Meteonorm free, and how much does it cost?
A web app demo is free. The web app starts at 320 CHF a year and the API at 960 CHF a year (prices undated, so recheck). The cost section lists every plan and the terms. PVsyst bundles Meteonorm monthly data, and the pages read do not state its licence terms.
Why do two runs of the same site differ slightly?
PVsyst says two generations from the same monthly data may differ by 0.5 to 1%. That is PVsyst’s generator. The Meteonorm API repeats a result when you reuse the same random_seed.
How does Meteonorm compare with NSRDB?
Meteonorm says its time series cover any location on Earth, while NSRDB is a US gridded set of solar radiation data. Both are data inputs, not design software. See the NSRDB page for its details.
Does Meteonorm give a P90?
Not as a stated output. The web app page mentions extreme scenarios for risk checks, not P90. The API lists a poe_90_year option, but the pages read do not define it. A sigma or several real years gives a spread you can explain.
Related terms
- TMY: a one-year weather file of typical months.
- NSRDB: the US satellite-based solar radiation database.
- Weather and solar resource data: the inputs a simulation reads.
- pvlib: a Python library with a Meteonorm client.
Next step: before you quote a yield, compare the best solar simulation software for the weather source each tool documents.
Sources
- Meteonorm Climate overview, TMY overview, interpolation, data for TMY, accuracy. Each says last modified 20 October 2026. Checked October 2026.
- Meteonorm AMY overview (last modified 13 October 2026). Also the what’s new vs Meteonorm 8 (no date printed). Checked October 2026.
- Meteonorm API, climate/tmy and changelog (v9.0.16 dated 2026-10-27), checked November 2026.
- Meteonorm Climate page and web app page: prices and tokens, no page date (re-read 3 November 2026). Terms, dated April 24, 2025.
- PVsyst: API data import, Meteonorm data and the meteorological data tutorial, all undated (checked October 2026).
- PV*SOL help, climate data (undated) and HelioScope help (updated 3 June 2026). Checked October 2026.
- pvlib 0.16.1 iotools, read from the installed package (checked October 2026).
Last updated 30 October 2026. Next scheduled review: 30 January 2027.