Key takeaways
- At the three sites we modelled, the best fixed south tilt sat below latitude: 25° at Miami (25.8°N), 32° at Greensboro (36.1°N) and 44° at Sand Point (55.3°N).
- The top of the curve is flat. A miss of 10° costs 1.1% to 1.2% and a miss of 20° costs 4.3% to 4.8%.
- Flat modules lose 7.1% at Miami, 11.9% at Greensboro and 20.1% at Sand Point against the best tilt.
- The best tilt moves with the season: 49° to 72° in December to February, 2° to 22° in June to August. Two settings a year add 3.4% to 4.0% on paper.
- A 4 in 12 south roof (18.4°) gets 99.5%, 97.8% and 93.0% of the best sunlight. Pitch costs most at high latitude.
To sweep tilt for a site in software, see the best solar simulation software.
Tilt angle at a glance
Tilt is a single number in degrees. Its best value depends on latitude, weather and the goal, so no standard fixes it.
| Item | Detail |
|---|---|
| Formula | Roof tilt = arctan(rise ÷ run). A 4 in 12 pitch is 18.4°. |
| Unit and range | Degrees from horizontal, 0 to 90. Our best south tilts were 25° to 44° for latitudes 25.8°N to 55.3°N. |
| Where it matters | Yield estimates, roof plane choice, ground-mount row spacing and seasonal adjustment. |
| Standard or rule | No single standard. PVEducation says maximum yearly power comes when tilt equals latitude. |
| In software | Design tools mostly take tilt as an input. PVsyst and PVGIS also search for the best one. See best solar simulation software. |
Why tilt angle matters for installers
Tilt sets annual yield and how that yield is spread across the year. On a pitched roof it also helps decide which planes are worth filling.
A tilt error of 10° cost about 1% in our runs. At the three sites we modelled, 10 degrees off the best tilt lost 1.1% to 1.2% of annual sunlight. So a wrong tilt rarely sinks a job. The large losses come from flat or low planes at high latitude, such as the 20.1% we modelled at 55.3°N.
On flat roofs and the ground, tilt also sets row spacing and land use. A lower tilt can be a sound trade there. See ground-mount design, row spacing and pitch and solar panel layout. For rotating arrays, see single-axis tracker.
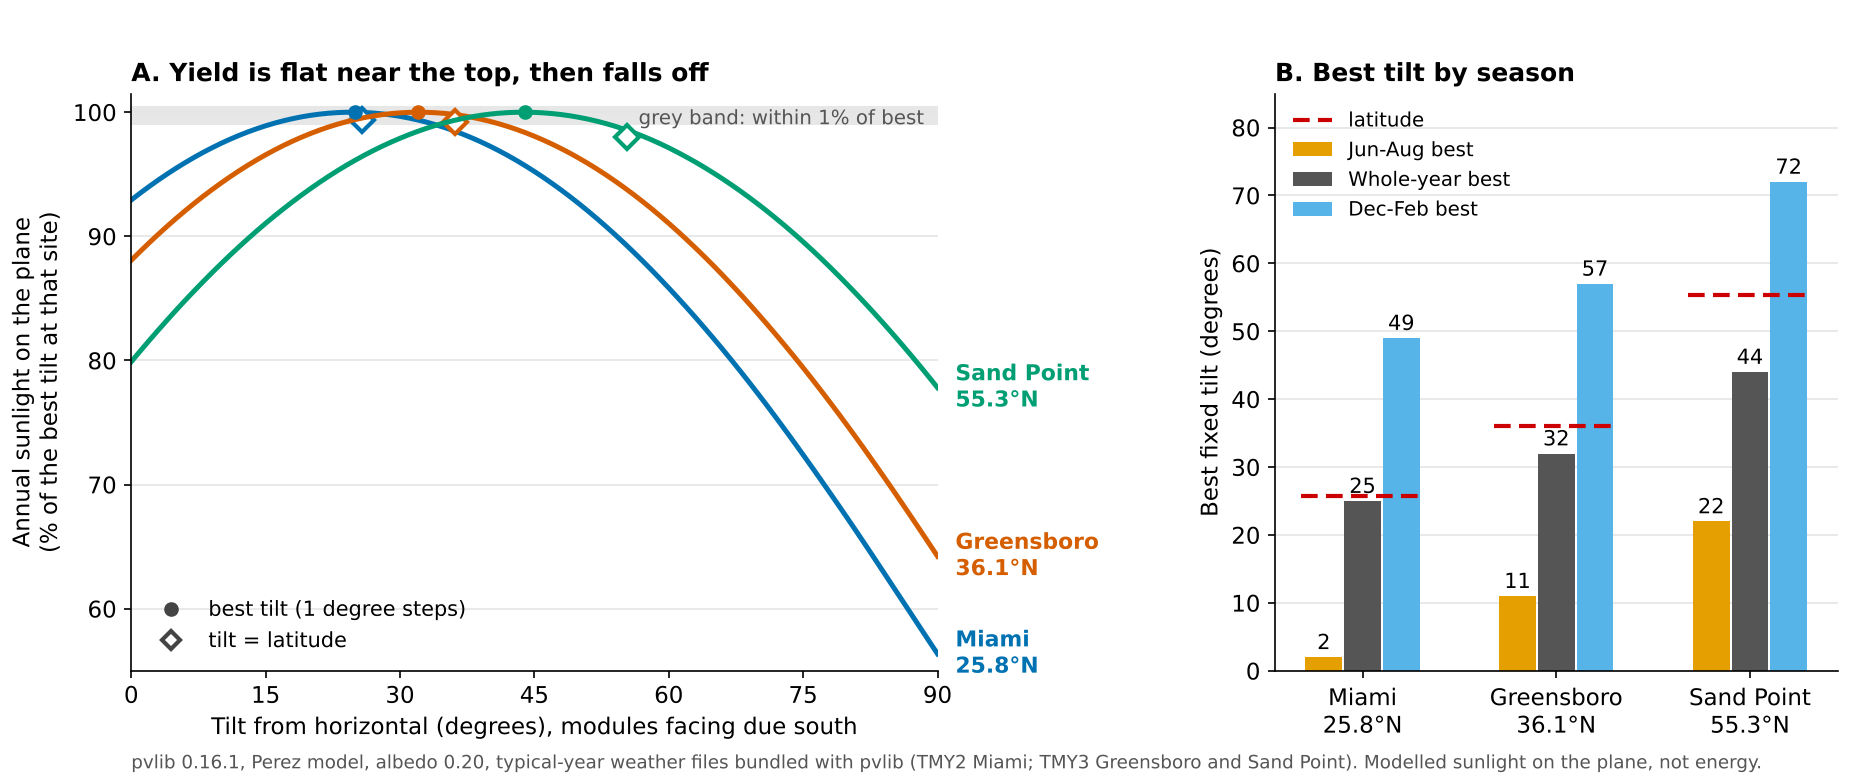
Figure 1. The best tilt falls below latitude at all three sites: 25°, 32° and 44° against 25.8°, 36.1° and 55.3°N. Each curve stays within 1% of its peak across a band 17° to 18° wide.
How is the best tilt angle found?
Two ways work. One is a rule of thumb from latitude. The other is a simulation. It adds up the sunlight on the tilted plane for each hour of a typical year at the site.
- Load hourly global, direct and diffuse sunlight from a typical meteorological year file (see weather and solar resource data).
- Find the sun’s position for each hour.
- Convert the flat-surface values to the tilted plane. This adds direct, sky diffuse and ground-reflected light. We used pvlib’s Perez model with albedo 0.20.
- Sum the 8,760 hours for each tilt from 0° to 90° at your azimuth.
- Pick the tilt with the highest total, or the middle of the flat top if other goals matter.
The goal matters. PVsyst says the relevant optimum for grid-connected systems maximises yearly energy. Its tool can also optimise for winter, summer or chosen months. PVGIS also assumes the angles stay fixed for the whole year.
Rules of thumb give a starting point. PVEducation states that maximum yearly power comes when tilt equals latitude. RatedPower’s blog says that, in its fixed-structure calculation, the recommended tilt above 20° latitude is 0.85 times latitude. Our best tilts were 0.97, 0.89 and 0.80 of latitude, as the next table shows.
Worked example: three latitudes
We swept tilt from 0° to 90° for a south-facing plane at three sites. We used typical-year data (not measurements) from weather files that ship inside pvlib 0.16.1. Miami is a TMY2 file. Greensboro and Sand Point are TMY3 files. The three files cover different base periods, so compare the shape, not the totals. Albedo is fixed at 0.20, so snow is not modelled.
| Site (latitude) | Horizontal sunlight (kWh/m²) | Best tilt | Within 1% of best | Best tilt, sunlight (kWh/m²) |
|---|---|---|---|---|
| Miami, FL (25.8°N) | 1,793 | 25° | 16 to 33° | 1,918 |
| Greensboro, NC (36.1°N) | 1,566 | 32° | 23 to 41° | 1,777 |
| Sand Point, AK (55.3°N) | 829 | 44° | 35 to 53° | 1,038 |
The horizontal column is each file’s own global horizontal value. Our model’s flat plane gives 1,783, 1,565 and 829 kWh/m².
The diffuse model moves the answer by a few degrees. Hay-Davies gives 22°, 30° and 42°, and the isotropic model gives 21°, 28° and 40°. Treat a best tilt as good to about 4°.
Next, the loss against each site’s best tilt, with sunlight on the plane as the measure. Small misses cost little. Flat and vertical planes cost the most.
| Site | 10° below best | 10° above best | 20° below best | 20° above best |
|---|---|---|---|---|
| Miami | 1.1% | 1.2% | 4.5% | 4.8% |
| Greensboro | 1.2% | 1.1% | 4.7% | 4.6% |
| Sand Point | 1.1% | 1.1% | 4.3% | 4.5% |
The next table sets the rule-of-thumb, flat and vertical tilts against each site’s best tilt.
| Site | Tilt = latitude | 0.85 × latitude | Flat | Vertical |
|---|---|---|---|---|
| Miami | 0.0% (26°) | 0.1% (22°) | 7.1% | 43.6% |
| Greensboro | 0.2% (36°) | 0.0% (31°) | 11.9% | 35.8% |
| Sand Point | 1.4% (55°) | 0.1% (47°) | 20.1% | 22.2% |
Setting tilt equal to latitude costs 0.0%, 0.2% and 1.4%. The 0.85 rule costs 0.1%, 0.0% and 0.1%. Both are close to the best at these three sites. We did not test other sites, so do not treat 0.85 as general.
Our 10° losses match a published estimate, but our 40° losses sit at the top of its range. Nicolás-Martín and colleagues (Renewable Energy, 2020) estimate average losses of 1% for a 10° variation. For 40° they give 12% to 18%, by latitude. At 40° above the best tilt we lost 17.0% to 18.2%, at or just above the top of that range.
Two limits apply. Clear sky pushes the best tilt up to 26°, 35° and 49°, so use a typical-year file. Adding cell temperature and reflection losses gave best tilts of 25°, 33° and 44°. It moved each 10° and 20° loss in this table by at most 0.3 points.
Should tilt change between summer and winter?
A lower tilt suits summer and a steeper one suits winter. Changing the tilt twice a year added only 3.4% to 4.0% of sunlight in our model, before labour.
| Site | Best Jun to Aug and Dec to Feb | Best Apr to Sep and Oct to Mar | Gain from two settings | Gain, latitude ∓ 15° |
|---|---|---|---|---|
| Miami | 2° and 49° | 7° and 43° | 4.0% | 3.8% (11°, 41°) |
| Greensboro | 11° and 57° | 16° and 51° | 3.7% | 3.6% (21°, 51°) |
| Sand Point | 22° and 72° | 30° and 66° | 3.4% | 2.6% (40°, 70°) |
The Gain, latitude ∓ 15° column tests a common rule, latitude minus 15° for summer and plus 15° for winter. Sunrun’s guide says tilt angles vary by about 15° with the seasons, and gives +/- 15° for summer and winter. The rule captures most of the gain at Miami and Greensboro and less at Sand Point. The gains are plain sunlight totals. They ignore labour, safety and any tariff that prices winter and summer energy differently.
How does roof pitch compare with the ideal tilt?
A pitched roof fixes the tilt, and a south-facing roof within about 10° of the best tilt loses about 1%. Convert a pitch to degrees with arctan(rise ÷ 12).
| Roof pitch | Tilt | Miami | Greensboro | Sand Point |
|---|---|---|---|---|
| 3 in 12 | 14.0° | 98.7% | 96.2% | 90.5% |
| 4 in 12 | 18.4° | 99.5% | 97.8% | 93.0% |
| 6 in 12 | 26.6° | 100.0% | 99.6% | 96.7% |
| 8 in 12 | 33.7° | 99.1% | 100.0% | 98.9% |
| 9 in 12 | 36.9° | 98.3% | 99.7% | 99.5% |
| 12 in 12 | 45.0° | 95.2% | 98.1% | 100.0% |
The table shows modelled sunlight as a share of each site’s best south-facing tilt. Every roof is due south. The best pitch rises with latitude, from about 6 in 12 at Miami to 12 in 12 at Sand Point.
Direction costs more on steeper planes. At Greensboro, an east or west plane loses 6.9% to 7.2% against south at 10° tilt, and 17.8% to 18.4% at 32°. See azimuth for direction, and TOF for how programmes score tilt and direction together. Shade can change the answer, so run a shading analysis before you choose.
Tilt loss calculator
Pick a site, then enter a tilt or a roof pitch and an azimuth. It returns the loss against the best south-facing tilt. It reads a model grid, so it is good to about 0.4 points and covers only these three sites.
If the frame does not load, open the tilt loss calculator on its own page.
How solar software handles tilt angle
PVsyst and PVGIS search for the best tilt. pvlib needs your own loop, and most design tools take tilt as a number you type.
| Software | Finds the best tilt? | Source |
|---|---|---|
| PVsyst | Yes | PVsyst 7 help, checked October 2026 |
| PVGIS | Yes | JRC user manual, checked October 2026 |
| pvlib python | Partly | pvlib documentation, checked October 2026 |
| HelioScope | Not stated | HelioScope help, updated 23 August 2026 |
| Aurora Solar | Not stated | Aurora help, updated 15 April 2026 |
Not stated means the company page we cite does not describe a tilt search. Partly means pvlib has the maths but no optimiser.
- PVsyst: Orientation optimization tool. Tools > Transposition factor runs 475 annual calculations over a grid of tilts and azimuths. Each curve is labelled with its loss against the optimum.
- PVGIS: The manual says PVGIS can calculate the slope giving the highest yearly output, and the optimum azimuth if asked. Azimuth 0° is south.
- pvlib python: get_total_irradiance takes surface tilt and azimuth and offers several sky models. The documentation page lists no tilt optimiser, so you write the loop, as we did.
- HelioScope: The Mechanical Layout article says to set the tilt of the modules for each field segment. It does not describe a tilt search.
- Aurora Solar: Selecting a roof face shows azimuth, pitch and slope. The article does not mention a tilt search.
For other tools, read the list of best solar simulation software and the list of best solar mounting structure design software.
Common mistakes with tilt angle
FAQs
What is the best tilt angle for solar panels?
At the three sites we modelled, the best tilt for south-facing fixed modules was below latitude: 25° at 25.8°N, 32° at 36.1°N and 44° at 55.3°N. RatedPower’s fixed-structure calculation recommends 0.85 times latitude above 20° latitude. That cost 0.1% or less at our three sites, but we did not test other sites, so it is a starting point only. Latitude, weather and azimuth all move it, so run a typical-year simulation for the real site.
Should tilt equal latitude?
Not exactly, though it is a fair start at low latitude. At 55.3°N it cost 1.4% against the best tilt, while 0.85 times latitude cost 0.1%. The difference is small, so roof pitch and shade often decide.
How much energy do you lose at the wrong tilt?
About 1.1% to 1.2% for 10° off and 4.3% to 4.8% for 20° off. Flat modules lost 7.1% to 20.1%. These are modelled sunlight losses at three sites, before shade.
Is a low-pitch roof a problem for solar?
Not at low latitude. A 3 in 12 roof (14.0°) kept 98.7% of the best sunlight at Miami and 90.5% at Sand Point. Direction and shade also matter.
Do I need to change tilt by season?
Not on sunlight alone, going by three modelled sites: two settings a year added only 3.4% to 4.0% of sunlight on paper. Adjustable mounts add cost, labour and safety work, which we did not price, so run those numbers before deciding.
Related terms
- Azimuth: the compass direction a plane faces.
- TOF (tilt and orientation factor): sunlight at your tilt and azimuth against the ideal.
- Single-axis tracker: a mount that rotates the array about one axis.
- Ground-mount design: tilt, row spacing and foundations on land.
- Shading analysis: the loss from obstructions at a given tilt and direction.
Next step: check your roof pitch against the table above. Then confirm the best tilt for your site with the best solar simulation software. For mounting tools, see the best solar mounting structure design software.
Sources
- Method and rules. PVEducation, solar radiation on a tilted surface (checked October 2026). RatedPower, how PV panel tilt affects plant performance (updated 20 April 2022). Sunrun, best angle for solar panels (last updated 18 February 2026, checked October 2026). Nicolás-Martín et al., a global annual optimum tilt angle model (Renewable Energy 161, 722 to 735, December 2020, abstract only, checked 30 October 2026 on RePEc).
- Software, checked October 2026. PVsyst 7 help, orientation optimization. PVGIS user manual. pvlib get_total_irradiance. HelioScope, Mechanical Layout. Aurora, How to View Roof Face Characteristics.
- Weather data. NREL manuals for TMY3 (1976 to 2005 or 1991 to 2005 base period, by station) and TMY2 (1961 to 1990). Files: 12839.tm2, 723170TYA.CSV and 703165TY.csv from the pvlib package. Our numbers are modelled with pvlib 0.16.1, not measured.
Last updated 30 October 2026. Next scheduled review: 30 January 2027.