Key takeaways
- South is 180° in pvlib and HelioScope, and 0° in PVGIS. East is 90° in the compass tools and -90° in PVGIS.
- Pasting a PVGIS 0 into a compass tool points the array at the pole. That lost 24.2% to 33.3% of annual clear-sky sunlight at 20° tilt in our runs.
- On clear sky at three sites, 30° off equator-facing lost 1.4% to 2.1% at 20° tilt and 2.0% to 3.0% at 40° tilt.
- Facing east or west lost 11.2% to 15.6% at 20° and 17.1% to 24.1% at 40°. Typical-year files gave less: 8.5% to 13.1% at 20°.
- An east-west split costs the average of its two sides, and its highest hour was 91 to 94% of an equator-facing array’s at 20° tilt.
Moving azimuth between PVGIS, pvlib and a compass? Use the free converter below. To take roof azimuth from imagery in software, see best solar roof measurement software.
Azimuth at a glance
Azimuth is one number in degrees, and its zero point changes with the tool.
| Item | Detail |
|---|---|
| Formula | Compass bearing = PVGIS azimuth + 180, wrapped to 0 to 360. Counterclockwise from north = minus the compass bearing, wrapped to -180 to 180. |
| Unit and range | Degrees. Compass bearing 0 to 360. PVGIS and Solcast -180 to 180. |
| Where it matters | Yield simulations, roof-plane choice and data moved between tools. |
| Standard or rule | No single standard. Each tool sets its own zero (see the software table). |
| In software | Design tools read it from each roof face. Simulation tools take it as an input. |
Why azimuth matters for installers
Azimuth decides which hours a module collects sunlight and how much it collects over a year. A direction pointing at the pole lost 24.2% to 33.3% of annual clear-sky sunlight at 20° tilt in our runs (Table 1).
Roof azimuth often moves from a roof measurement tool into a design tool. Check the convention at that hand-off.
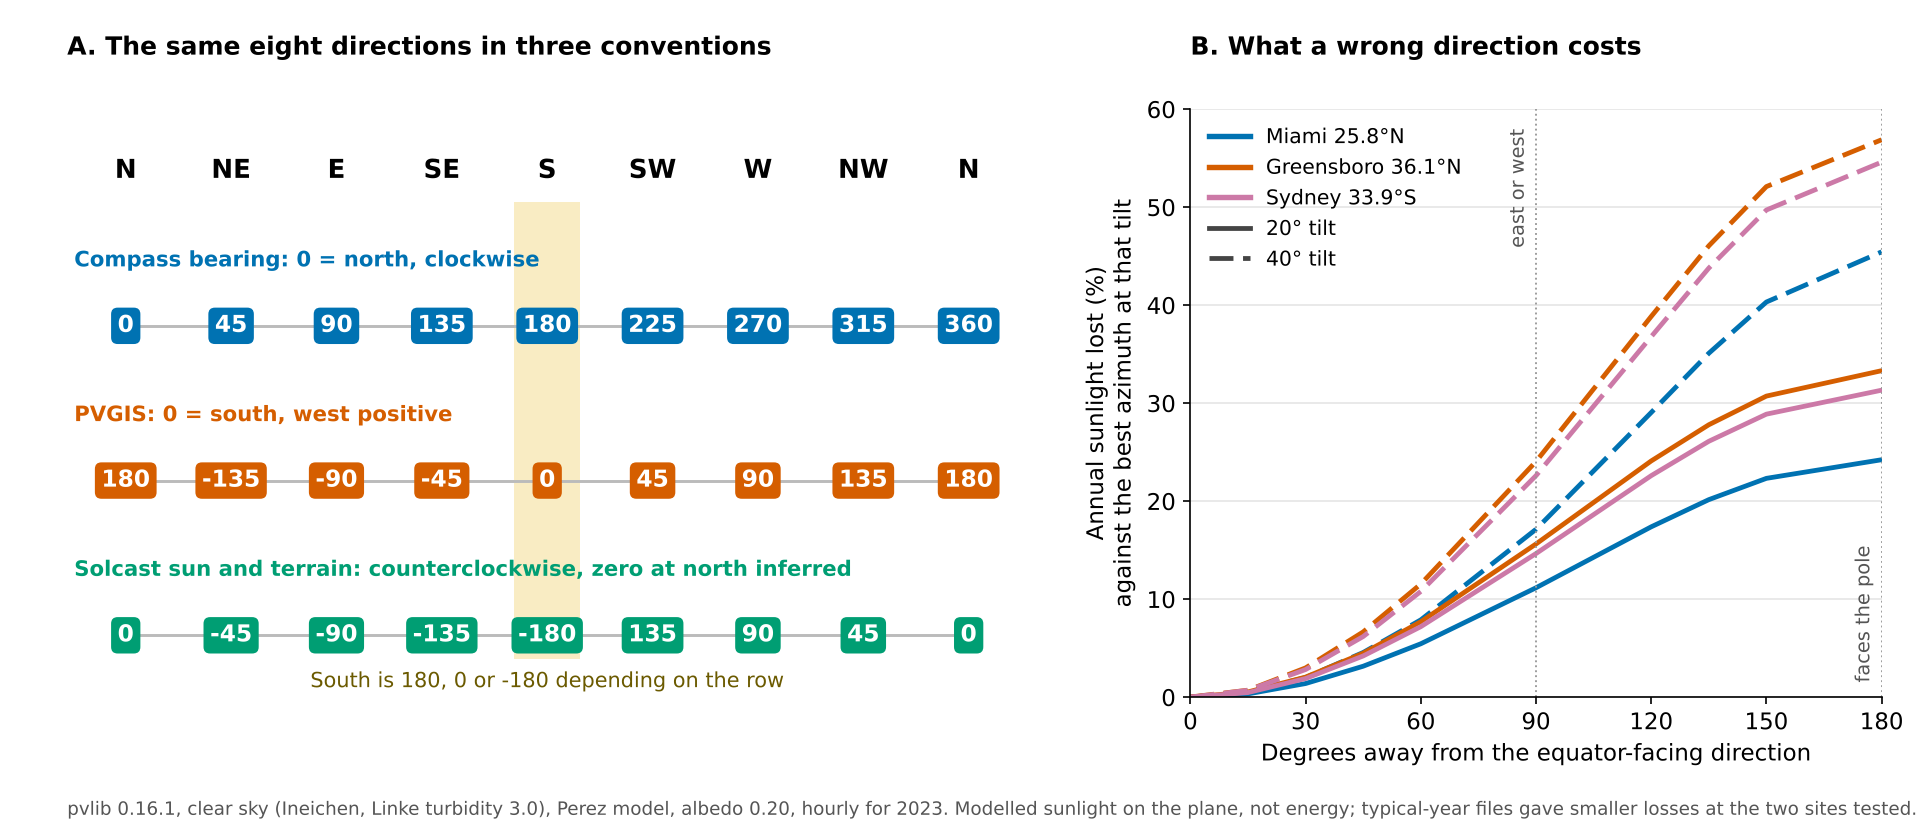
Figure 1. South is 180, 0 or -180 depending on the tool, and facing east or west instead costs 11.2% to 24.1% of annual clear-sky sunlight at 20° to 40° tilt.
Which number means south? Azimuth conventions compared
South is 180 on a compass bearing, 0 in PVGIS and -180 on one Solcast page. East and west also change sign between tools.
| Direction | Compass bearing | PVGIS |
|---|---|---|
| North | 0 | 180 (or -180) |
| East | 90 | -90 |
| South | 180 | 0 |
| West | 270 | 90 |
The conventions by source:
- Compass bearing: pvlib defines surface azimuth as "North=0, East=90, South=180, West=270". HelioScope and the Google Solar API use the same numbers.
- PVGIS: its API gives "0=south, 90=west, -90=east". Solcast’s terrain values give the same east (-90) and west (90) as PVGIS, but zero is south in PVGIS and north in Solcast.
- Solcast: one page says its sun azimuth increases counterclockwise, so 90° is west. Another gives terrain azimuth as "South is -180, East is -90, North is 0 & West is 90". Both describe the sun or the ground, not the array.
- Hemisphere: the best direction faces the equator. That is south in the north and north in the south. In Sydney our best clear-sky azimuth was within 1° of north. HelioScope’s help says southern projects face 0° and that PVsyst differs: "0º is always oriented towards the equator". We found no PVsyst page that states this, so a bare 0 can mean north or south.
- True or magnetic north: a phone or hand compass reads magnetic north. Solmetric’s orientation note says to enter true azimuth, not magnetic.
How to convert between azimuth conventions
Convert through the compass bearing. To get it, add 180 to a PVGIS value or negate a counterclockwise value.
- Find the tool’s zero point and its direction of increase in its documentation.
- Convert to a compass bearing. PVGIS: add 180. Counterclockwise from north: multiply by -1. Then wrap into 0 to 360.
- Convert from the compass bearing to the target. PVGIS: subtract 180, so north is 180 (or -180). Counterclockwise: multiply by -1 and wrap into -180 to 180.
- Test with a south roof and an east roof. In the northern hemisphere, the east roof should peak in the morning.
Example: PVGIS -90 is east, and -90 + 180 = 90 on a compass bearing. A compass bearing of 225° (south-west) is 225 - 180 = 45° in PVGIS.
Azimuth convention converter
The converter turns any convention into the other two and rejects out-of-range values. It adds an equator-facing check if you enter a latitude.
How much energy do you lose off south? Worked example
At three sites, 30° off equator-facing cost 1.4% to 3.0% of annual clear-sky sunlight. East or west cost 11.2% to 24.1%.
We modelled Miami (25.8°N), Greensboro (36.1°N) and Sydney (33.9°S) with pvlib 0.16.1. The runs use clear sky, hourly for 2023, a fixed Linke turbidity of 3.0 and the Perez sky model. Sydney is clear-sky only, because pvlib ships no typical-year file for it. Loss is annual sunlight on the plane against the best azimuth at the same tilt, not energy. Tilt is fixed at 20° and 40°. The tilt angle page covers the tilt sweep.
Loss stays small to about 30° off, then climbs. Facing the pole loses a quarter to over half.
Table 1. Clear-sky loss against the best azimuth, mean of the two sides, at 20° tilt and 40° tilt (shown as 20° / 40°).
| Degrees from equator-facing | Miami | Greensboro | Sydney |
|---|---|---|---|
| 15 | 0.3% / 0.6% | 0.5% / 0.7% | 0.5% / 0.7% |
| 30 | 1.4% / 2.0% | 2.1% / 3.0% | 1.9% / 2.8% |
| 45 | 3.2% / 4.6% | 4.5% / 6.7% | 4.2% / 6.2% |
| 60 | 5.5% / 7.9% | 7.7% / 11.5% | 7.2% / 10.8% |
| 90 (east or west) | 11.2% / 17.1% | 15.6% / 24.1% | 14.7% / 22.6% |
| 135 | 20.2% / 35.1% | 27.8% / 46.1% | 26.1% / 43.8% |
| 180 (faces the pole) | 24.2% / 45.4% | 33.3% / 56.9% | 31.3% / 54.6% |
The best clear-sky azimuth was 178° to 181° at the two northern sites and within 1° of north at Sydney. Facing the pole at 40° lost 45.4% or more at every site.
Clear sky overstates the penalty. In the two typical-year files, diffuse light is 44% to 45% of annual horizontal sunlight. Diffuse light alone lost only 1.0% to 1.5% facing east or west at 20°. The typical-year losses were smaller, and the two sides differed.
Table 2. Loss when facing east (90°) or west (270°), against the best azimuth at the same tilt.
| Site and tilt | East, typical year | West, typical year | Clear sky, mean |
|---|---|---|---|
| Miami 20° | 8.5% | 10.5% | 11.2% |
| Miami 40° | 13.7% | 17.1% | 17.1% |
| Greensboro 20° | 13.1% | 12.6% | 15.6% |
| Greensboro 40° | 21.1% | 20.3% | 24.1% |
In Miami’s file, west lost 2.0 points more than east at 20° and 3.4 points more at 40°. Swapping them would change a result. The cause was not tested. Its best typical-year azimuth was 173°, east of south. Greensboro’s was 181°.
Counting energy instead of sunlight (cell temperature, reflection, and a -0.35 %/K coefficient we assumed) moved these typical-year losses by at most 0.3 points. Near the equator the rule fails. At 20° tilt on clear sky, the gap between best and worst direction was 4.9% of annual sunlight at 5° latitude and 1.0% at the equator.
How does an east-west split compare with south?
A split loses the average of its two sides against an equator-facing array at the same tilt. Its highest hour is lower.
Table 3. East-west split (half the modules east, half west) against an equator-facing array at the same tilt, as loss per module. The last column is the highest hour on clear sky, against an equator-facing array.
| Tilt | Miami, typical year | Greensboro, typical year | Highest hour, share of equator-facing (clear sky, range across three sites) |
|---|---|---|---|
| 5° | 2.7% | 3.7% | 98 to 99% |
| 15° | 7.4% | 10.1% | 94 to 96% |
| 20° | 9.5% | 12.8% | 91 to 94% |
| 40° | 15.3% | 20.7% | 76 to 81% |
In the typical-year files the split cost 2.7% to 3.7% at 5° and 15.3% to 20.7% at 40°. Table 2 uses the best azimuth as baseline, so Tables 2 and 3 differ by up to 0.1 points. The peak falls because the two sides reach their best hours at different times. The case for an east-west layout rests on roof area, a flatter day and a lower peak. This table does not price those. See row spacing and pitch, self-consumption, and MPPT for how to string two orientations.
How did we test the directions?
We checked direction, hemisphere and convention three ways before trusting the tables.
- Geometry: we wrote our own sun-and-module geometry for each convention. It matched pvlib’s angle of incidence on 2,757 sun-up samples from latitude -60 to 60. The largest gap in cos(aoi) was 0.0087.
- Noon sun: it stood south of the zenith on 100% of days at Greensboro and 100% at Miami. It stood north on 100% at Sydney. At 1.35°N it was south on 51%.
- Mirror: 36.1°N and 36.1°S gave best azimuths of 180° and 0°, with loss curves within 0.05 points.
How solar software handles azimuth
Three of the six tools below state their zero point and direction of increase in full, two do so in part and one does not. That gap is why every hand-off needs a convention check.
Yes: the page gives the zero point and direction. Partly: it gives some of the convention but not all. Not stated: the page we cite does not say.
| Software | States its azimuth convention? |
|---|---|
| PVsyst | Not stated |
| PVGIS | Yes |
| pvlib python | Yes |
| HelioScope | Yes |
| Aurora Solar | Partly |
| Solcast | Partly |
What each page says, and the source read:
- PVsyst. The plane orientation pages read do not give the sign convention. HelioScope’s help says PVsyst’s 0° is "always oriented towards the equator", but we could not confirm that on PVsyst’s own pages. Source, read October 2026: PVsyst 7 help on orientation, orientation optimisation and project design (undated).
- PVGIS. Aspect is "0=south, 90=west, -90=east". The user manual gives the same values. Both read as geographic south in either hemisphere, but the pages do not say so. Source, read October 2026: PVGIS API page and user manual (undated).
- pvlib python. Surface azimuth: North=0, East=90, South=180, West=270. Since version 0.10.0, get_pvgis_hourly takes this convention. Its docs note that PVGIS’s own convention is offset 180°. Source, read October 2026: pvlib docs (0.16.2 development page) and the installed 0.16.1 docstring.
- HelioScope. 0° north, 90° east, 180° south, 270° west. Southern projects face 0°. It says PVsyst differs. Source, read 30 October 2026, no date shown: International Design Considerations.
- Aurora Solar. The AutoDesigner API changelog says 0 is north and 180 is south for its azimuth range. The page read does not cover the app’s help. Source, last modified 3 September 2026 (checked 30 October 2026): Aurora developer changelog.
- Solcast. Sun azimuth increases counterclockwise (90° is west). Terrain azimuth: south -180, east -90, north 0, west 90. The pages read do not cover its array settings. Source, read October 2026: Solcast knowledge base, two undated pages.
Ranked options are in best solar design and proposal software, best solar roof measurement software and best solar simulation software.
Common mistakes with azimuth
FAQs
What is the best azimuth for solar panels?
Face the equator: about 180° on a compass in the northern hemisphere and about 0° in the southern. Our clear-sky sweeps found 178° to 181° at the northern sites and within 1° of north at Sydney. A typical-year file for Miami preferred 173°, a few degrees east of south. We did not test why.
Is south 0 or 180 degrees?
Both, depending on the tool. A compass bearing puts south at 180. PVGIS puts it at 0, and one Solcast page puts it at -180. Check the documentation, then test with a roof you know.
How many degrees off south is acceptable?
In our clear-sky runs, 15° off cost 0.3% to 0.7% and 30° off cost 1.4% to 3.0%. Solmetric’s orientation note puts a 30° miss at about 5%, which is higher than we modelled. Shade and roof area often matter more than a few degrees.
Are east-west panels worth it?
They can be, where roof area, a flatter day or self-consumption matters more than yield per module. Per module they lose 11.2% to 15.6% against equator-facing at 20° tilt on clear sky, and their highest hour is lower.
Which way should panels face in the southern hemisphere?
Face north, toward the equator. Sydney’s best clear-sky azimuth was within 1° of north, and facing south there lost 31% at 20° tilt and 55% at 40°.
Related terms
- Tilt angle: the angle between the module and the horizontal.
- TOF (tilt and orientation factor): sunlight at your tilt and azimuth against the ideal.
- Solar zenith and incidence angle: the sun’s height and the angle at which it meets the module.
- Sun path diagram: a chart of the sun’s azimuth and height through the year.
- Roof measurement: taking roof area, pitch and azimuth from imagery or on site.
Next step: before importing roof azimuths, test one south and one east roof in the converter above. Then pick a tool that states its zero point from the best solar design and proposal software list.
Sources
Quotes from web pages opened October 2026 are close paraphrase. The pvlib docstring came from the installed package.
- Conventions. pvlib FixedMount. pvlib get_pvgis_hourly, version 0.9.0 page. pvlib 0.16.1 get_pvgis_hourly docstring (installed package). PVGIS API and PVGIS user manual. HelioScope, International Design Considerations. Aurora, AutoDesigner API azimuth range. Solcast: solar azimuth and terrain slope and azimuth. Google Solar API, RoofSegmentSummary.
- PVsyst 7 help. Plane orientation, orientation optimisation and project design.
- Compass practice. Solmetric, Orientation and the Solmetric SunEye (undated, its references are dated 2009).
- Weather files 12839.tm2 (Miami) and 723170TYA.CSV (Greensboro) ship with pvlib. Our numbers are modelled, not measured.
Last updated 30 October 2026. Next scheduled review: 30 January 2027.