Solar thermal inspection software reads heat images of solar panels and turns them into a fault report. Sitemark ranks first on this list, at 81.8/100.
We ranked 7 tools out of 10 scored. Scopito is the one solar tool with a published price, at EUR 20 per MW (megawatt of plant size). Most of the others ask you to request a price.
What does this page rank?
This page ranks software that reviews thermal images and writes the report. A thermal image is only useful once someone has read it. Each fault needs a type, a place on the plant and an energy cost. Then it goes into a report that a technician or warranty manager can act on.
We do not rank how the images are captured. Flight planning, docked drones and orthomosaic (stitched photo map) processing are on our companion page, best solar drone inspection software.
We found only six products that check thermal images for solar faults. The seventh ranked tool is DJI’s general software. General thermal tools such as FLIR Thermal Studio and Pix4D measure temperatures but do not classify solar faults. So they sit in Also considered.
The IEC 62446-3 gap: IEC 62446-3 is the standard for thermal imaging of PV plants. We found no fault classes from it on the company pages we checked. Several tools classify hotspots, string faults, diodes and PID (potential-induced degradation). None we checked says its classes or reports follow the standard. Lenders, insurers and O&M (operations and maintenance) contracts can name the standard. If yours does, ask for a sample report before you buy.
Once faults are found, the repair loop belongs to solar O&M software. Plant-wide operations belong to solar farm management software. This page sits in our aerial and thermal inspection category.
Quick picks: best solar thermal inspection software
Rank | Product | Best for | Starting price (company page, checked October 2026) | Free plan / trial | Score /100 |
|---|---|---|---|---|---|
1 | Anomalies ranked by severity and production loss | Quote only | Demo only | 81.8 | |
2 | Per-annotation temperatures and GPS reports at a published per-MW rate | ✓ EUR 20 per MW inspected | 14-day trial. EUR 0 per MW self-analysis tier | 75.3 | |
3 | Loss quantification and OEM warranty evidence | Quote only | Demo only | 68.5 | |
4 | AI plus analyst review delivered as a service | Quote only | Demo only | 66.0 | |
5 | Thermal defects tied to construction QA | Quote only | Demo only | 64.0 | |
6 | Thermography plus module test data in one record | Quote only | Demo (unconfirmed) | 64.0 | |
7 | DJI Thermal Analysis Tool + FlightHub 2 (general drone software) | Free temperature measurement on DJI radiometric images | ✓ Free (thermal tool) | Free thermal tool | 61.3 |
✓ Verified on the company’s own pricing page. ◐ Published by the company outside its pricing page (help centre, store or press release). ? We could not read the company’s pricing page, so the figure is not confirmed. Prices checked October 2026.
Quote only means the company shows no public price. You ask it for a quote.
How the 7 tools scored
- Use-case fit 35%
- User reviews 20%
- Pricing 15%
- Ease of use 10%
- Support 10%
- Momentum 10%
Tool | Score chart | Score |
|---|---|---|
81.8 out of 100 | 81.8 | |
75.3 out of 100 | 75.3 | |
68.5 out of 100 | 68.5 | |
66 out of 100 | 66.0 | |
64 out of 100 | 64.0 | |
64 out of 100 | 64.0 | |
DJI Thermal Analysis Tool + Flight | 61.3 out of 100 | 61.3 |
Each bar shows the weighted score out of 100. Tools marked (general) are general tools that are not solar-specific.
Sub-scores at a glance (0-10)
Product | Use-case fit | User reviews | Pricing | Ease of use | Support | Momentum | Total /100 |
|---|---|---|---|---|---|---|---|
10.0 | 7.9 | 4.0 | 10.0 | 10.0 | 5.0 | 81.8 | |
10.0 | 7.4 | 7.0 | 5.0 | 5.0 | 5.0 | 75.3 | |
10.0 | 5.0 | 4.0 | 5.0 | 5.0 | 7.5 | 68.5 | |
10.0 | 5.0 | 4.0 | 5.0 | 2.5 | 7.5 | 66.0 | |
10.0 | 5.0 | 4.0 | 5.0 | 5.0 | 3.0 | 64.0 | |
10.0 | 5.0 | 4.0 | 5.0 | 5.0 | 3.0 | 64.0 | |
DJI Thermal Analysis Tool + Flight | 6.7 | 5.0 | 7.0 | 5.0 | 5.0 | 7.5 | 61.3 |
A 5.0 on reviews, ease, support or momentum is our neutral score. We use it when public evidence is thin. It is not a judgement.
How did we rank these thermal inspection tools?
How the score is weighted
- Use-case fit 35%
- User reviews 20%
- Pricing 15%
- Ease of use 10%
- Support 10%
- Momentum 10%
We considered and scored 10 products from 22 to 25 October 2026. We ranked 7 and put 3 under Also considered. We used company documents, pricing pages, trade press and public user reviews. This was desk research. We did not process a thermal dataset in any tool. We scored each product on six tests:
- Use-case fit (35%): How well it does this page’s job. Solar thermal checks we can see documented count most: fault types, severity, temperature data and reports. The work steps around them come next.
- User reviews (20%): G2 and Capterra ratings. Ratings based on only a few reviews count for less, and most tools here have few or none.
- Pricing (15%): Published prices score higher than prices you must ask for.
- Ease of use, support and momentum (10% each): Review sub-scores and dated release notes. Each gets a middle score without evidence.
Products below our minimum match score (4 out of 10) go to "Also considered". Products whose core facts we could not confirm on the company’s site lose 2 points. Service-led companies are scored on their software only. SurgePV is not part of this ranking. Read the full method: how we score software.
What should good thermal analysis software give you?
- Classification: Each fault gets a type (hotspot, string, diode, PID), not just a "hot" mark.
- Measured temperature: Values read from radiometric images (thermal images that store a temperature for each pixel), not a colour scale.
- Severity and loss: A ranking by kW or revenue, so crews fix the worst first.
- Location: GPS or map position down to the module.
- Report and handoff: PDF or CSV export and a route into work orders.
1. Sitemark: best for anomalies ranked by severity and production loss
Best for: O&M providers and asset owners who want a ranked fault list, not a folder of images. Score: 81.8/100.
What it is: Sitemark is a drone inspection and work platform from Sitemark NV in Leuven, Belgium. It runs AI fault detection on thermal and visual drone images. EPCs (engineering, procurement and construction firms), O&M providers and asset owners use it.
Why we picked it: It ranks each fault by severity and estimated production loss, so crews know what to fix first. It also has the largest review base of the solar tools here, at G2 4.9/5 from 30 reviews.
Key features:
- Thermal and visual anomaly detection, including MC4 (standard PV connector) faults, cracking and soiling.
- Ranking by severity and estimated production loss.
- Trend tracking across inspections.
- Stakeholder reporting that packages results for owners.
- Forms and ticketing to act on findings.
Pricing: Quote only (you have to ask the company for a price). It is based on the number of sites and other factors. Checked October 2026 on the Sitemark pricing page.
Pros (from user reviews):
- Users name fault detection and thermal checks as strengths (Capterra).
- Technicians and managers work in the same interface.
- Support answers quickly.
Cons (from user reviews):
- You cannot download thermal orthomosaic images.
- A minimum package must be used within a year.
- Expensive for start-up inspection businesses.
Reviews: G2 4.9/5 (30 reviews) and Capterra 5.0/5 (5 reviews), checked October 2026.

Want to see Sitemark working? Book a demo with the SolarSoftwares team.
Book a demoYour request goes by email to the SolarSoftwares team. A time is set only after we reply. It does not change any score or ranking.
2. Scopito: best for per-annotation temperatures and GPS reports at a published per-MW rate
Best for: Drone inspection providers and O&M teams who want to check each fault themselves and hand clients a report. Score: 75.3/100.
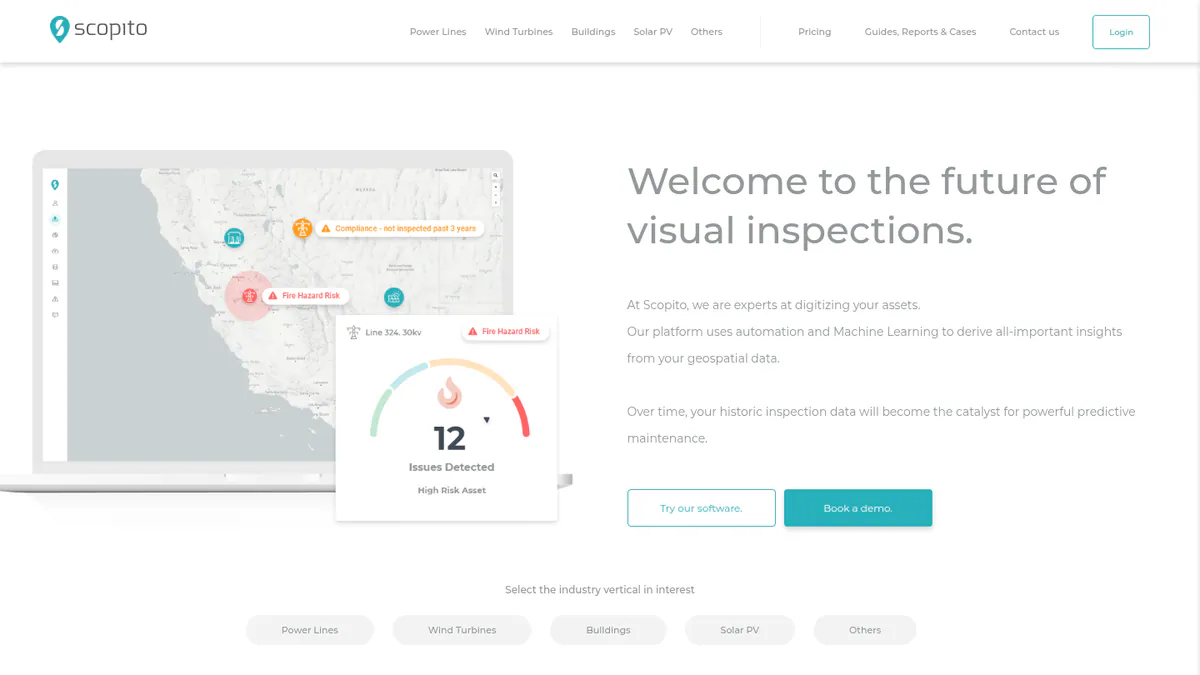
What it is: Scopito is a cloud platform from Scopito ApS in Denmark. It analyses drone images of PV plants. Its viewer shows RGB (normal colour) and thermal images side by side, with a temperature for each annotation. Asset owners, O&M teams and drone inspection providers use it.
Why we picked it: It gives a temperature for each annotation and reports with GPS locations, which is what a client report needs. It is also the one solar tool here with a published per-MW price.
Key features:
- Classes for hot spots, string, diode, PID and backsheet faults, with severity.
- The AI pre-marks faults, and Scopito’s own experts can review them.
- Temperature reading per annotation in a side-by-side RGB and thermal viewer.
- PDF and CSV reports with GPS locations of faulty panels.
- Client approval workflows and a link to SAP work orders.
Pricing: Software is EUR 20 per MW inspected, with unlimited upload. Self-analysis is EUR 0 per MW (limits not stated). Full service is EUR 65 per MW with a 10 MW minimum. Enterprise is quote only, and white label (your brand on their tool) starts at EUR 15,000. There is a 14-day trial. Checked October 2026 on the Scopito solar page.
Pros (from our research):
- It is the only solar-specific tool here with published software pricing, so you can cost a job upfront.
- You can add human expert review on top of the AI when a client needs it.
- CSV output feeds your own CMMS (maintenance software) or spreadsheets.
Cons (from our research):
- It documents severity, not loss in kW or revenue.
- Full service needs a 10 MW minimum.
- White label starts at EUR 15,000, a big step up from the per-MW plan.
Reviews: G2 4.9/5 (23 reviews), checked October 2026. The Capterra listing has no reviews.
What we could not confirm: which drones and cameras it supports, and the limits of the free self-analysis tier.
Want to see Scopito working? Book a demo with the SolarSoftwares team.
Book a demoYour request goes by email to the SolarSoftwares team. A time is set only after we reply. It does not change any score or ranking.
3. Raptor Maps: best for loss quantification and OEM warranty evidence
Best for: Utility-scale owners and asset managers who need a power and money figure on each fault. Score: 68.5/100.
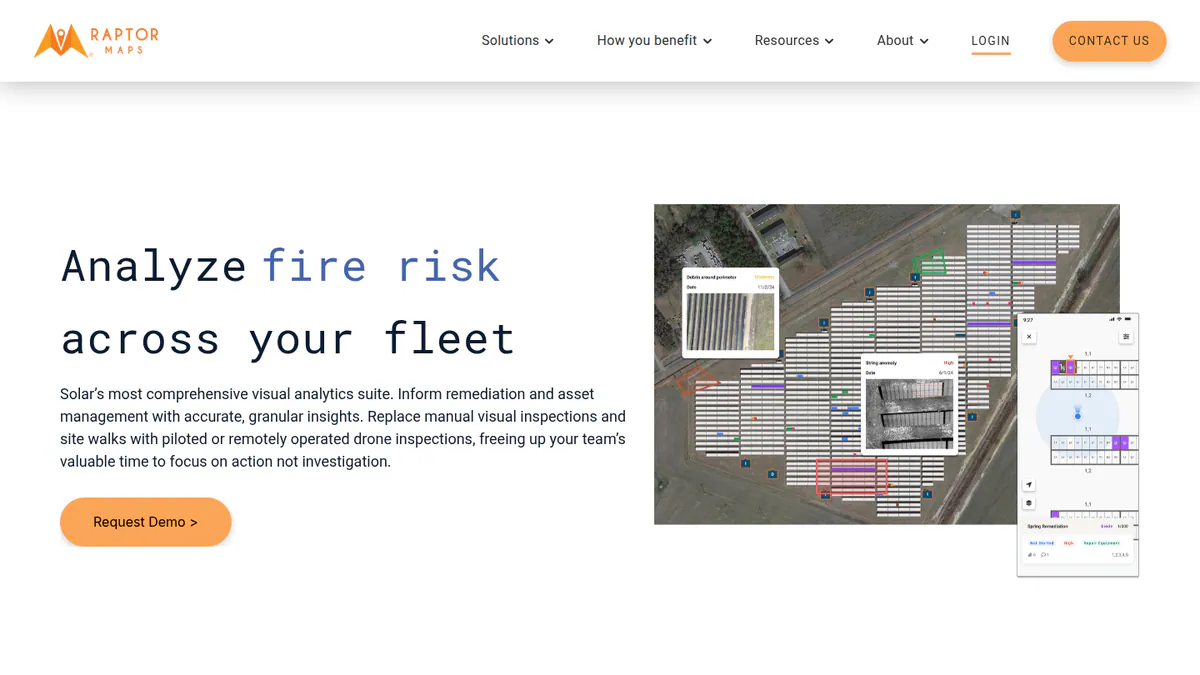
What it is: Raptor Maps is a solar digital-twin and inspection platform from Raptor Maps, Inc. in Boston. It puts a power and money loss on each thermal fault. Utility-scale owners, asset managers, O&M teams and EPCs use it.
Why we picked it: It puts a power and money figure on each fault and adjusts thermography to standard test conditions. That turns a hotspot list into evidence for a warranty claim.
Key features:
- Power and financial loss per fault.
- Benchmarking against a global anomaly database, with degradation tracked over time.
- STC-normalised thermography (adjusted to standard test conditions) for OEM (module maker) warranty claims.
- A field app that guides technicians to the fault by GPS.
- API, SCADA (plant control system) and DAS (data logger) data beside thermal results.
Pricing: Quote only. Trade press in 2021 described a subscription with unlimited inspection reports from any source. Checked October 2026 on the Raptor Maps website.
Pros (from our research):
- Loss figures help justify truck rolls.
- Its warranty-claim thermography gives you evidence to take to the module maker.
- You can load reports from other providers, so you keep your history if you switch.
Cons (from our research):
- No published pricing.
- It is a platform, which is a lot if you only need a one-off report on a few sites.
- Too few reviews to judge it: none on G2 or Capterra.
Reviews: App Store 4.8/5 (5 ratings) for the field app, checked October 2026.
Read our full Raptor Maps review.
Want to see Raptor Maps working? Book a demo with the SolarSoftwares team.
Book a demoYour request goes by email to the SolarSoftwares team. A time is set only after we reply. It does not change any score or ranking.
4. Zeitview (service with software): best for AI plus analyst review delivered as a service
Best for: Owners who want the inspection firm to read the images and post findings to a portfolio tool. Score: 66.0/100.
What it is: Zeitview, Inc. is mainly an aerial inspection service, based in Santa Monica, US. It mixes machine vision with checks by its own analysts. Results go into its Asset Insights software for owners, EPCs and O&M teams.
Why we picked it: Its analysts check the AI’s findings, so you get reviewed results without a thermographer on staff. Each finding then sits in Asset Insights with repair tracking.
Key features:
- String outage, hotspot and PID detection.
- Analyst review of AI findings.
- Severity and repair tracking in Asset Insights.
- Warranty-claim support, plus shading and tracker analysis.
- API access to inspection data.
Pricing: Quote only, demo only. Checked October 2026 on the Zeitview solar page.
Pros (from our research):
- The company reads the images for you, so you need no in-house thermographer.
- Repair status is tracked per finding.
- It has a long track record: the company reports 600 GW of PV inspected.
Cons (from user reviews):
- A customer lost confidence in service quality (Trustpilot).
- A former customer found too many points of contact.
- Subcontracted pilots report pay disputes, which may affect consistency.
Reviews: Trustpilot 2.6/5 (4 reviews), checked October 2026. No G2 reviews.
Want to see Zeitview (service with software) working? Book a demo with the SolarSoftwares team.
Book a demoYour request goes by email to the SolarSoftwares team. A time is set only after we reply. It does not change any score or ranking.
5. SenseHawk (TaskMapper / Therm): best for thermal defects tied to construction QA
Best for: EPCs and developers who want thermal findings on the same map as punch lists and QA forms. Score: 64.0/100.
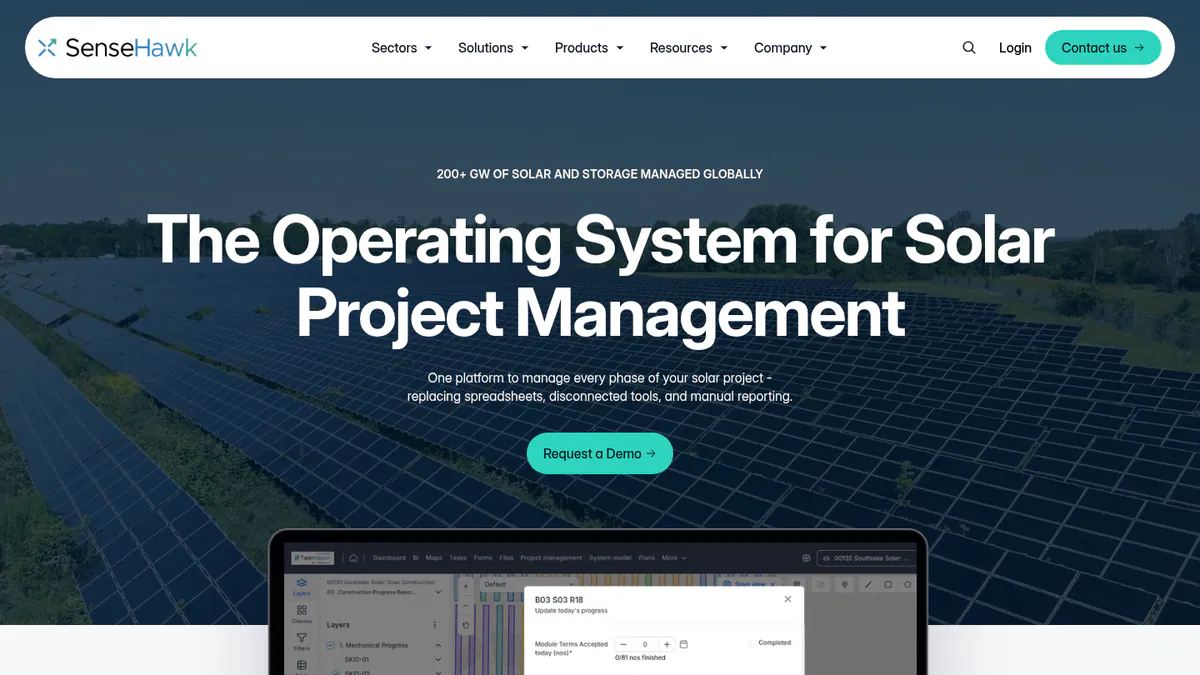
What it is: SenseHawk, Inc. makes a solar digital-twin platform for developers, EPCs and O&M teams. Its Therm module analyses drone visual and thermal scans. It marks defects on the plant map, next to TaskMapper’s construction and QA (quality assurance) records. We could not reach sensehawk.com. So its features here come from G2 company text and the SoftwareOne marketplace.
Why we picked it: Thermal defects land on the same map as construction QA and punch lists, so they turn into tasks straight away.
Key features:
- Thermal and visual scan analytics with defect locations.
- Defects on a GIS (mapping) layer with design and terrain.
- Non-conformance and punch-list workflows.
- Web and mobile tasks for follow-up.
Pricing: Quote only, per the SoftwareOne listing, checked October 2026.
Pros (from our research):
- Thermal defects become QA tasks directly, with no re-keying.
- It helps at commissioning and handover, when punch lists matter most.
- The marketplace listing says it is ISO 27001 (information security standard) certified.
Cons (from our research):
- It is built around construction QA, not detailed reports for operating plants.
- Quote only, with no published prices.
- Too few reviews to judge it: 4 on G2 across two listings.
Reviews: G2 4.8/5 for TaskMapper (2 reviews) and 4.5/5 for SenseHawk (2 reviews), checked October 2026.
What we could not confirm: how deep its fault classes go, and its report formats.
Want to see SenseHawk (TaskMapper / Therm) working? Book a demo with the SolarSoftwares team.
Book a demoYour request goes by email to the SolarSoftwares team. A time is set only after we reply. It does not change any score or ranking.
6. Above Surveying (SolarGain): best for thermography plus module test data in one record (service-led)
Best for: Utility-scale owners in the UK and Europe who buy thermography as a service and want results beside module quality data. Score: 64.0/100.
What it is: Above Surveying Ltd is a UK drone inspection firm based in Colchester. It flies aerial thermal inspections and stores results in SolarGain, its digital-twin platform. Utility-scale owners, EPCs and O&M teams use it. We could not open abovesurveying.com. So facts come from its Intersolar listing, pv magazine and the App Store.
Why we picked it: SolarGain keeps thermal findings next to module test data from Kiwa PI Berlin and 2DegreesKelvin. It also accepts flight data from other pilots.
Key features:
- Aerial thermography inspections (service).
- SolarGain digital twin that stores thermal and inspection data.
- Module quality data via Kiwa PI Berlin and 2DegreesKelvin since December 2024. A thermal finding can sit next to lab or field test results.
- SolarGain Mobile for onsite tasks and serial scanning.
Pricing: No published prices for services or SolarGain. Checked October 2026.
Pros (from our research):
- Thermal and module test data sit in one record, so you see both in one place.
- It accepts third-party flight data, so you can use other pilots.
- One supplier handles capture and platform.
Cons (from our research):
- It is service-led, built around Above’s own inspections.
- No published prices for services or software.
- No user reviews to judge it.
Reviews: No G2 or Capterra reviews as of October 2026.
What we could not confirm: whether SolarGain is sold without Above’s services.
Want to see Above Surveying (SolarGain) working? Book a demo with the SolarSoftwares team.
Book a demoYour request goes by email to the SolarSoftwares team. A time is set only after we reply. It does not change any score or ranking.
7. DJI Thermal Analysis Tool + FlightHub 2 (general drone software): best for free temperature measurement on DJI radiometric images
Best for: Small O&M teams flying DJI thermal drones who need measured temperatures and a basic report without a subscription. Score: 61.3/100.
What it is: DJI Thermal Analysis Tool 3 is a free Windows app from DJI for its radiometric images. It is not solar software. FlightHub 2 is DJI’s cloud tool for managing drone fleets and docks.
Why we picked it: It measures temperatures on DJI radiometric images at no cost. Batch correction and branded per-image reports cover the basics for a small team.
Key features:
- Spot, line and area temperature measurement.
- Batch correction of emissivity (how strongly a surface gives off heat), humidity, distance and reflected temperature.
- PDF or DOC per-image reports with your logo.
- FlightHub 2 object detection and Analyzer reports.
Pricing: Thermal Analysis Tool 3 is free (Windows 64-bit, DJI cameras only). FlightHub 2 Enterprise is USD 3,280 per device per year on the DJI Store. Checked October 2026.
Pros (from our research):
- It is free, so a small team can start with no subscription.
- Batch correction across many images saves time on large sets.
- It is still updated: version 3.6.0 came out in December 2025.
Cons (from our research):
- No solar fault classes. DJI points users to third-party software for automated defect detection.
- DJI cameras and Windows only.
- Per-image reports, with no plant map or plant-level fault list.
Reviews: No G2 or Capterra reviews as of October 2026.
Want to see DJI Thermal Analysis Tool + FlightHub 2 (general drone software) working? Book a demo with the SolarSoftwares team.
Book a demoYour request goes by email to the SolarSoftwares team. A time is set only after we reply. It does not change any score or ranking.
How do the thermal inspection tools compare?
Product | Anomaly classification | Temperature per anomaly | Severity or loss | Report output | Work-order handoff | IEC 62446-3 documented | Starting price |
|---|---|---|---|---|---|---|---|
AI, thermal and visual | Not documented | Severity and production loss | Stakeholder reports | Forms and ticketing | Not found | Quote only | |
Hot spot, string, diode, PID, backsheet | Yes | Severity | PDF, CSV with GPS | SAP | Not found | EUR 20/MW | |
AI, benchmarked | STC-normalised thermography | Power and financial loss | Inspection reports | Field app, API | Not found | Quote only | |
AI plus analyst | Not documented | Severity | Asset Insights | Remediation tracking | Not found | Quote only | |
Thermal and visual defects | Not documented | Not documented | Not documented | Tasks and punch lists | Not found | Quote only | |
Service thermography | Not documented | Not documented | SolarGain | Mobile tasks | Not found | Quote only | |
DJI Thermal Analysis Tool | None (general) | Yes, manual | No | PDF/DOC per image | No | Not found | Free |
Also considered
- Pix4D (general photogrammetry software): PIX4Dmatic builds thermal orthomosaics with per-pixel temperatures. It costs from USD 125 per month (checked October 2026). It has no automated solar fault detection, so it fell below the minimum score. We cover it on our drone inspection page as a processing step.
- FLIR Thermal Studio (general thermography software): It batch-processes radiometric images from handheld and drone cameras, with report templates. flir.com shows USD 431.99 for a one-year subscription without naming the edition. We found no solar fault classes, so it fell below the minimum score.
- Fluke TruTest Solar PV Inspection Software: It produces IEC 62446-1 (the PV electrical testing standard) test reports from the Fluke SMFT-1000 tester. It makes no thermal reports, so it does not match this job. The Lite licence is USD 355.99 one-time. See solar commissioning software.
How do you choose solar thermal inspection software?
- For a ranked fault list and a strong review record, pick Sitemark.
- If you read the images yourself and want a published price, pick Scopito at EUR 20 per MW.
- Need power and revenue loss per fault, or proof for a warranty claim? Pick Raptor Maps.
- With no thermographer in-house, compare Zeitview and Above Surveying. Check what you keep if you change provider.
- If thermal findings feed construction QA and punch lists, shortlist SenseHawk.
- For a few small sites and a DJI thermal drone, start with the free DJI Thermal Analysis Tool.
- If you shoot with handheld cameras, look at FLIR Thermal Studio. It does not classify solar faults.
- If your contract requires IEC 62446-3, ask every company for a sample report. We found none that documents it publicly.
Want more choices? Browse every tool we checked in our aerial and thermal inspection category.
Solar thermal inspection software FAQs
What is IEC 62446-3 and why does it matter for solar inspections?
IEC TS 62446-3 is the technical standard for outdoor infrared (heat) imaging of PV modules and plants. Contracts or lenders may cite it. As of October 2026, we found no IEC 62446-3 classes on the company pages of the seven ranked tools. Ask for a sample report.
What defects can thermal imaging detect in solar panels?
Thermal imaging can find hotspots, string outages, diode faults, PID and backsheet faults. The tools we reviewed in October 2026 document these (Scopito, Zeitview). Sitemark adds visual checks for MC4 connectors, cracking and soiling. These pair well with thermal findings.
Do I need a radiometric thermal camera for solar inspections?
Yes, if you want measured temperatures and not just a colour picture. DJI Thermal Analysis Tool 3 reads DJI radiometric images. DroneDeploy’s radiometric thermal mapping sits on its quote-only Advanced plan. Pix4D builds thermal orthomosaics from radiometric cameras such as the DJI M30T and Mavic 3T (checked October 2026).
How much does solar thermal inspection software cost?
As of October 2026, Scopito charges EUR 20 per MW for software and EUR 65 per MW for full service (10 MW minimum). DJI Thermal Analysis Tool 3 is free. FLIR Thermal Studio shows USD 431.99 per year. Sitemark, Raptor Maps, Zeitview, SenseHawk and Above Surveying are quote only.
Can thermal inspection software analyse handheld images as well as drone images?
Some general tools can. FLIR Thermal Studio supports handheld, drone and OGI (optical gas imaging) cameras. The solar platforms ranked here describe drone or aerial images. Raptor Maps also loads data from aircraft, satellites and third-party reports. Check the company’s supported cameras before you buy (October 2026).
Sources
All checked 22 to 25 October 2026.
- Sitemark: pricing, solar inspections, G2, Capterra
- Scopito: solar PV inspection software and pricing, solar inspection page, G2
- Raptor Maps: website, Solar Builder, November 2021, API docs, App Store
- Zeitview: solar page, Trustpilot
- SenseHawk: SoftwareOne listing, G2 TaskMapper, G2 SenseHawk
- Above Surveying: Intersolar exhibitor listing, pv magazine, December 2024, App Store
- DJI: PV inspection solution, DJI Store, downloads and release notes, Heliguy guide
- Pix4D: pricing, thermal processing. DroneDeploy: pricing
- FLIR: Thermal Studio. Fluke: TruTest
Last updated 28 October 2026. Next scheduled review: 23 January 2027.