Key takeaways
- Pixel size runs from 5.5 cm (Nearmap vertical) to 60 cm (NAIP standard). Google HIGH is 10 cm, and Google MEDIUM or BASE is 25 cm.
- An EagleView executive wrote in North American Clean Energy (2021) that 3 inches (7.6 cm) or finer is ideal. EagleView sells imagery. This is not a standard.
- NAIP says its flying cycle is no more than 3 years. Google’s coverage page gives no capture dates. But each API response carries an imageryDate, so check the date on every roof.
- Licences differ. NAIP carries a public domain label. Google requires attribution. OpenSolar sells Nearmap images per project.
To trace roofs on imagery in software, see the best residential solar design software list.
Aerial imagery at a glance
Aerial imagery is a flat photo layer in design software. It shows the roof as it was on the capture day, and not after.
| Item | Detail |
|---|---|
| Formula | Pixels across a feature = feature size ÷ pixel size (GSD, ground sample distance). |
| Unit and range | Centimetres or inches per pixel. Current sources run from 5.5 cm (Nearmap vertical) to 60 cm (NAIP standard). Older NAIP was 1 to 2 m. A drone can go finer. |
| Where it matters | Remote roof tracing, shade checks, proposals and deciding if you need a visit. |
| Standard or rule | We found no single standard for solar design. Each source sets its own pixel size, dates and licence. |
| In software | Design tools offer a basemap or a paid provider. Some show capture dates. Some do not say. |
Why does aerial imagery matter for installers?
Imagery lets a designer draft a roof layout before anyone visits it. Check the capture date first, such as the imageryDate Google returns.
The risk is an old or coarse picture. A roof changes after the capture day. A small obstruction can hide inside one pixel. The photo is a layer for design, not a measurement. See roof measurement for pitch and area. See site survey for when to visit.
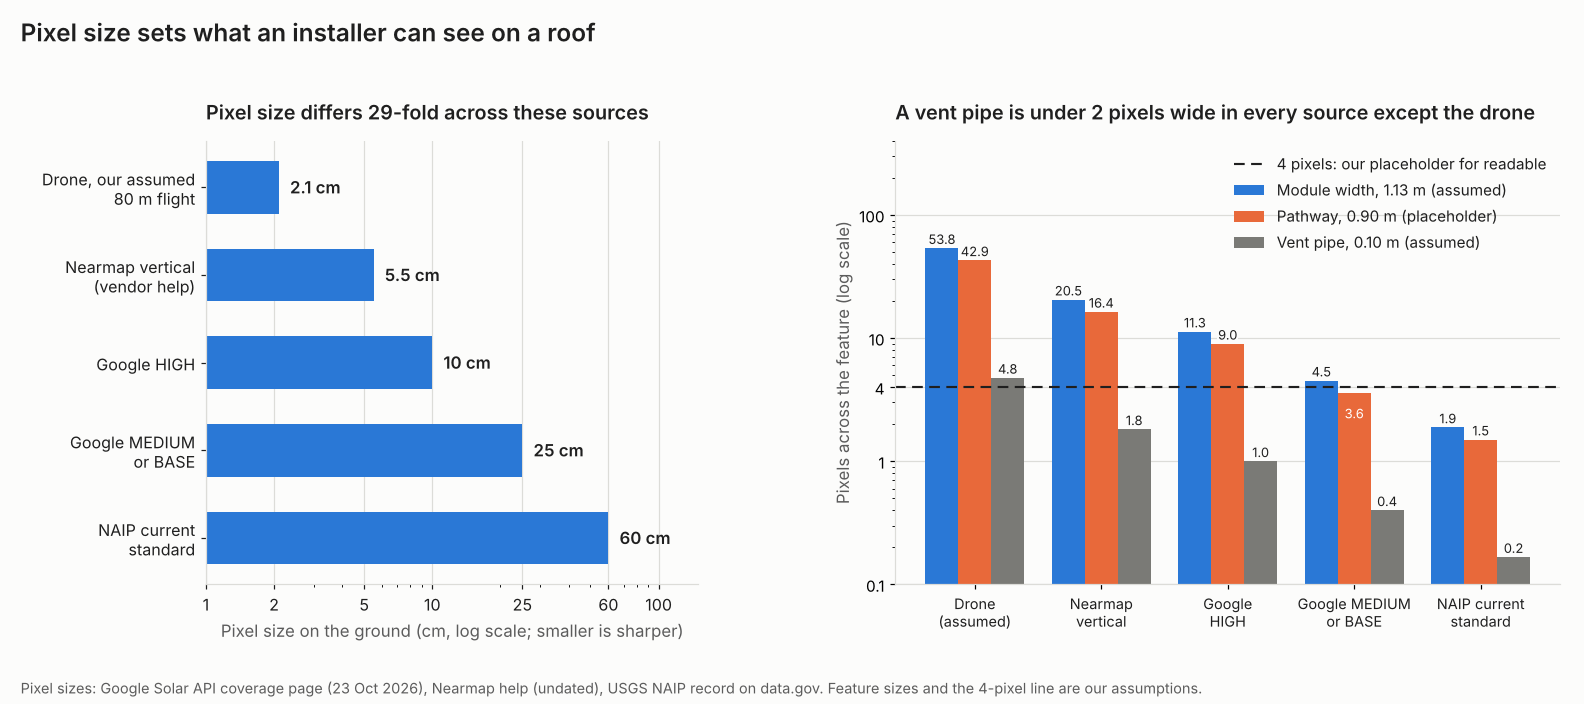
Figure 1. Pixel size differs 29-fold across these sources. On our assumed sizes, a vent pipe is under two pixels wide in every source except the drone.
Where does aerial imagery come from?
Sources are satellite basemaps, aircraft imagery sold by providers, public programmes and your own drone. Pixel size and refresh differ for each.
| Source | Pixel size | Refresh and age | Access |
|---|---|---|---|
| Satellite basemap (Google Maps HD, Bing) | No company figure. One EagleView-authored article (NACE, 2021) gives an average over 12 in (30 cm). | Not stated. | Aurora names Google HD as the default. |
| Google Solar API | HIGH 10 cm (low-altitude aerial), MEDIUM 25 cm (high-altitude aerial), BASE 25 cm (satellite). | Coverage page gives no capture dates. Each response has an imageryDate. | API terms and attribution, see licences below. |
| Nearmap (aircraft) | 5.5 cm vertical (company help, undated). | Nearmap’s coverage map shows a planned number of captures a year for each location, with leaf-on and leaf-off capture in some areas. Frequency is not fixed across every area it flies, so check the map for your site. | Paid, per image in OpenSolar and Aurora. |
| NAIP (US public programme) | 0.6 m standard from 2018, 0.3 m an option. 1 or 2 m for 2002 to 2017. | No more than a 3-year cycle, in the growing season. | Public domain label. |
| Your own drone | Your choice. Our assumed 80 m flight gives 2.1 cm. | The day you fly. | Yours to upload as custom imagery in Aurora. |
Sources for this table:
- Aurora help (updated 10 September 2026).
- Google Solar API coverage (23 October 2026).
- Nearmap help, and the data.gov NAIP record (updated 9 July 2025).
- An EagleView executive’s article (18 September 2021).
- The drone row uses the flight on our orthomosaic page.
What is pixel size (GSD), and what can you see at each size?
GSD is the ground distance one pixel covers. Pix4D’s example: a GSD of 5 cm means one pixel stands for 5 cm on the ground. Smaller is sharper.
- Take the pixel size from the source, in cm or inches.
- Take the feature size, such as module width.
- Divide feature size by pixel size to get pixels across.
- Compare it with the pixels you need to read the feature. We use 4 as a stand-in, not a standard.
Our assumed features are a 1.13 m module width, a 0.90 m pathway and a 0.10 m vent pipe. The pathway is a stand-in. Your AHJ sets real widths.
| Source and pixel size | Module width 1.13 m | Pathway 0.90 m | Vent pipe 0.10 m |
|---|---|---|---|
| Drone 2.1 cm | 53.8 | 42.9 | 4.8 |
| Nearmap 5.5 cm | 20.5 | 16.4 | 1.8 |
| Google HIGH 10 cm | 11.3 | 9.0 | 1.0 |
| 25 cm (Google MEDIUM or BASE) | 4.5 | 3.6 | 0.4 |
| NAIP 60 cm | 1.9 | 1.5 | 0.2 |
Cells show pixels across for our assumed features. Take 4 as the threshold. A 25 cm image reads the module width (4.5) but not the pathway (3.6). The coarsest pixel size that gives 4 pixels is 28 cm for the module. It is 22.5 cm for the pathway and 2.5 cm for the vent.
Sharp is not accurate. A sharp image can still sit in the wrong place. Our orthomosaic page covers accuracy. LiDAR gives heights that a flat photo cannot.
How old can an image be?
We found no standard that sets a maximum image age for solar design. Check the age for every roof. A new roof, an extension or a felled tree can make the photo wrong.
Example (invented dates): an image captured 15 July 2024 is 27.4 months old on 26 October 2026. That is over a 24-month limit we made up. Age is days divided by 30.4375. Set your own limit. NAIP’s cycle is "no more than" 3 years. So check the capture year of the image shown. Some providers fly often, such as Nearmap. They let you choose a date.
Aerial imagery pixel and age calculator
Enter a pixel size, a feature size and two dates. The presets match the tables above.
All inputs are assumptions you set. The calculator rejects zero, negative and out-of-range values. It also rejects impossible dates and unclear numbers such as 1.000.
Can you reuse aerial imagery in a design file?
NAIP carries a public domain label, and Google Solar API results must show on a Google Map with attribution. Read each licence before you export imagery into a permit set or a proposal. This page covers three sources and is not legal advice.
- Google Solar API. The policies page (23 October 2026) requires the text "Source: Includes solar data from Google" wherever you use or display Solar API data or imagery. You can skip that extra text only if the content already sits on a Google Map with Google’s own attribution visible. The page does not require you to show results on a Google Map in the first place. It also points to Google Maps Platform’s general caching restrictions.
- NAIP. The data.gov record lists a public domain label and public access.
- OpenSolar marketplace. Each purchase is tied to a project location. You need a new purchase for more area or after expiry. The page gives two expiry figures, 90 days and 366 days. It does not reconcile them (page dated 19 May 2026). We could not reopen this page in November 2026 to re-confirm those two figures, so check the current OpenSolar article before relying on them.
Nearmap and Vexcel licence text is not covered here. Ask the provider before you hand imagery to a customer or an AHJ.
How solar software handles aerial imagery
OpenSolar, Google Solar API and Nearmap show a capture date. Aurora’s help page and the Solargraf blog do not state one. The table mixes data APIs (Google, Nearmap) with design tools, as read in October 2026.
| Software | Imagery documented? | Capture date visible? |
|---|---|---|
| Aurora Solar | Yes | Not stated |
| OpenSolar | Yes | Yes |
| Google Solar API | Yes | Yes |
| Nearmap | Yes | Yes |
| Solargraf | Partly | Not stated |
The notes below summarise each page.
- Aurora Solar: Google HD is the default. Google or Bing Maps are fallbacks. Nearmap (US, Australia) costs one credit per image. Aurora lists Vexcel as available in the EU, and allows custom imagery upload. EagleView’s entry has changed between reads, so confirm EagleView availability in Aurora before you rely on it. Help page updated 10 September 2026. This specific page sits behind a bot check we could not get past in November 2026, so these details were not re-opened this pass.
- OpenSolar: Marketplace lists MetroMap (Australia) and Nearmap, per image (page 19 May 2026). You pick a capture date from a drop-down. The Nearmap overview (21 October 2026) shows dates in the design zone. This page also sits behind a bot check we could not get past in November 2026.
- Google Solar API: Responses carry imageryQuality (HIGH, MEDIUM, BASE) and an imageryDate. Building insights page updated 21 October 2026. Reconfirmed November 2026: HIGH is processed at 0.1 m/pixel, MEDIUM and BASE at 0.25 m/pixel, matching the pixel sizes used throughout this page.
- Nearmap: 5.5 cm vertical (confirmed on Nearmap’s own help page, November 2026). Nearmap’s own coverage map shows the planned captures per year for each location, rather than one fixed frequency everywhere. A help article lets you pick historical vertical captures. Both pages are undated.
- Solargraf: An undated company blog lists Google, Azure and Nearmap as integrated sources and gives pixel sizes. No help page is cited.
To find the capture date, follow these steps from the company pages.
- OpenSolar: click the Nearmap icon in the design zone. Use the vertical images drop-down (overview page, 21 October 2026).
- Google Solar API: read imageryDate in the response (building insights page, 21 October 2026).
Aurora’s help does not document a date check, so no steps are listed.
"Yes" means the company’s own page says so. Partly: only some of the need is documented. Not stated: the page we read does not say. The table covers imagery only, not roof accuracy. See roof measurement for the tools that measure from it. To compare design tools that use this imagery, see the best solar design software and residential solar design software lists.
Common mistakes with aerial imagery
FAQs
What resolution do I need for solar design?
No standard sets one. An EagleView executive wrote in North American Clean Energy (2021) that 3 inches (7.6 cm) or finer is ideal. EagleView sells imagery. On our assumed sizes, 25 cm still reads a module width but not a vent pipe. Pick a pixel size for the smallest feature you must see.
Is satellite imagery good enough for a quote?
It can be for a simple roof. That holds if the date is recent and you can see the obstructions. Google’s BASE tier is 25 cm satellite imagery. Confirm pitch, shade and electrical details with a site survey before you finish.
How often is aerial imagery updated?
Nearmap’s coverage map shows the planned number of captures a year for each location, rather than one fixed frequency everywhere, and NAIP says no more than a 3-year cycle. Google’s coverage page gives no dates, so read imageryDate for each place. Refresh varies by source and place.
Can I use Google imagery in a customer proposal?
Yes, if you credit it. Google’s Solar API policies require the text "Source: Includes solar data from Google" wherever you display Solar API data or imagery. You only skip that extra text if the content already sits on a Google Map with Google’s attribution visible, which is not a requirement to use a Google Map at all. This page covers no terms for other Google products. Check the licence for the product you use.
How is aerial imagery different from an orthomosaic?
An orthomosaic is one kind of aerial image. It is stitched from overlapping drone photos and corrected for perspective, so you can measure it. Check whether a source says its images are corrected the same way. See orthomosaic.
Related terms
- Roof measurement: sizes taken from imagery.
- Orthomosaic: a measurable map stitched from drone photos.
- 3D solar modelling: shade calculated on a model.
Next step: find the capture date on your next roof. Google Solar API and Nearmap supply dates as data, so to compare design tools that show them, see the best residential solar design software list.
Sources
- Google Solar API: coverage. Last updated 23 October 2026 (checked October 2026).
- Google Solar API: building insights and data layers, last updated 21 October 2026 (checked October 2026).
- Google Solar API: policies and attributions, last updated 23 October 2026 (checked October 2026).
- data.gov: NAIP imagery record, dataset last updated 9 July 2025 (checked 30 October 2026).
- Aurora help: Tips for an accurate site model, Imagery, updated 10 September 2026 (checked 30 October 2026).
- OpenSolar: Enabling Imagery Marketplace, updated 19 May 2026, and Nearmap on OpenSolar overview, updated 21 October 2026.
- Nearmap help: Nearmap content and historical imagery in Nearmap on OpenSolar, both undated (checked October 2026).
- Solargraf blog: high quality imagery, undated company blog (checked October 2026).
- Pix4D support: Image acquisition, no date printed (checked October 2026).
- North American Clean Energy: Leveraging aerial imagery for solar, published 18 September 2021, written by an EagleView executive (checked 30 October 2026).
Last updated 30 October 2026. Next scheduled review: 30 January 2027.