Key takeaways
- Alerts fall into four groups. They are device events, lost communication, output below expected, and checks between units or periods.
- On the synthetic 365-day series, a one-day 90% rule caught a lost string on day one. It also averaged 5.2 noise-only false-alarm episodes a year.
- Two days below 85% raised no noise-only alarms. The rule’s 2.0 episodes a year were the sensor error and curtailment events injected into the series.
- A 7-day total below 80% gave almost no false alarms. But it caught the lost string a median 5 days late. It missed a slow 15% soiling loss in 299 of 300 runs.
- Skip days with little expected energy, missing data, and ratios above 130%. The calculator below applies these guards.
To see which platforms send these alerts, read the best solar monitoring software.
Alerts and alarms at a glance
An alert checks live data against a rule. It tells someone when the rule fails.
| Item | Detail |
|---|---|
| Core formula | Ratio = actual kWh divided by expected kWh, for the same period. |
| Where expected comes from | A performance model driven by measured weather, per the Hukx performance ratio note. |
| Rule shapes | One period below a limit. Several periods in a row. A rolling total. No data for a set time. |
| Standard or rule | No standard for alert thresholds found on the pages read. Hukx cites the IEC 61724 series for performance ratio and index. |
| In software | Monitoring platforms. Check the threshold, time window and exclusions. |
Why alerts matter for installers
An alert turns a silent loss into a service job. A system with a failed string still runs, so no one sees the loss.
In the synthetic series (fixed random seed) a lost string cost 11.2 kWh a day. So a 5-day delay in flagging it costs about 56 kWh. The three-day inverter trip cost 120 kWh.
Too many alerts cause the opposite problem. IBM describes alert fatigue as exhaustion caused by an overwhelming number of alerts, many of them low-value or false. That article is about IT operations.
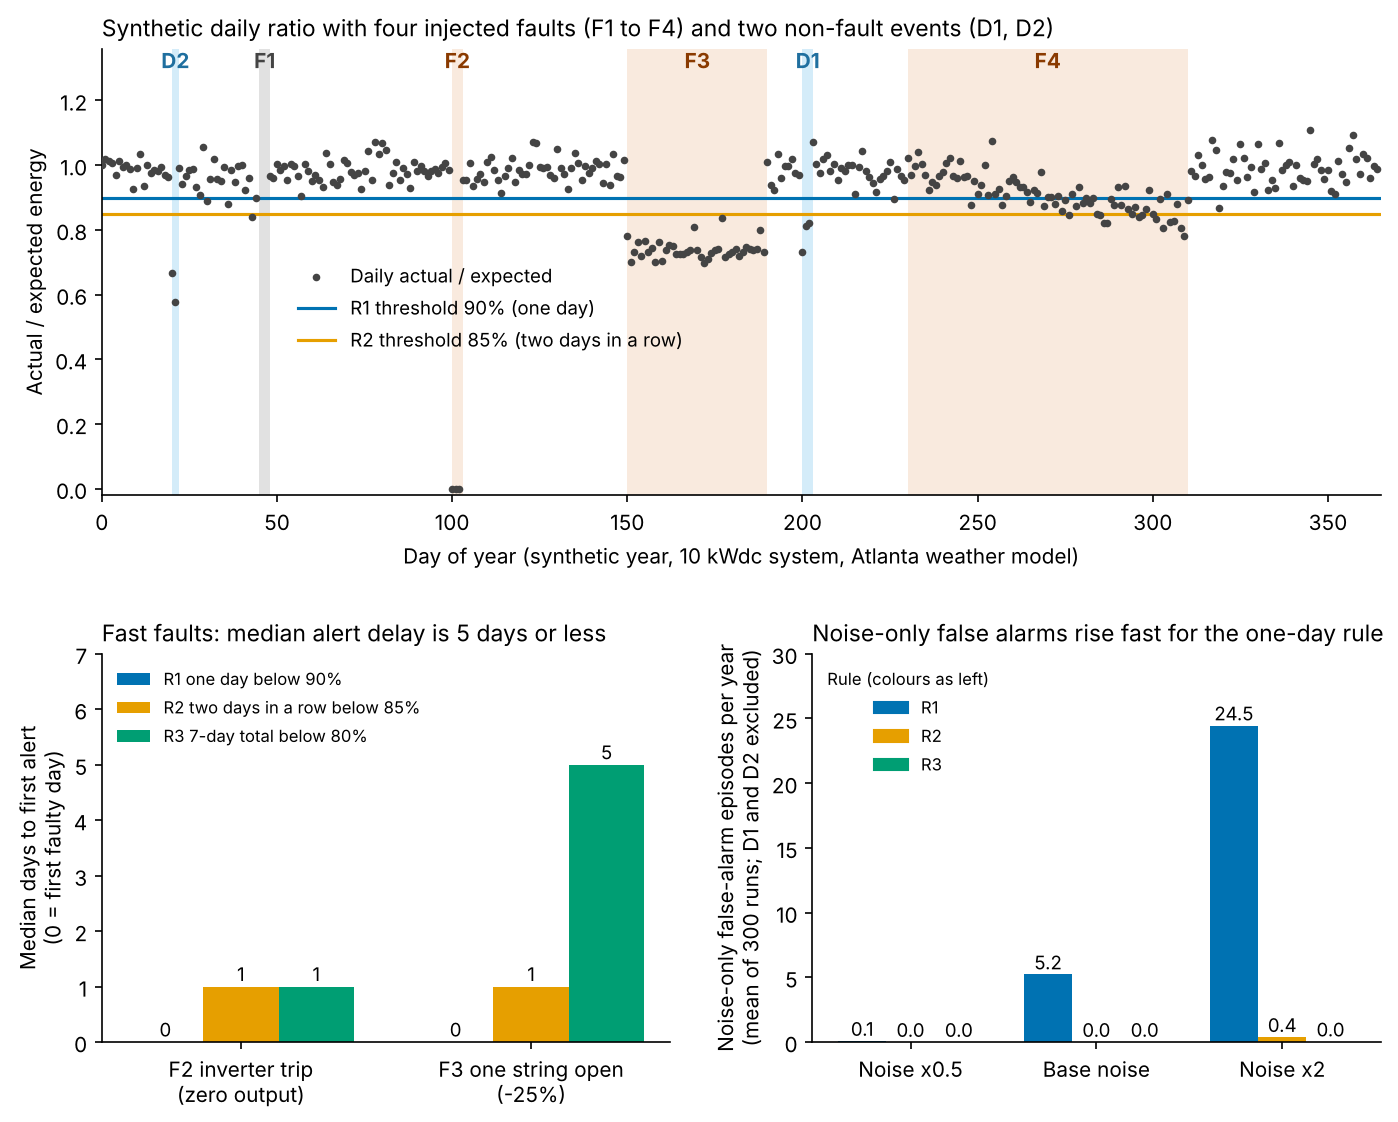
Figure 1. On a synthetic year, a one-day rule flags hard faults at once. It raises about 5 noise-only false alarms a year. It also alarms on two injected events. A 7-day rule is quiet but slower.
What types of alerts do monitoring platforms raise?
Alerts fall into four groups, though each company names them differently. The examples below come from the company pages in the software table.
- Device events: SMA lists an alarm for grounding faults, residual current and the grid disconnecting device under IEC 62109-2. Fronius sends status codes as service messages.
- Lost communication: Solar Analytics flags "Communication Offline" if the device stops sending data. Fronius shows an inverter blackout after a time you set.
- Output below expected: SMA has an alarm when the performance ratio falls outside tolerance. Solar Analytics has Severe and Moderate Underperformance. Energy Toolbase has a 7-day rule.
- Comparison: SMA has an inverter comparison alarm. Fronius status 997 ("Energy comparison deviation detected") comes from its earnings comparison function.
The words "alert" and "alarm" are used loosely. Victron’s VRM manual separates warnings from alarms and sends only alarms by default. SolarEdge uses "alerts" with an impact score from 1 to 9. The pages show no shared definition.
How is expected output calculated?
Expected output is what a model predicts for the weather that really happened. Hukx says the model, usually agreed in advance, runs on measured weather.
- Pick the period, such as one day or 7 days. Read actual kWh from the meter or inverter.
- Get weather for the same period. You need sun on the array plane and temperature. A pyranometer gives measured values. Satellite data is the backup.
- Run the model on that weather to get expected kWh. The example uses a pvlib PVWatts-style chain with -0.30% per kelvin and a 0.90 loss factor.
- Divide actual by expected.
- Apply guards. Skip the ratio when expected energy is tiny, data is missing, or the result is too high to be true.
The old-style performance ratio ignores array temperature, so it swings with the seasons. The performance index uses a more detailed model instead.
Worked example: three threshold rules on a synthetic year
Three rules run on one invented 365-day series. The numbers show the trade-off between speed and false alarms. They do not describe a real site.
| Setup item | Value |
|---|---|
| System and weather | 10 kWdc, 25 degree south tilt, 8.5 kW inverter, Atlanta position, pvlib clear-sky model with random daily cloud factors |
| Expected series | Model run on "measured" irradiance with random error (1.5% daily plus 6% of the day’s dullness, plus 1% hourly, assumptions) |
| Actual series | Model run on true irradiance, times 0.98 for as-built shortfall, times each fault |
| Totals (seed 2026) | Expected 13,851 kWh. Reported actual 12,667 kWh |
| Events | Six events, listed under the table (day 0 is 1 January). |
| Rules | R1: one day below 90%. R2: two days in a row below 85%. R3: 7-day total below 80%, the same shape as Energy Toolbase’s 7-day cumulative check, not its code or threshold. |
| Limit of the test | Expected and actual come from the same model, so real false-alarm rates will be higher. |
| Guards (all rules) | Skip days with under 3 kWh expected or missing data. R3 needs 5 judged days in the 7. |
- F1: days 45 to 47, no data.
- F2: days 100 to 102, inverter trip with zero output.
- F3: days 150 to 189, one of four strings open, -25%.
- F4: days 230 to 309, soiling grows to -15%.
- D1: days 200 to 202, irradiance sensor reads +25%.
- D2: days 20 to 21, curtailment, -35%.
The totals above are for the fixed-seed series. The results come from 300 runs of the year with new weather and noise, and the faults stay fixed. A false-alarm episode is a run of alert days that starts outside all fault windows. D1 counts as false because it is a sensor error. D2 is a real output loss, but not a fault. Neither counts in the noise-only figures. Alert days after a fault ends are not counted as false alarms. For R3 that is about 6.5 days a year. Delay 0 means the first faulty day.
The table below compares the three rules. Tighter rules alert sooner but raise more noise alarms.
| Rule | F2 trip: median delay (days) | F3 string: median delay (days) | Outside fault windows per year, mean (5th to 95th percentile) |
|---|---|---|---|
| R1 one day below 90% | 0 | 0 | 7.2 (4 to 11). Noise-only 5.2 (2 to 9) |
| R2 two days below 85% | 1 | 1 | 2.0 (always 2). Noise-only 0.0 |
| R3 7-day total below 80% | 1 | 5 | 0.0 (always 0). Noise-only 0.0 |
The slow soiling fault (F4) separates the rules most.
| Rule | F4 soiling result |
|---|---|
| R1 one day below 90% | First alert median day 19. The loss alone reaches 90% on day 43 |
| R2 two days below 85% | First alert median day 64. The loss alone reaches 85% on day 70. Missed in 2% of runs |
| R3 7-day total below 80% | Missed in 99.7% of runs. The loss alone gives a ratio of about 0.83 |
Four points stand out.
- Tight rules sit inside the noise. Of 234 fault-free days, 7 (3.0%) fell below 90% and 1 below 85%.
- Early soiling alerts were mostly noise. In 99.7% of runs R1’s first soiling alert came before the loss reached 90%, and in 78.7% for R2. A slow loss needs a trend rule, not a daily limit.
- R2’s 2.0 is the D1 and D2 events. Its noise-only count is near zero at base noise.
- Noise drives R1. Halving the assumed noise cut R1’s noise-only count to 0.1 episodes a year. Doubling it raised that count to 24.5. R2 stayed between 0.0 and 0.4, and R3 between 0.0 and 0.03.
Ratio rules do not judge F1 (missing data). A no-data rule must catch it.
Check an expected-vs-actual ratio
The calculator below turns two energy figures into a ratio. It will not judge bad inputs. The six buttons load the cases in the table that follows.
| Case | Expected / actual (kWh) | Other input | Result |
|---|---|---|---|
| Normal day | 38 / 36.1 | 85% threshold | 95.0%, no alert |
| Low output | 38 / 27.6 | 85% threshold | 72.6%, alert |
| Dull day | 2.1 / 0.9 | 3 kWh minimum | Not judged |
| Zero output | 38 / 0 | 85% threshold | 0.0%, alert. Check inverter fault codes first |
| Odd high | 38 / 52 | 130% plausibility level | 136.8%, not trusted. Check sensor, meter and model |
| Data gap | 38 / 22 | 60% data coverage | Not judged. Treat as a communication gap |
The 130% plausibility level and the 60% coverage level are set by this page, not by a standard.
How solar software handles alerts and alarms
None of the six pages prints a numeric underperformance threshold. Most show how messages are muted or batched, so check how each platform pauses and groups alerts. Each tool is rated only from the page named. The sources were checked in October 2026 and are listed below. Several are regional pages, so US behaviour may differ.
Four pages document alerts fully. Two document them partly, and all six differ on thresholds and delays.
| Software | Documents alerts? | Limits of the page |
|---|---|---|
| SolarEdge monitoring platform | Yes | No numeric thresholds. |
| Enphase Enlighten | Yes | Threshold value and delays not stated. |
| SMA Sunny Portal | Partly | Page does not say whether it covers Classic or ennexOS. Tolerance not defined. |
| Fronius Solar.web | Partly | Service messages only. No alert settings or notifications described. |
| Solar Analytics | Yes | Expected generation not defined. No underperformance thresholds. |
| Energy Toolbase | Yes | Percentage threshold and most delays not given. |
Partly means the page describes some alert features but leaves out detail we looked for.
- SolarEdge monitoring platform: Six rule categories (Equipment, Grid, Storage, Communication, Environmental, Energy Management). Impact 1 to 9. Daily email. Auto-close. Mute until a date. Source: SolarEdge application note, version 1.4, August 2023.
- Enphase Enlighten: Production Issue status when production falls below a set Production Threshold, or when more than 10% of microinverters show a hardware issue. Alert emails are batched. Source: Enphase Australia support FAQ, so the threshold and wording may differ elsewhere.
- SMA Sunny Portal: Twelve notification types, including performance ratio outside tolerance, communication monitoring, inverter comparison and IEC 62109-2 grounding faults. Source: SMA Sunny Portal manual, "Types of notifications".
- Fronius Solar.web: Service messages 997 (energy comparison deviation) and 999 (no inverter upload for a user-defined blackout time). Source: Fronius South Africa support page. Other regions may differ.
- Solar Analytics: Six alert types, including Severe and Moderate Underperformance and Communication Offline (7 days or more flagged Attention Required). Source: Solar Analytics installer help, Alerts Page.
- Energy Toolbase: "Solar Generation Lower than Expected" on cumulative generation over the last 7 days, Medium severity. The page gives no percentage. Expected generation uses system specifications and satellite weather data. Also meter and controller alerts. Source: Energy Toolbase help, "Types of Alerts".
Only Energy Toolbase’s page says how expected output is worked out, and only in general terms. To compare platforms beyond these six, see our ranked lists of the best solar monitoring software and the best solar inverter monitoring apps.
How do you set thresholds without false alarms?
Set the limit below the spread of healthy days. Then make the fault last before it alerts.
- Measure the noise first. In the series, healthy days had a median ratio of 0.98 and a 5th percentile of 0.92. A 90% rule sits inside that spread.
- Make the fault last. Victron’s manual lets you set how long a no-data alarm waits ("Notify after"). It also supports hysteresis. Fronius lets you set the blackout time.
- Batch or pause. Enphase batches alert emails. SolarEdge emails new alerts daily and lets you mute one until a date. Victron’s rate limiter stops emails and starts them again after 24 hours.
Pair a fast rule for hard faults with a slow trend rule for soiling or drift. The underperformance detection page covers the slow end.
Common mistakes with alerts and alarms
FAQs
What is the difference between an alert and an alarm in solar monitoring?
Companies use the two words loosely, with no shared definition. Victron splits warnings from alarms, SolarEdge says "alerts" with an impact score, and SMA names its notifications "alarms". Check each platform’s own words and priority levels.
What underperformance threshold should I use?
No published standard sets one, and the company pages we read give no number. Energy Toolbase’s page checks cumulative output over 7 days. On the synthetic series a one-day 90% rule gave 5.2 noise-only false-alarm episodes a year. Test any rule on 30 or more healthy days first.
Does a communication alert mean the system has stopped?
No. Fronius says a system shows "offline" if the internet link to the device is faulty or cut. Solar Analytics flags offline when the device stops sending data. The array may be producing normally.
Why does a cloudy day trigger an alert when nothing is wrong?
Because expected output rests on weather inputs that carry error. In our synthetic year, 7 of 234 fault-free days fell below 90% of expected. So skip days under 3 kWh expected and ask for two days in a row.
Related terms
- Performance ratio: AC energy divided by nameplate-rated ideal output for the same sunlight.
- Underperformance detection: finding slow losses that daily alerts miss.
- Data logger or gateway: the device that sends site data to the platform.
- Solar monitoring software: a platform that collects and stores readings from PV sites.
Next step: check each platform’s threshold, delay and mute settings in the best solar monitoring software, or the best solar inverter monitoring apps.
Sources
- SolarEdge, Alerts in the Monitoring Platform, version 1.4 (checked October 2026).
- Enphase Australia support FAQ on alert emails (page removed from enphase.com by November 2026, archived copy checked, content unchanged from the version read 30 October 2026).
- SMA Sunny Portal manual, Types of notifications (checked October 2026).
- Fronius South Africa, Support for Solar.web (checked 30 October 2026).
- Solar Analytics, Alerts Page (checked October 2026).
- Energy Toolbase help, Types of Alerts (checked 30 October 2026).
- Victron VRM Portal manual, Alarms and monitoring (checked October 2026).
- Hukx, How to calculate PV performance ratio and performance index (checked October 2026).
- IBM, What is alert fatigue? (checked October 2026).
Last updated 30 October 2026. Next scheduled review: 30 January 2027.