Key takeaways
- There are two sensor families. One is thermopile pyranometers. The other is silicon sensors, such as PV reference cells. In the STEP field study, the reference cell read 5% below the pyranometer over a year.
- Sensor error passes straight into performance ratio (PR). In our invented 250 kWp plant, a sensor 2% high cuts PR from 77.6% to 76.1%, and one 3% low hides a real 3.0% shortfall.
- SMA lists three causes of a PR above 100%. They are a shaded gauge, a dirty gauge and a badly aligned one.
- Mount the sensor in the array plane, and name the sensor type beside every PR you quote.
To feed sensor readings into PR and alerts, see the best solar performance analytics software.
Pyranometer and irradiance sensor at a glance
An irradiance sensor turns sunlight into a number in W/m². That number is the base of PR and of the expected-energy line.
| Item | Detail |
|---|---|
| What it outputs | Irradiance in W/m². In the array plane it reads plane-of-array (POA) irradiance. Add it up over time to get kWh/m². See specific yield. |
| Main types | Hukx names "two main types of pyranometers: a thermopile and a silicon photodiode pyranometer". PV reference cells are also silicon. |
| Where it matters | PR, expected-versus-measured energy, acceptance tests, guarantees and alerts. |
| Standards | Instrument classes A, B and C (see Table 2). IEC 61724-1 covers PV monitoring systems. Hukx says its 2021 edition came out in July 2021. |
| In software | Platforms read the sensor through a logger. They compare it with modelled output. |
For GHI, DNI and sky components, see solar irradiance. This page covers the sensor and its error.
Why the sensor matters for installers
The sensor sets the yardstick. Every PR, expected-energy line and alert scales with its reading.
Hukx says IEC 61724-1 "recognizes solar irradiance measurement as one of the weakest links in the measurement chain". A drifting sensor can cause a false call-out. It can also hide a real loss in a guarantee test. See performance ratio for the formula. See energy yield simulation for the source of expected energy.
Thermopile pyranometer or PV reference cell: which one?
A thermopile pyranometer gives broadband sunlight. Thermopile types respond across roughly 0.3 to 3 micrometres, and Hukx quotes 0.3 to 2.8 for its own. You can compare it with weather data. A silicon sensor follows the response of a solar cell. Field papers show gaps of several percent.
Table 1. What the sources say. Gaps depend on site, sky and model. They are not general rules.
| Item | Thermopile pyranometer | PV reference cell or silicon sensor |
|---|---|---|
| Spectral response | Hukx: about 0.3 to 2.8 micrometres. | Apogee: 360 to 1120 nm at the 50% points. |
| Spectral detail (50% points) | Apogee: 385 to 2105 nm. | Depends on the spectrum (NREL 2017). |
| Cloud and low sun | Apogee: "more accurate in all conditions" than its silicon-cell models. | Apogee: "errors are higher under cloudy conditions". |
- NREL 2017 reading gaps: at 50° zenith, in all weather (clear-sky results were tighter), an LI-200A photodiode pyranometer read -7% to +11% against the study’s reference. Reference cells read about -14% to +12%.
- Field comparison: STEP (Ontario, 2014 data, 30° tilt): annual POA sunlight was 5% lower on the reference cell than on the pyranometer. Snow shedding added 0.8% over the year and 2.4% in snowfall months. NREL 2012: spectral effects alone gave up to 3% on daily totals (modelled, clear sky).
- One-axis tracker finding (NREL 2017): the same study also looked at a one-axis tracker. In the morning and evening, photodiode pyranometers read 15% to 20% above the reference.
- Authors’ advice: NREL 2012 (Meydbray et al.): use reference cells to judge PV performance. Keep pyranometers to compare with historic broadband records. NREL 2017 (Vignola et al.): reference cells "provide an excellent measurement" when evaluating PV array performance, but are "not recommended to obtain irradiance measurements".
The two NREL papers differ in emphasis. One asks what the modules can use. The other asks what the sky gives. Pick the sensor that matches how your contract defines PR. Name it beside every PR you quote.
What do ISO 9060 classes A, B and C limit?
ISO 9060:2018 sorts pyranometers into classes A, B and C. A is the most accurate. "Spectrally flat" instruments do not favour any part of the spectrum.
Table 2. Selected class limits as Hukx prints them (clear-sky GHI spectral error). This is not the standard text. The response-time row is left out because we could not confirm it from the standard. Check the standard before specifying.
| Parameter | Class A | Class B | Class C |
|---|---|---|---|
| Non-stability | ±0.8% | ±1.5% | ±3% |
| Clear-sky GHI spectral error | ±0.5% | ±1% | ±5% |
| Temperature response | ±1% | ±2% | ±4% |
| Directional response | ±10 W/m² | ±20 W/m² | ±30 W/m² |
| Tilt response | ±0.5% | ±2% | ±5% |
Kipp and Zonen lists its SMP10x as "Spectrally Flat Class A". Its directional response is ±10 W/m². Apogee’s spec sheet (Rev. 10 June 2026) lists its pyranometers as Class C.
IEC 61724-1 monitoring classes are separate from ISO 9060 instrument classes. Hukx’s IEC 61724-1:2021 page calls monitoring Class A high accuracy. It is for utility-scale and large commercial plants. It calls Class B medium accuracy. That is for rooftop and small to medium commercial plants.
Where should you mount it?
Mount it in the array plane. Use the modules’ tilt and azimuth. Then it reads what the modules get.
- Same orientation: SMA’s note says "the orientation of the PV modules and the meter must be the same". It adds that a different cell type in the gauge can cause errors.
- Horizontal option: Apogee prefers the array plane for panel monitoring. It says some uses need a level sensor. meteocontrol can work out tilted irradiance from a horizontal pyranometer. It uses the Perez and Klucher models. That is a calculation, not a measurement. See plane of array.
How often should it be calibrated and cleaned?
Recalibrate on the maker’s interval (Apogee: every two years) and write it into the O&M contract. Dirt, drift and tilt errors all show up as false PR changes.
- Calibration: Apogee: "we generally recommend all sensors be recalibrated every two years". A longer gap can suit some needs. In the STEP study the maker advised two years. The pyranometer was 0.5 to 1.5 years overdue.
- Cleaning: Hukx links its non-stability limit to regular upkeep. That includes cleaning. Apogee advises isopropyl alcohol. It says not to use a rough cloth. NREL’s 2017 study cleaned its sensors five days a week. It calibrated them once a year. That was the study’s practice, not a rule.
- Sensor dirt versus array dirt: a clean sensor above dirty modules shows the soiling as a lower PR. That PR drop is real. A dirty sensor above clean modules reads low. The reading no longer matches the modules. See soiling.
Worked example: expected vs measured energy, with sensor error
A sensor error of x% moves PR by about x%. It moves in the opposite direction. That is enough to hide an underperformance alert. It can also invent one.
All numbers are example. A 250 kWp plant has a 31-day month. True POA sunlight is 168 kWh/m². The model’s expected PR is 80%. So true expected energy is 250 × 168 × 0.80 = 33,600 kWh. Metered AC energy is 32,592 kWh, a real shortfall of 3.0%. True PR is 77.6%. The alert flags when measured energy is over 5% below expected (example threshold). Each row changes only the sensor reading.
Table 3. Same plant, same meter, different sensor error. Positive error means the sensor reads high.
| Sensor error | Sensor reads (kWh/m²) | Expected energy (kWh) | PR from sensor (change in points) | Apparent shortfall (flagged?) |
|---|---|---|---|---|
| -5% | 159.60 | 31,920 | 81.68% (+4.08) | -2.11% (No) |
| -3% | 162.96 | 32,592 | 80.00% (+2.40) | 0.00% (No) |
| -2% | 164.64 | 32,928 | 79.18% (+1.58) | 1.02% (No) |
| 0% | 168.00 | 33,600 | 77.60% (0.00) | 3.00% (No) |
| +2% | 171.36 | 34,272 | 76.08% (-1.52) | 4.90% (No) |
| +3% | 173.04 | 34,608 | 75.34% (-2.26) | 5.83% (Yes) |
| +5% | 176.40 | 35,280 | 73.90% (-3.70) | 7.62% (Yes) |
A 2% error moves PR by about 1.5 to 1.6 points either way. A sensor 3% low gives a PR of exactly 80%. The real 3% loss vanishes. A sensor 2.1% high lifts the apparent shortfall to the 5% alert level. Even a plant with no real shortfall would trip the 5% alert if its sensor read 5.3% high. Only the sensor reading changes between rows. The meter and the model do not.
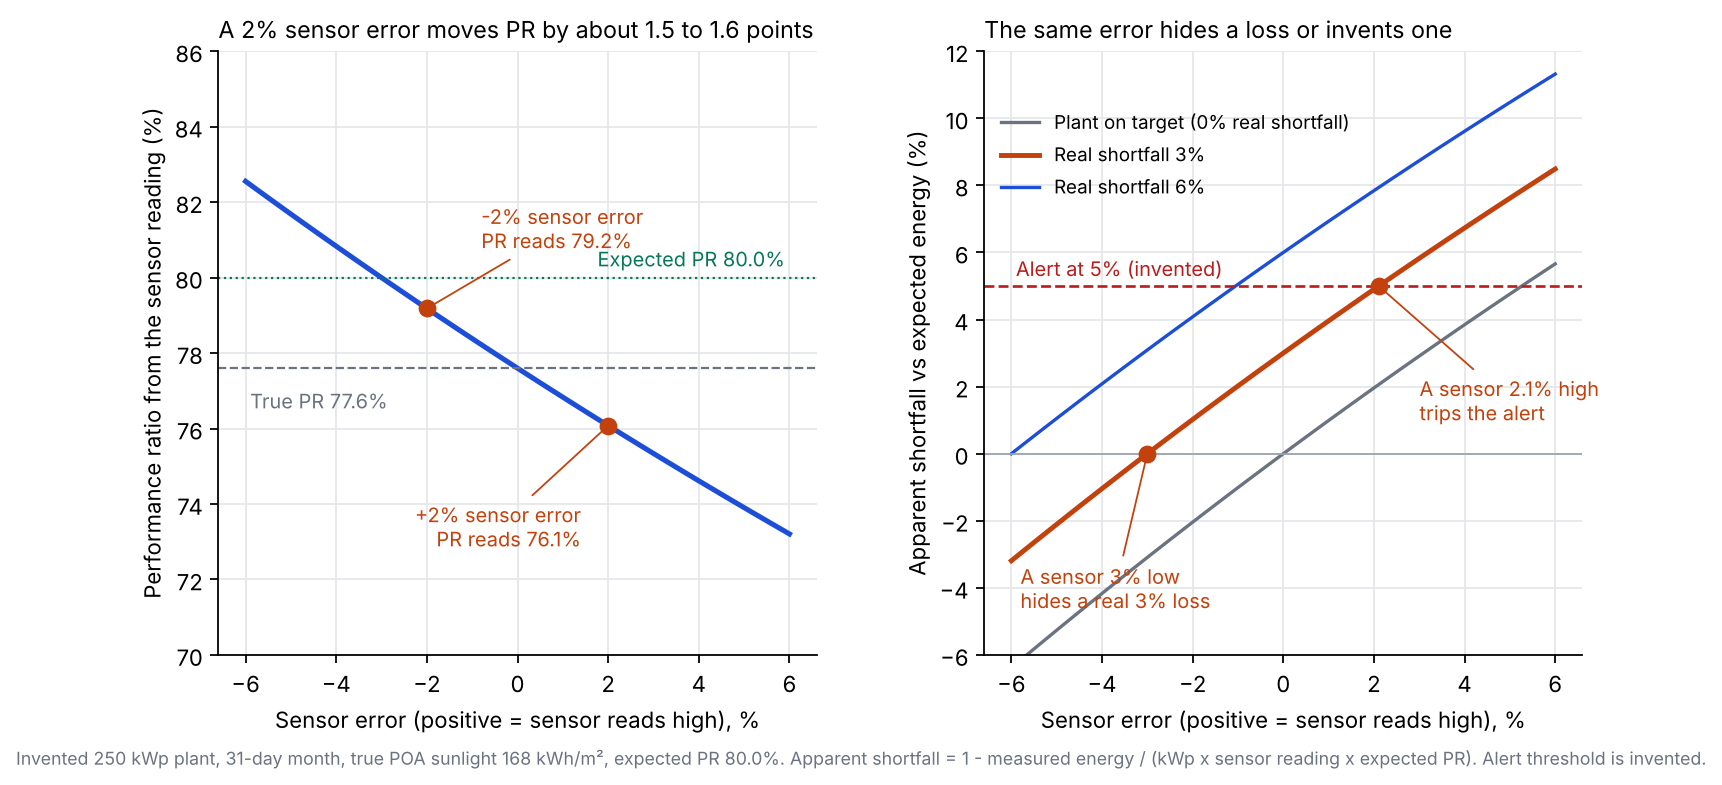
Figure 1. In an example 250 kWp plant, a 2% sensor error moves PR by about 1.5 to 1.6 points, and a sensor 3% low hides a real 3% loss.
How can you tell a sensor fault from a plant fault?
Check the sensor against something independent. These checks can help before you send a crew.
- Dark-sensor check: meteocontrol’s sensor alarm example fires on two conditions. The sensor reads under 10 W/m². Power exceeds 2% of installed capacity for 60 minutes. It runs from 30 minutes after sunrise to 30 minutes before sunset.
- Second source: compare with a second co-planar sensor. Or compare with satellite data. STEP compared a co-planar pair. See weather and solar resource data.
- Night-time zero: compare night-time readings with zero. STEP found its two sensors differed by about 4 W/m² at zero irradiance.
Expected-vs-measured calculator with sensor error
Enter metered energy, array kWp, the sensor reading and the modelled PR for one period. Add a known or suspected sensor error. You then see the corrected PR and shortfall. Enter PR as 80% or 0.80. Error has a sign: positive means the sensor reads high. The presets use the example plant above.
How solar software handles irradiance sensor data
In the pages we read, meteocontrol VCOM Cloud and SMA Sunny Portal document sensor data inside the platform. The Apogee and Kipp and Zonen pages describe the sensor only. Partly means the page covers the sensor but not how a platform uses it.
| Tool | Type | Documents sensor data? |
|---|---|---|
| meteocontrol VCOM Cloud | Platform | Yes |
| SMA Sunny Portal with Sunny SensorBox | Platform and sensor | Yes |
| Apogee PV-100 package | Sensor kit | Partly |
| Kipp and Zonen SMP10x | Sensor | Partly |
Pages read in October 2026 are listed below with what each says.
- meteocontrol VCOM Cloud: The PR chart uses POA irradiance from term G_M0. The page does not say where that comes from. Irradiance sensor alarms "reflect non-valid irradiance data". "Use of satellite data if no irradiance sensors are available." Tilted irradiance can be derived from a horizontal pyranometer. Page read: Help centre: PR chart (header: last modified 2026-07-29), irradiance sensor alarms (2026-05-27), tilted irradiance term (2025-02-11). VCOM monitoring page (undated). Metadata dates on some pages differ.
- SMA Sunny Portal with Sunny SensorBox: SensorBox has "an integrated solar cell" for irradiation and a PT100 module temperature sensor, and connects to a Sunny WebBox over RS485. The PR note needs the gauge in the module plane and at least 60 W/m² per hour for automatic PR in Sunny Portal. Neither document gives an accuracy figure. Page read: SENSORBOX-DEN103131 (no date). Perfratio-TI-en-11, version 1.1 (no date). Both name Sunny Portal and WebBox, not ennexOS.
- Apogee package: Described as "designed to work with an SMA cluster controller". Its SP-214 measures GHI or POA irradiance. Apogee describes "a monocrystalline silicon-cell detector that has the same spectral response as a PV module". That is a company claim. Page read: Apogee, Solar Energy and PV Monitoring page (no date).
- Kipp and Zonen sensor: "Spectrally Flat Class A". Modbus interface and analogue output. 5 to 30 VDC. The page names no monitoring platform and no recalibration interval. Page read: Kipp and Zonen product page (no date, 2026 footer).
To compare platforms that use sensor readings for PR and alerts, see the best solar performance analytics software. The sensor usually reaches the platform through a data logger.
Common mistakes with irradiance sensors
FAQs
Should I use a pyranometer or a reference cell for PR?
Use whichever your contract or test plan names. NREL’s 2012 article favours reference cells for PV performance. NREL’s 2017 paper says they are not recommended for irradiance measurements. Yet it says they give an excellent measurement for array performance. Name the sensor beside every PR you quote.
How often should I calibrate it?
Apogee suggests every two years. Other makers set their own gaps. IEC 61724-1 also sets intervals by monitoring class, but its text is not cited here. Check the datasheet and the contract.
Can satellite data replace the sensor?
Partly. Some platforms accept satellite data when no sensor is present, and meteocontrol’s VCOM page lists "Use of satellite data if no irradiance sensors are available". Satellite data is an estimate, not a measurement. See NSRDB for one dataset.
Why does my PR read above 100%?
A faulty or mismatched sensor is the likely cause. SMA’s note names a shaded gauge, a dirty gauge or a badly aligned one, and adds that a different cell type can shift PR. The sensor, the period and the units are the first things to look at, before the meter.
Related terms
- Performance ratio: energy output divided by the output an ideal system would make from the measured sunlight.
- Solar irradiance: the rate sunlight reaches a surface, in W/m².
- Soiling: energy lost to dust and deposits on the modules.
Next step: find out which sensor type and plane your contract names for PR. Then compare the best solar performance analytics software for PR and alerts.
Sources
All pages checked October 2026. None of the company pages below prints a date unless stated.
- Hukx (formerly Hukseflux), Pyranometers: all you need to know.
- Hukx, ISO 9060 pyranometer classification (Table 2).
- Hukx, IEC 61724-1:2021 quick explanation.
- Meydbray et al., NREL/JA-5200-56718, October 2012.
- Vignola et al., NREL/CP-5D00-70285, December 2017.
- STEP techbrief, Toronto and Region Conservation Authority, October 2017.
- Apogee: Pyranometer FAQs, PV monitoring and spec sheet (Rev. 10 June 2026).
- Kipp and Zonen, SMP10x pyranometer.
- SMA: Sunny SensorBox and Performance ratio technical information (version 1.1).
- meteocontrol: PR chart, sensor alarms, tilted irradiance and VCOM monitoring.
- Example plant: all numbers are computed with a fixed script from the stated inputs.
Last updated 30 October 2026. Next scheduled review: 30 January 2027.