Key takeaways
- On this page, a logger collects, stamps, buffers and uploads. SCADA adds a historian and commands. A portal mostly shows data. The polling maths is on the SCADA page.
- For an assumed site of 12 inverters, 1 meter and 1 weather station, cellular use at 5 minutes with hourly uploads is 19.6 MB a month. Sending text fields every minute raises that to 495.6 MB a month.
- An assumed 64 MB logger with half its memory usable holds 50.9 days at 5 minutes and 1.7 days at 10 seconds.
- No company page states what happens when a buffer fills.
- In a clear-sky model, a 15-minute snapshot is off by 2.6 kWh in 2,130,809 kWh a year. With a synthetic cloud series the median daily error is 3.7%.
To compare the monitoring platforms that receive logger data, see the best solar monitoring software list.
Data logger at a glance
A data logger sits between site devices and the cloud. It reads, stamps, stores and forwards data. Some models also take local control inputs.
| Item | Detail |
|---|---|
| Main jobs | Poll devices, time-stamp, buffer, upload. Some also read meters and sensors or accept a power reduction signal. |
| Typical links | RS-485 Modbus to devices, Ethernet, Wi-Fi or cellular to the internet. See the table below. |
| Reporting interval | No standard interval appears on the pages read. Tigo’s pricing page lists 15-minute data on its free plan and 1-minute on Premium. |
| Standard or rule | No logger standard appears on the pages read. Take reporting duties from the contract or utility terms. |
| In software | Logger hardware paired with a monitoring portal, sold by inverter makers and independent companies. |
Why a data logger matters for installers
The logger decides what data exists. You cannot fix a gap in the portal later. Nor can you fix a coarse interval.
It also sets running costs and call-outs. A cellular plan that is too small leaves gaps when output is disputed. So does a buffer that fills in a week. Resolution matters for performance ratio checks and for alerts. Alerts can only act on data the logger captured.
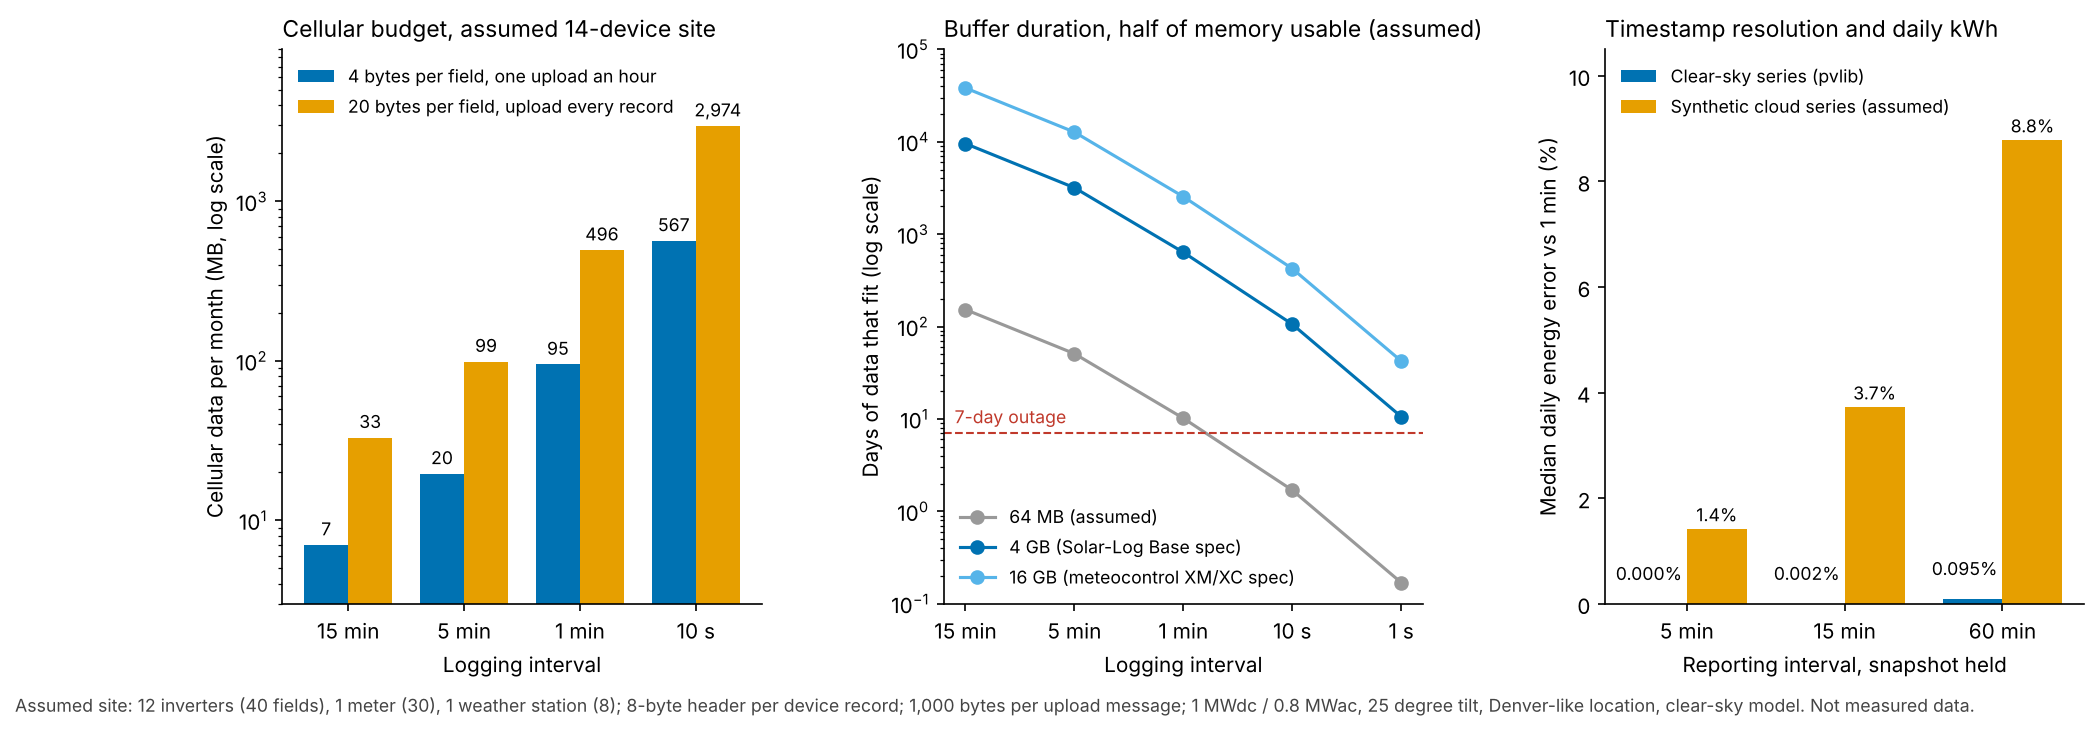
Figure 1. For the assumed 14-device site, the logging interval sets cellular data and buffer days. Coarser snapshots raise daily energy error.
How does a data logger differ from inverter comms, SCADA and a portal?
A logger collects from many devices and forwards the data. An inverter’s own comms report that inverter. SCADA also sends commands, and a portal displays. These are working definitions for this page. Companies blur them.
| Item | Inverter built-in comms | Data logger or gateway | SCADA | Portal |
|---|---|---|---|---|
| Reads | Its own inverter, sometimes a meter | Inverters, meters and sensors on one record | All plant devices | Stored data |
| Stores locally | Varies by product | Yes, in a buffer | Yes, in a historian | Cloud database |
| Sends commands | Product specific | Some, for example a power reduction interface | Yes | Usually no |
Fronius’s manual calls its Datamanager card "a network-compatible datalogger". For that brand, the logger is a plug-in card. The SolarEdge Commercial Gateway datasheet says it connects to third-party data loggers. It reads energy meters. It supports environmental sensors. Module-level data is a separate channel.
How does a data logger work?
It repeats a cycle: read, stamp, store, send. Local control is an extra input or output. It is not part of the cycle.
- It polls each device over a serial line or Ethernet for a block of registers. Scan time depends on the line. The SCADA page covers it.
- It stamps each record with the logger’s clock. The record is only as good as that clock and the reporting interval.
- It writes the record to local memory. This is the buffer it uses during an outage.
- It uploads batches to the cloud portal, often over a cellular or Ethernet link.
- If the model supports it, it passes a limit or setpoint to the inverters.
Which connection types do data loggers use?
Loggers usually read devices over RS-485 Modbus. They reach the internet by Ethernet, Wi-Fi or cellular. Each model names its own set.
- RS-485 Modbus. SunSniffer Gateway 30-String: 3 channels, one reserved for inverters, Modbus RTU at 1200 to 115200 Bd. Fronius Datamanager: Modbus RTU, 2-wire, factory 9600 baud, 8 data bits, no parity, 1 stop bit. Solar-Log Base: 2 x RS485 or 1 x RS422. meteocontrol blue’Log XM/XC: 2 x RS485.
- Ethernet. Solar-Log Base: 2 x 100 Mbit/s, no switch function. meteocontrol: 1 x 10/100. Fronius: RJ 45, 100 Mbit. SolarEdge gateway: 10/100-BaseT.
- Wi-Fi. Fronius: IEEE 802.11b/g/n client. SolarEdge: listed, sold separately. SunSniffer: a Wi-Fi hotspot to reach the configuration server.
- Cellular. AlsoEnergy: a 4G cellular modem. SolarEdge: a cellular module, sold separately. Fronius advises a flat rate and, for mobile internet, a minimum of 3G with reliable signal. Not mentioned for meteocontrol or SunSniffer.
Worked example: data volume, buffer and timestamp error
This C&I example is assumed, not measured. The site has 12 inverters, 1 meter and 1 weather station. No company page gives a record size, so the field counts are assumed.
| Input | Value and basis |
|---|---|
| Fields per record | 40 per inverter, 30 per meter, 8 per weather station (assumed). |
| Bytes | 4 per field in binary, 20 per field in text such as JSON (assumed), plus an 8-byte header per device record. |
| One logging interval | 2,184 bytes binary, 10,472 bytes text. |
| Upload overhead | 1,000 bytes per message (assumed). A month is 30 days, a megabyte is 1,000,000 bytes. |
| Logging interval | Stored per day, binary (MB) | Cellular, binary, hourly upload (MB a month) | Cellular, text, upload every record (MB a month) |
|---|---|---|---|
| 15 min | 0.21 | 7.0 | 33.0 |
| 5 min | 0.63 | 19.6 | 99.1 |
| 1 min | 3.14 | 95.1 | 495.6 |
| 10 s | 18.87 | 566.8 | 2,973.5 |
As a check of scale, look at the Fronius manual. Its data volume per month table prints 8 MB for hourly upload on firmware up to 3.17. It adds 5 MB per extra inverter and 7 MB per extra Smart Meter. If the 8 MB covers one inverter, 12 inverters and 1 meter come to 70 MB (our reading). It does not state its logging interval or record size. Current firmware (3.25.2 onward) prints 350 MB in every row, so it cannot be scaled to this site and the example does not use it.
Buffer days are usable memory divided by stored bytes a day. We assume half the memory is usable. Solar-Log lists 4 GB internal memory. meteocontrol lists 16 GB, "> 100 days of data storage". The 64 MB row is our assumed small logger.
| Memory | 5 min (days) | 1 min (days) | 10 s (days) | 1 s (days) |
|---|---|---|---|---|
| 64 MB (assumed) | 50.9 | 10.2 | 1.7 | 0.17 |
| 4 GB (Solar-Log Base) | 3,179.7 | 635.9 | 106.0 | 10.6 |
| 16 GB (meteocontrol XM/XC) | 12,718.8 | 2,543.8 | 424.0 | 42.4 |
After a 7-day outage the logger holds 4.4 MB at 5 minutes. It holds 22.0 MB at 1 minute. At an assumed 64 kbit/s uplink, the backfill takes 0.15 h and 0.76 h. The 4 GB Solar-Log datasheet states storage of daily, monthly and annual values up to 10 years. It does not state intraday retention. No page states what a full buffer does.
The logging interval changes energy only when the logger stores single readings, not averages. The clear-sky model uses these inputs.
- Site and model. A 1 MWdc, 0.8 MWac plant at 25 degrees tilt, Denver-like, fixed UTC-7. pvlib 0.16.1 gave a clear-sky series. Linke turbidity 3.0 is assumed. Power is POA irradiance times 0.85, clipped at 800 kW.
- Result. The reference is the sum of 1-minute values. It is 2,130,809 kWh in a year. It is 7,084.8 kWh on 21 June and 3,774.7 kWh on 21 December. These are model values for clear days. They are not a yield estimate.
| Snapshot held for | Year error vs 1 min | 21 June | 21 December | Cloud day error, median (95th percentile) |
|---|---|---|---|---|
| 5 min | -2.0 kWh (-0.0001%) | +0.03 kWh (+0.0004%) | +0.03 kWh (+0.0009%) | 1.4% (4.2%) |
| 15 min | -2.6 kWh (-0.0001%) | -0.53 kWh (-0.0074%) | +0.03 kWh (+0.0009%) | 3.7% (10.9%) |
| 30 min | +12.7 kWh (+0.0006%) | -1.96 kWh (-0.0276%) | -0.95 kWh (-0.0252%) | 5.9% (16.8%) |
| 60 min | +2,092 kWh (+0.098%) | +14.33 kWh (+0.202%) | +12.14 kWh (+0.322%) | 8.8% (24.7%) |
- Cloud series. This is an assumed, synthetic two-state minute chain. Cloud spells average 4 minutes and clear spells average 12 minutes. Cloud passes 25% of the clear-sky power and covers about 25% of minutes.
- Snapshot error. The table shows means over 50 seeds. Annual snapshot error stays small and unbiased, from -0.61% to +0.68% at 15 minutes. Daily error is larger. Single days do not average out.
- Averages. A logger that stores averages kept all the energy. The trapezoid rule matched the end-of-interval snapshot. No company page says whether its stored values are averages or snapshots.
Check your own data budget
The calculator applies the same formulae to your devices, memory and outage. It refuses out-of-range values. Its three buttons load rows of the tables above. A second block repeats the timestamp test on a smooth half-sine day.
How solar software handles data logging
Three of the six documents state local storage outright, and none states a logging interval. Each row is rated only from the document named, read in October 2026. Product links open our profile of the company’s monitoring portal, not the datasheet.
| Product | Local storage documented? | Storage and interval stated |
|---|---|---|
| Solar-Log Base 15/100/2000 | Yes | 4 GB internal. Daily, monthly and annual values up to 10 years. No interval stated. |
| meteocontrol blue’Log XM/XC | Yes | 16 GB, "> 100 days of data storage". Up to 100 devices (XM) or 30 (XC). No interval stated. |
| Fronius Datamanager 2.0 | Yes | Memory capacity "up to 4096 days" in the technical data table. Upload hourly or daily. The manual’s "Calculating memory capacity" chapter gives the method: memory capacity in days = 2048 ÷ memory sectors per day, and memory sectors per day = total daily logging points ÷ 114. Its own worked example, 2 inverters and 1 sensor card at a 15-minute interval, gives 1,024 days, well under the 4,096 figure. We could not fully reconcile the two, so run your own device count through the formula rather than quoting 4,096 days as typical. |
| AlsoEnergy DataLogger | Partly | Internal storage, size not stated. No interval stated. |
| SolarEdge Commercial Gateway | Not stated | Neither stated. |
| SunSniffer Gateway 30-String | Not stated | Neither stated. |
Not stated: the document we cite does not say. Partly: it names storage but not its size.
- Solar-Log Base. Links named: 2 x RS485 or 1 x RS422. 2 x 100 Mbit/s Ethernet. 2 x USB. S0 input. Document read: Company product comparison datasheet, EN 08.2024, version 10.0.
- meteocontrol blue’Log XM/XC. Document read: Company data sheet, version 2025-12-17. Links named: 2 x RS485. 1 x Ethernet 10/100. Cellular not mentioned.
- Fronius Datamanager. Document read: Company operating instructions, footer code 032-02032026, no stated date. Links named: Ethernet. WLAN. Modbus RTU RS485.
- AlsoEnergy DataLogger. Document read: Company data sheet, undated, v22. Links named: RS-485, RS-232, Ethernet. 4G modem.
- SolarEdge Commercial Gateway. Links named: 2 x RS485. Ethernet 10/100. Wi-Fi and cellular modules sold separately. Document read: SolarEdge datasheet, footer "Date: 12/2020/V01/ENG ROW", read on a distributor site.
- SunSniffer Gateway. Document read: Company datasheet 2020V1, no date on the page. Links named: Ethernet RJ45. 3 RS485 channels, Modbus RTU. Wi-Fi for set-up only.
To compare the portals that receive logger data, see the best solar monitoring software list.
Common mistakes with data loggers
FAQs
Is a data logger the same as a gateway?
Usually, yes. Fronius calls its card a datalogger. SolarEdge calls its product an "All-in-one communication gateway". This page treats the words as one device that collects and forwards data.
How much cellular data does a solar data logger use?
About 20 MB a month for the assumed 14-device site at 5 minutes. Record size, interval and upload pattern move that figure a lot, and the worked example shows the range. The calculator takes your own inputs. Fronius recommends a flat rate.
How is a data logger different from SCADA?
A logger collects, stamps, buffers and uploads data. SCADA adds a historian and sends commands. These are working definitions for this page, and companies blur them. The table above sets the two side by side.
What happens to data when the internet drops?
The logger can keep writing to local memory, if its model does. Whether it covers the outage depends on memory and interval. Use the buffer-days table in the worked example.
Does a 15-minute interval lose energy?
No, not if the logger stores averages. Averages keep the energy. Snapshots are off by little on clear days and by more on cloudy ones. See the timestamp error table in the worked example.
Related terms
- SCADA: polls, stores and commands plant devices.
- Module-level monitoring: data below the inverter, on its own channel.
- Fleet monitoring: watching many sites in one portal.
- Solar monitoring software: a platform that collects and stores readings from PV sites.
Next step: work out your own cellular budget and buffer days in the calculator, then compare portals in the best solar monitoring software list.
Sources
- Solar-Log, product comparison datasheet, EN 08.2024, version 10.0 (checked October 2026). A Krannich-hosted Base 15V2 datasheet, EN 04.2026, version 12.0, shows the same memory and interfaces.
- meteocontrol, blue’Log XM/XC data sheet, version 2025-12-17 (checked October 2026).
- Fronius, Datamanager 2.0 operating instructions, no stated date (checked 30 October 2026).
- AlsoEnergy, data aggregation system hardware data sheet, undated, v22 (checked October 2026).
- SolarEdge, Commercial Gateway datasheet, footer "Date: 12/2020/V01/ENG ROW". Distributor site (checked 30 October 2026).
- SunSniffer, Gateway 30-String datasheet, undated (checked October 2026).
- Tigo Energy Intelligence pricing, undated, footer 2007 to 2026 (checked October 2026).
- pvlib python 0.16.1, used for the clear-sky series.
Last updated 30 October 2026. Next scheduled review: 30 January 2027.