Key takeaways
- LBNL’s 2026 edition (October 2026) reports that 96% of new US utility-scale capacity in 2025 and 92% of new projects used single-axis tracking. Its capacity sample was 139 GWac across 1,987 projects.
- Our isolated-array model (no row shading) gave single-axis tracking 24.5% more annual DC energy than best-tilt fixed in Phoenix and 17.7% in Des Moines.
- Dual-axis gave 39.8% and 34.9%, an upper bound.
- Single-axis tracking makes less than fixed tilt in January, November and December at both sites. In December it is 10.8% lower in Phoenix and 13.2% lower in Des Moines.
- In this example’s 10 MWdc example a tracker makes 17.4% more energy on 28.6% more land. It breaks even on simple cost at an 8.3% gain.
To model single-axis tracking with backtracking in software, see the best utility-scale solar design software.
Solar tracker at a glance
A tracker makes more energy per kWp, but it needs more land, adds moving parts and requires a wind-stow routine. Each comparison is against fixed tilt at the same site.
| Item | Detail |
|---|---|
| Formula | Gain = tracker energy ÷ fixed-tilt energy − 1, for the same site, weather year and losses. |
| Types | Fixed tilt (no motion), single-axis (one rotation) and dual-axis (two rotations). |
| Where it matters | Yield, land per MWdc, wind stow, cost and O&M. |
| Standard or rule | No single standard sets the gain. It depends on site, GCR, rotation limit and tariff. |
| In software | SAM, pvlib and HelioScope document single-axis tracking with backtracking. See Table 4. |
Why do solar trackers matter for installers and designers?
The tracker choice sets yield, land and risk at once. A wrong call changes the cost per lifetime kWh. Your design tool must also model it correctly.
Money: compare cost per lifetime kWh, not cost per watt. See LCOE. Timing: tracker output leans toward summer (Figure 1B), so test it against the tariff. See tariff rate database and net metering. Risk: wind stow, slopes and foundations sit in ground-mount design.
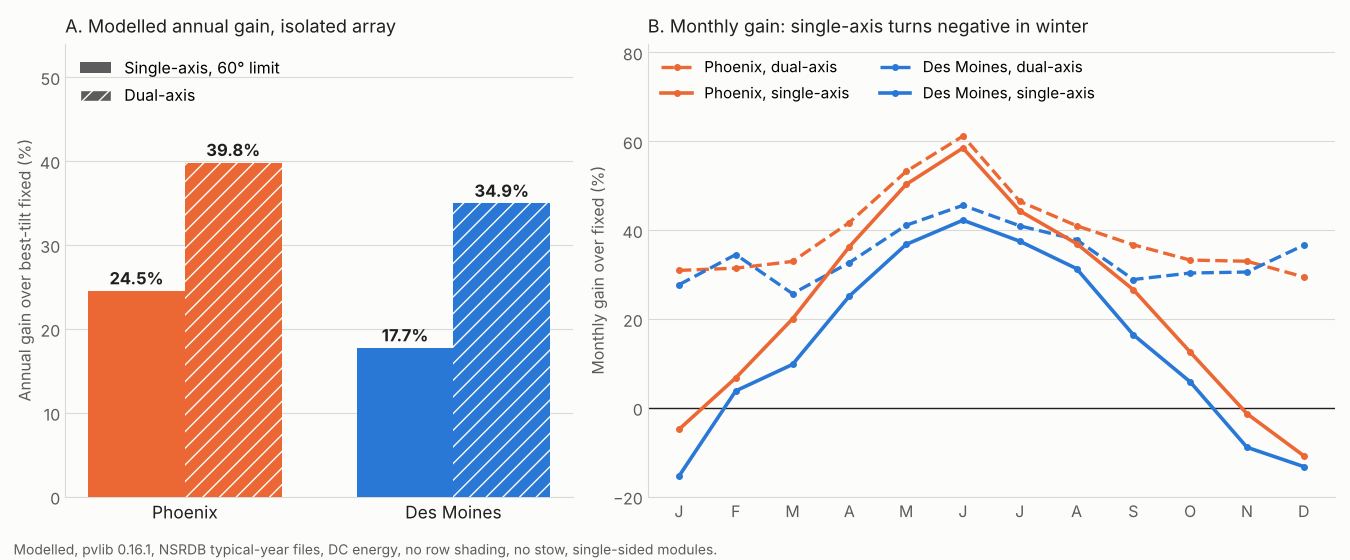
Figure 1. In our isolated-array model, single-axis tracking gains 24.5% and 17.7% a year but loses in winter. Dual-axis stays ahead in all 12 months.
How do fixed-tilt, single-axis and dual-axis trackers compare?
Fixed tilt does not move. Single-axis turns about one axis. Dual-axis follows the sun in both azimuth and elevation. Table 1 shows what changes.
Table 1. Three mount types. Gains are our modelled values for an isolated array (see Table 2).
| Type | Motion | Modelled annual gain (Phoenix, Des Moines) | Layout and wind notes |
|---|---|---|---|
| Fixed tilt | None. Faces south at one tilt. | Baseline | GCR sets row spacing. LBNL’s slides say fixed tilt is chosen mainly in edge cases such as challenging terrain or high wind loading. |
| Single-axis | One rotation, usually east to west about a north-south axis. pvlib also lets the axis tilt. | 24.5%, 17.7% | You need a rotation limit, row spacing and backtracking. Detail on the single-axis tracker page. |
| Dual-axis | Two rotations, pointed at the sun. | 39.8%, 34.9% (upper bound) | We did not model its spacing. Neighbouring units can shade each other, so spacing would cut the gain. |
How much more energy does a tracker make?
In our model a single-axis tracker makes 17.7% to 24.5% more annual DC energy than best-tilt fixed, and dual-axis makes 34.9% to 39.8% more. Sunnier Phoenix gains more.
Method
- We ran pvlib 0.16.1 hourly on the two NSRDB typical-year files from our single-axis page.
- Phoenix has 2,115 kWh/m² global horizontal and Des Moines 1,499.
- Each array stands alone, with no row shading or stow.
- Fixed faces south at the best whole-degree tilt from 0° to 60°.
- Single-axis has a horizontal north-south axis and a 60° limit. Dual-axis points at the sun.
- Albedo is 0.20. The temperature coefficient is -0.35%/K (our assumption). Modules are single-sided.
- Results are DC energy per kWp, before inverter, soiling, mismatch and wiring losses.
Table 2. Modelled annual DC energy for an isolated array (kWh per kWp), with gain over fixed tilt in brackets.
| Site (best fixed tilt) | Fixed | Single-axis | Dual-axis |
|---|---|---|---|
| Phoenix (32°) | 2,116 | 2,634 (24.5%) | 2,958 (39.8%) |
| Des Moines (36°) | 1,610 | 1,896 (17.7%) | 2,173 (34.9%) |
Dual-axis makes 12.3% more than single-axis in Phoenix and 14.6% more in Des Moines.
These single-axis gains are higher than the 19% and 12% on our single-axis page. That page includes row shading at stated GCRs. As a check, our isolated fixed and single-axis yields sit within 0.5% of that page’s model run at GCR 0.01. Both are our own models, so the check is not independent.
Fleet data point the same way, on a different basis. LBNL’s 2026 edition says tracking adds 5 percentage points to median capacity factor. It also says tracking adds 3 points within regions, and more in sunnier areas. LBNL uses AC capacity factors of real plants. We model DC energy for one row layout. So the two are a plausibility check, not a validation. For the effect of ground coverage ratio and backtracking, see the single-axis page.
Our model leaves out inverter limits, soiling, wind stow, tracker pointing error, snow and bifacial gain. It also uses one typical year per site, not a P50 or P90 range. See TMY and P50, P90, P99.
What do trackers change in land, wind, cost and O&M?
Trackers use more land, add a stow routine and add moving parts. LBNL’s 2025 project data show about the same cost per Wdc.
- Land: land is module area ÷ GCR. See ground coverage ratio and the worked example below.
- Wind and stow: trackers move to a safe angle in high wind. pv magazine USA (26 May 2022) reports an Arctech white paper at an unnamed site. It modelled 0.09% of generation lost for Arctech’s rigid tracker, 0.77% for a ‘traditional’ tracker and 4.17% for a hypothetical worst case. These are company-modelled cases, not fleet data.
- Cost: LBNL’s 2026 slides say 2025 tracking projects cost about the same as fixed-tilt projects. The slide gives USD 1.31 per Wdc for tracking and USD 1.30 for fixed tilt. Per Wac, tracking is cheaper (USD 1.69 against 1.72). The slide does not control for other cost factors.
- O&M: a tracker has drives and controls to inspect. See O&M. PVFarm’s blog (5 March 2026) ranks maintenance burden lowest for fixed tilt, moderate for single-axis and highest for dual-axis. It gives no data.
Worked example: 10 MWdc fixed tilt against a single-axis tracker
With example inputs the tracker makes 17.4% more energy on 28.6% more land. It is cheaper per MWh only if its gain beats 8.3%.
All inputs are example. Both plants use a 0.2176 kWp per m² module, the 425 W module on our ground-mount page.
| Input (example) | Fixed tilt | Single-axis tracker |
|---|---|---|
| Yield and gain | 1,800 kWh per kWp | 18% gain, less 0.5% for stow and downtime |
| All-in cost (USD per Wdc) | 1.20 | Adds 0.05 |
| GCR (as on our single-axis page) | 0.45 | 0.35 |
| Land (USD per acre) | 12,000 | 12,000 |
| O&M (USD per kWdc a year) | 7 | 9 |
The costs run over 25 years with no discounting. The 18% gain sits inside our modelled 17.7% to 24.5% range for an isolated array, but the single-axis page, which includes row shading, found 19% and 12%. The extra USD 0.05 is deliberately above the USD 0.01 per Wdc gap in LBNL’s 2025 data.
Table 3. Example 10 MWdc comparison.
| Item | Fixed tilt | Single-axis tracker |
|---|---|---|
| GCR | 0.45 | 0.35 |
| Energy (MWh a year) | 18,000 | 21,134 |
| Array-only land (acres) | 25.2 | 32.4 |
| Energy per acre (MWh) | 713 | 651 |
| Cost over 25 years (USD) | 14,052,825 | 15,139,347 |
| Simple cost per MWh (USD) | 31.23 | 28.65 |
Energy per acre falls 8.7%, yet cost per MWh falls 8.2%. The break-even gain is 8.3%. It rises to 15.4% if the tracker extra cost is USD 0.15 per Wdc. It rises to 9.9% if land costs USD 60,000 per acre. Stow at 0.09% or 4.17% (Arctech’s best and worst cases) moves tracker energy between 21,221 and 20,354 MWh a year. Cost per MWh here is simple, not an LCOE.
Tracker energy, land and cost calculator
Enter your own yield, gain, GCRs and costs. The calculator gives energy, land, energy per acre, simple cost per MWh and the break-even gain. Its defaults are the example inputs above and match Table 3.
How solar software handles solar trackers
Of six tools, SAM, pvlib and HelioScope document single-axis tracking with backtracking on the pages read, and only SAM documents dual-axis. Backtracking and row shading tied to GCR decide how far a single-axis result can be trusted, so a report should state which orientation and tracker settings it used. See PVsyst report. Rerun the inverter clipping check, because tracker output has a different daily shape.
Table 4. Tracker support in six tools, checked October 2026.
| Software | Single-axis | Backtracking |
|---|---|---|
| SAM | Yes | Yes |
| pvlib python | Yes | Yes |
| PVsyst | Partly | Not stated |
| HelioScope | Yes | Yes |
| PVcase Ground Mount | Yes | Not stated |
| PVFarm | Yes | Not stated |
"Not stated" means the pages read do not say, not that the tool lacks the feature. "Partly" means the page describes only part of it. Dual-axis support is not in the table: only SAM documents it. What each page says, by product:
- SAM: SAM help, System Design (no print date), lists tracking options Fixed, 1 Axis, 2 Axis, Azimuth Axis and Seasonal Tilt. Backtracking is "a one-axis tracking strategy that avoids row-to-row shading". "SAM uses the GCR to estimate self-shading losses for fixed and one-axis trackers".
- pvlib python: A code library, not an app. tracking.singleaxis takes axis tilt, azimuth, maximum angle, a backtrack switch and GCR (0.16.1 docs). The page names no dual-axis function.
- PVsyst: Help, "Orientations in PVsyst 8": a project can mix fixed and tracking systems, and "unlimited trackers" arrays are listed. Backtracking and axes are not described on the pages read.
- HelioScope: Single-axis trackers are an Enterprise-plan feature. Backtracking switches on or off in the Condition Set’s Trackers tab, but is not shown in the designer (help article, 19 September 2025). An 8 July 2025 article gives Basic and Pro users a workaround that adds a gain as negative soiling loss and does not model movement.
- PVcase Ground Mount: The single-axis layout article (updated 13 October 2026) covers pitch and a turning-angle range for the torque tube. It does not mention backtracking, GCR or yield.
- PVFarm: The help article on single-axis tracker creation (undated, © 2026) lists inputs such as total length, gaps and piles. A company blog (5 March 2026) says the tool models tracker layouts, GCR and yield. That is marketing.
For scored company comparisons, see the best utility-scale solar design software list and the best solar simulation software list.
Common mistakes with solar trackers
FAQs
Is a solar tracker worth it?
It is worth it when the extra energy outweighs the extra cost, land and O&M. Use the break-even gain. In our example it was 8.3%. LBNL reports single-axis tracking on 96% of US utility-scale capacity added in 2025.
How much more energy does a single-axis tracker make than fixed tilt?
Our isolated-array model gave 17.7% to 24.5% at two US sites. LBNL’s fleet data show about 3 to 5 capacity-factor points. Row spacing and your site set the real figure.
Is dual-axis better than single-axis?
Single-axis dominates US utility scale: LBNL reports 96% of 2025 capacity. Dual-axis makes more energy in our model, 12.3% more in Phoenix and 14.6% more in Des Moines for an isolated array. We did not model its spacing, cost or maintenance.
Do trackers cope with high wind?
They stow, which costs some energy. Arctech’s modelled stow losses ran from 0.09% (its own product) to 4.17% (a hypothetical worst case). LBNL’s slides say fixed tilt is chosen in some high-wind cases.
What should I check in a tracker simulation?
A good run states the axis, rotation limit, backtracking, GCR or pitch, and whether it modelled stow and tracker error. Compare the same site and weather year against fixed tilt.
Related terms
- Single-axis tracker: a tracker that rotates about one axis, with modelled gain and GCR detail.
- Backtracking: flattening a tracker at low sun to avoid row shade.
- Ground coverage ratio: module area relative to the ground it occupies.
Next step: See which tools model single-axis tracking with backtracking in the best utility-scale solar design software list, or the best solar design software overall.
Sources
- Published data: LBNL, U.S. Utility-Scale Solar, 2026 edition slides (October 2026). pv magazine USA, 26 May 2022 (Arctech modelled stow losses).
- Model: pvlib tracking.singleaxis (0.16.1). NSRDB typical-year files from NREL’s SAM repository.
- Tools: SAM help, System Design. PVsyst, Orientations in PVsyst 8. HelioScope, single-axis trackers. HelioScope workaround. PVcase, single-axis layout. PVFarm help. PVFarm blog, 5 March 2026.
All sources checked October 2026. The LBNL slides were re-opened on 30 October 2026 and match the figures above. Last updated 30 October 2026. Next scheduled review: 30 January 2027.