Key takeaways
- The PVsyst 7 tutorial describes 6 pages for a basic variant, 8 with shadings and up to 11 for detailed ones. A public V7.4.5 report ran to 8.
- PVsyst defines PR as E_Grid ÷ (GlobInc × Pnom). You can recompute it from the main results page in one minute.
- In our invented example (1,250 kWp), the printed PR is 85.5%, but the printed figures give 83.7%. The other four checks pass.
- PVsyst says loss parameters start at "reasonable default values". A report shows what was set, not why, so a reviewer should ask which values are defaults.
- P90 appears on the report only if you set it up. See P50, P90 and P99.
To get a report like this from another tool, see the best PVsyst alternatives and the best solar simulation software.
PVsyst report at a glance
The report sums up one simulation run in a fixed format. All of it comes from the inputs and the weather file you chose.
| Item | Detail |
|---|---|
| Core check | PR = E_Grid ÷ (GlobInc × Pnom), from PVsyst’s help page on the performance ratio. |
| Length | 6 pages basic, 8 with shadings, up to 11 (PVsyst 7 tutorial). The public example has 8 pages. |
| Where it matters | Financing files, technical reviews, EPC proposals, performance guarantees. |
| Standard or rule | No standard fixes the layout. It is PVsyst’s own format. PVsyst’s PR page cites IEC EN 61724 for the PR definition. It gives no clause. |
| In software | PVsyst prints it. SAM, HelioScope and PV*SOL document their own reports. See the software table below. |
Why does the PVsyst report matter for installers?
A reviewer holds this document when someone questions your energy figure. A wrong or stale number in it costs you a revision cycle.
It also prints weather file, albedo and loss settings together. A reviewer can then recompute the headline figures. See energy yield simulation for how the run works. See P50, P90 and P99 for the uncertainty side.
What sections does a PVsyst report contain?
A basic report has a cover and a summary. It also has a parameter page, main results, a loss diagram and special graphs. Shading and horizon pages appear when you use those inputs.
| Page (public V7.4.5 example, 8 pages) | What is printed |
|---|---|
| 1. Cover | Grid-connected system, client and author fields. |
| 2. Project and results summary | Site, albedo, meteo data, orientation, near shadings, user’s needs, module and inverter counts, Pnom ratio, produced energy, specific production, PR. |
| 3. General parameters and PV array | Orientation, models used, module and inverter models, array losses: soiling, thermal, DC wiring, LID, module quality, mismatch, IAM. System losses: auxiliaries. |
| 4. AC and transformer losses | Labels: AC wiring losses, MV transfo parameters, operating losses at STC. |
| 5. Horizon definition | Average height, diffuse factor, albedo factor, horizon profile, sun paths. |
| 6. Near shading | The shading scene and an iso-shadings diagram. |
| 7. Main results | Produced energy, specific production, PR, normalised productions, and a monthly table: GlobHor, DiffHor, T_Amb, GlobInc, GlobEff, EArray, E_Grid, PR. |
| 8. Loss diagram | Waterfall from global horizontal irradiation to energy injected into the grid. |
Page numbers depend on the source. In the public 8-page example, main results are page 7 and the loss diagram is page 8. In the tutorial’s basic 6-page report, they are pages 4 and 5, and the "special graphs" are page 6, including the daily input and output diagram. The public example’s page list has no special graphs page. Find the main results page by its title, not its number. No PVsyst 8 sample report is cited.
PVsyst 7 help lists optional pages. These are general and detailed parameters and a predefined results form. They also include the detailed loss diagram and any result graph or table. The last is the economic evaluation sheet.
The tutorial says you choose which parts to print. You can also add header comments. The PVsyst 8.1 help describes Report Preview (save as PDF, print, export, compare two variants). It does not list the pages. Its help pages are undated. The release notes list 8.1.8 on 26 October 2026.
How do lenders and technical advisers read a PVsyst report?
A reviewer can treat the printed numbers as claims to recompute. A good order starts with the headline and works back to the inputs. No lender or adviser checklist is cited, so this order is a suggested method.
- Read the cover and summary. Note the version, weather file, orientation, Pnom and Pnom ratio.
- From the main results page, recompute specific production (E_Grid ÷ Pnom). Then recompute PR (E_Grid ÷ (GlobInc × Pnom)).
- Follow the irradiation chain in the monthly table. PVsyst defines GlobEff as global irradiation left after horizon, near shading, IAM and soiling. For a monofacial array it should sit at or below GlobInc. Each step removes irradiation.
- Rebuild the loss diagram from its steps. The system loss diagram page shows the method and a worked rebuild of a public report.
- Check the inputs behind the losses, using the checklist below.
Step 2 has a basis trap. PVsyst’s guarantee page says simulated PR uses GlobInc, before horizon loss. It advises comparing measured PR with a forecast PR based on GlobHrz. See performance ratio.
What should you check in a PVsyst report before sending it?
These are the inputs that move the energy figure and are easy to leave at a default. The labels below are those printed in the public V7.4.5 example.
| Item | What to check | Where to read it |
|---|---|---|
| 1. Version | The printed version is the one you ran. Release notes list changes by version (8.1.0 to 8.1.8 from 15 April to 26 October 2026). | Cover, page footer |
| 2. Weather source and period | File name, source version and years, as in "Meteonorm 8.0 (1986-2005)". See weather data, TMY, Meteonorm. | Summary, meteo data |
| 3. Albedo | The value suits the ground. It matters most for bifacial rows. See albedo and bifacial modelling. | Summary, horizon page |
| 4. Soiling | The soiling loss has a stated basis, not just the default. See soiling. | Array losses |
| 5. IAM | The IAM loss factor and its profile match the module glass. See IAM. | Array losses |
| 6. Mismatch | Module and string mismatch are both set on purpose. See mismatch loss. | Array losses |
The next six items cover shading, equipment, availability, degradation and P50.
| Item | What to check | Where to read it |
|---|---|---|
| 7. Shading scene | The scene holds the site’s trees, rows and obstructions. HelioScope’s PVsyst export omits tree keepouts. See shading analysis. | Near shading page |
| 8. Module and inverter files | Model, unit power and counts match the datasheets and the bill of materials. See PAN and OND files. | PV array characteristics |
| 9. DC/AC | Pnom ratio equals DC kWp ÷ AC kW. See DC/AC ratio and inverter clipping. | Summary, inverter block |
| 10. Availability | Unavailability is a PVsyst loss type but not among the labels in the public report. Ask whether it is set. See availability. | System losses |
| 11. Degradation | The public report prints LID (light-induced degradation) but no long-term degradation label. State year 1 or year N. See degradation rate. | Array losses, notes |
| 12. P50 and P90 | PVsyst says the P50 "corresponds to the simulation output by default", but not for a specific-year weather file. Check which weather data was used. P90 shows only once uncertainties are entered. | Main results, if enabled |
PVsyst’s loss page says array loss parameters are "initially set to reasonable default values". It tells users to "carefully define each loss factor". Treat every default with no reason given as a question for the author.
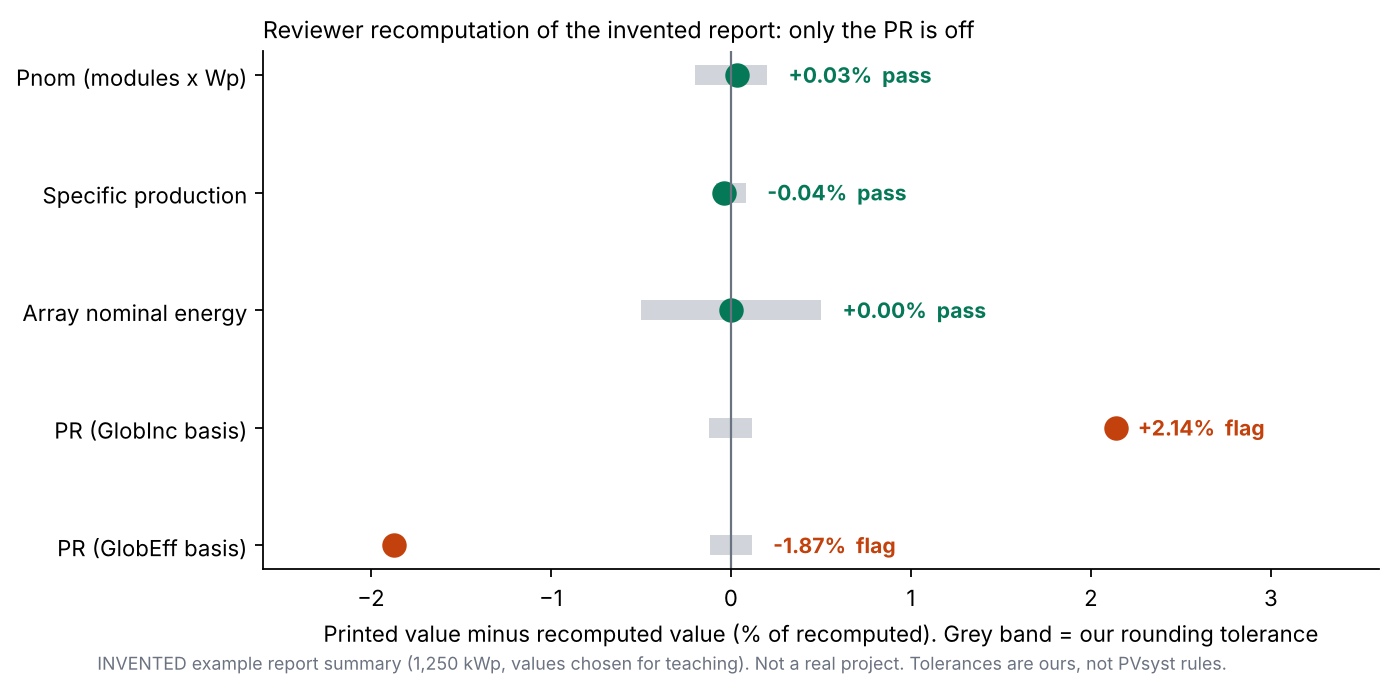
Figure 1. In an example report, four printed values recompute within tolerance, and the printed PR fits neither irradiation basis.
Worked example: a report reviewer applied to an example report
This is an example report summary of a 1,250 kWp array, written for teaching. It is not a real project. One printed figure is wrong on purpose. The other checks pass.
| Check | Printed (example) | Recomputed | Result |
|---|---|---|---|
| Pnom, 2,272 modules × 550 Wp | 1,250.0 kWp | 1,249.6 kWp | Pass (0.03% apart) |
| Pnom ratio, 1,250 kWp ÷ 1,000 kW AC | 1.25 | 1.25 | Pass |
| Specific production, E_Grid 1,519,300 kWh ÷ Pnom | 1,215 kWh/kWp | 1,215.4 kWh/kWp | Pass |
| PR, E_Grid ÷ (GlobInc 1,452.0 × Pnom) | 85.5% | 83.7% | Flag |
| PR if GlobEff 1,395.0 is used instead | 85.5% | 87.1% | Flag (neither basis fits) |
| Array nominal energy, GlobEff × Pnom | 1,743,800 kWh | 1,743,750 kWh | Pass |
Tolerances are our rounding allowances. They are 0.2% on Pnom and 0.1 point on PR. They are also 1 kWh/kWp on specific yield and 0.5% on array nominal energy. They are not PVsyst or lender rules.
The printed PR is 1.8 points above the recomputed value. If it were right, E_Grid would be 1,551,825 kWh. That is 2.1% higher than printed. In a real review you would ask the author which figure is wrong. Then you would re-run the variant. For the loss steps, see system loss diagram.
PR and specific yield checker
Enter values copied from a report. The tool recomputes specific yield and PR. It flags differences beyond rounding. Presets load the example.
How solar software handles the results report
Of the five tools we checked, PVsyst, SAM and HelioScope document a results report, and PV*SOL premium and Aurora Solar do so only partly. Partly: the page we read describes some report features but not a full report. The table asks about a results report, not only the loss diagram.
| Software | Documents a results report? |
|---|---|
| PVsyst | Yes |
| SAM | Yes |
| HelioScope | Yes |
| PV*SOL premium | Partly |
| Aurora Solar | Partly |
What each page says, and which page was read, is listed below.
- PVsyst: PVsyst 7 help: the report "holds an exhaustive table of all parameters used during the simulation, as well as a short description of the main results". The 8.1 help describes Report Preview with save as PDF, print, export and compare. Help pages undated. Release notes list 8.1.8 as "Published on October 26, 2026". Checked 30 October 2026.
- SAM: "Create report" (F6) makes a PDF from a report template. It may include inputs, results, graphs, tables, text and images. It is "not available for all configurations". Help page "Reports", no date or version shown. Checked October 2026.
- HelioScope: The production report has a Sources of System Loss chart and an Annual Production table with the same losses. Enterprise plans can export a shade scene for PVsyst (.dae). Tree keepouts are excluded and designs must be under 15 MW DC. Loss article posted 9 July 2025. Export article updated 4 August 2026. The Production Report Summary article is not cited. Checked October 2026.
- PV*SOL premium: The company product page says it can create project reports with simulation results in 24 languages and export Word or PDF. It lists a compact project report added in 2026 Release 1 (24 November 2025). Product page (metadata: last modified 30 September 2026), not the help manual. The report contents are not cited. Checked October 2026.
- Aurora Solar: Help describes the System Loss Diagram in Design Mode (updated 13 May 2026) and automatic simulation logs (updated 3 September 2026). Neither page describes a PDF simulation report. The Sales Mode proposal PDF article is not cited. Checked October 2026.
To compare tools that produce a yield report, see the best solar simulation software. To move off PVsyst, see the best PVsyst alternatives.
Common mistakes with the PVsyst report
FAQs
Does a PVsyst report include P90?
Only if you set it up. PVsyst’s P50-P90 page says the result appears on the report "if the parameters are correctly specified". It is not available for stand-alone or pumping systems.
Can I choose what goes in the report?
Yes. The PVsyst 7 tutorial says you choose which parts to print. You can add header comments. PVsyst’s PR page says the temperature-corrected PR shows only on request. It can be requested in the report preferences.
How do I check the PR in a PVsyst report?
Recompute it from the main results page: PR = E_Grid ÷ (GlobInc × Pnom). In the worked example, 1,519,300 ÷ (1,452.0 × 1,250) gives 83.7%, against a printed 85.5%. The check takes about a minute.
Is the PR in the report the PR I will measure?
No, not directly. PVsyst’s guarantee page gives a measured-PR formula. It says a fair comparison needs the same irradiance basis. It also says degradation starts in the first year. So a guaranteed PR may need to fall over time.
Related terms
- System loss diagram: the loss waterfall and why steps multiply.
- Performance ratio: the formula, its bases and seasonal swing.
- P50, P90 and P99: yield exceedance levels and how they are built.
- Bankable energy yield: the yield estimate a lender will accept.
Next step: to produce a yield report you can recompute, compare the best solar simulation software.
Sources
- PVsyst documentation: Results (checked October 2026).
- PVsyst: Normalised performance index (checked October 2026).
- PVsyst: Simulation variables, grid system (checked October 2026).
- PVsyst: Simulation variables, weather data and irradiations (checked October 2026).
- PVsyst: Performance ratio (PR) (checked October 2026).
- PVsyst: PR as performance guarantee (checked October 2026).
- PVsyst: P50 - P90 evaluations (checked October 2026).
- PVsyst: Array and system losses (checked October 2026).
- PVsyst: Project definition (checked October 2026).
- PVsyst: Preview a document (checked October 2026).
- PVsyst: Release notes (checked October 2026).
- PVsyst 7 help: Results (checked October 2026).
- PVsyst 7 tutorial: grid-connected system (checked October 2026).
- Public PVsyst V7.4.5 report, 4 March 2024, UK planning document (checked October 2026).
- SAM help: Reports (checked October 2026).
- HelioScope: How to troubleshoot losses and Export to PVSyst (.DAE) files (checked October 2026).
- PV*SOL premium product page (checked October 2026).
- Aurora: System Loss Diagram and Aurora Simulation Engine (checked October 2026).
Last updated 30 October 2026. Next scheduled review: 30 January 2027.