Key takeaways
- At 25° tilt and GCR 0.4, row shading costs 0.6% (Phoenix) and 1.3% (Des Moines) of energy on irradiance alone. At GCR 0.6 it is 1.5% and 3.4%.
- The best GCR depends on what land costs, with cable not counted. At 20 MWh per acre-year it is 0.35 to 0.45 in Phoenix and 0.35 to 0.425 in Des Moines.
- Land versus energy alone gives a shallow optimum. Moving GCR by 0.05 cuts net value by 0.02% to 0.23% of annual energy in our cases.
- Doubling block size adds 41% to DC cable per MWdc in our model. Raising GCR from 0.3 to 0.5 cuts it 23%.
- A 10% north-facing slope (ground falling to the north) lengthens the 9 am pitch by 27% (Phoenix) and 49% (Des Moines).
To compare tools that generate and rank plant layouts, see the best utility-scale solar design software.
Utility-scale layout optimisation at a glance
Layout optimisation weighs four costs against each other: land, shading loss, cable and civil works. The answer changes with land price and slope.
| Item | Detail |
|---|---|
| Levers | Row pitch and GCR, tilt, block size (MW per inverter station), cable routes, terrain handling |
| Objective | Lowest cost per kWh (see LCOE) for a fixed plant size on the available land |
| Where it matters | Site screening, land lease size, EPC pricing, grid-connection design |
| Standard or rule | No single standard. The design hour for shading, setbacks and slope limits are project choices |
| In software | Layout tools generate and compare options. Yield tools price the shading |
Why does layout optimisation matter?
Cable is paid for once. Land is a yearly lease or a one-off purchase. Shading loss recurs every year.
Tight rows save land and cable but raise shading loss, and string-level loss can exceed our irradiance figures. Loose rows do the opposite. Your job is to find the flat part of that curve.
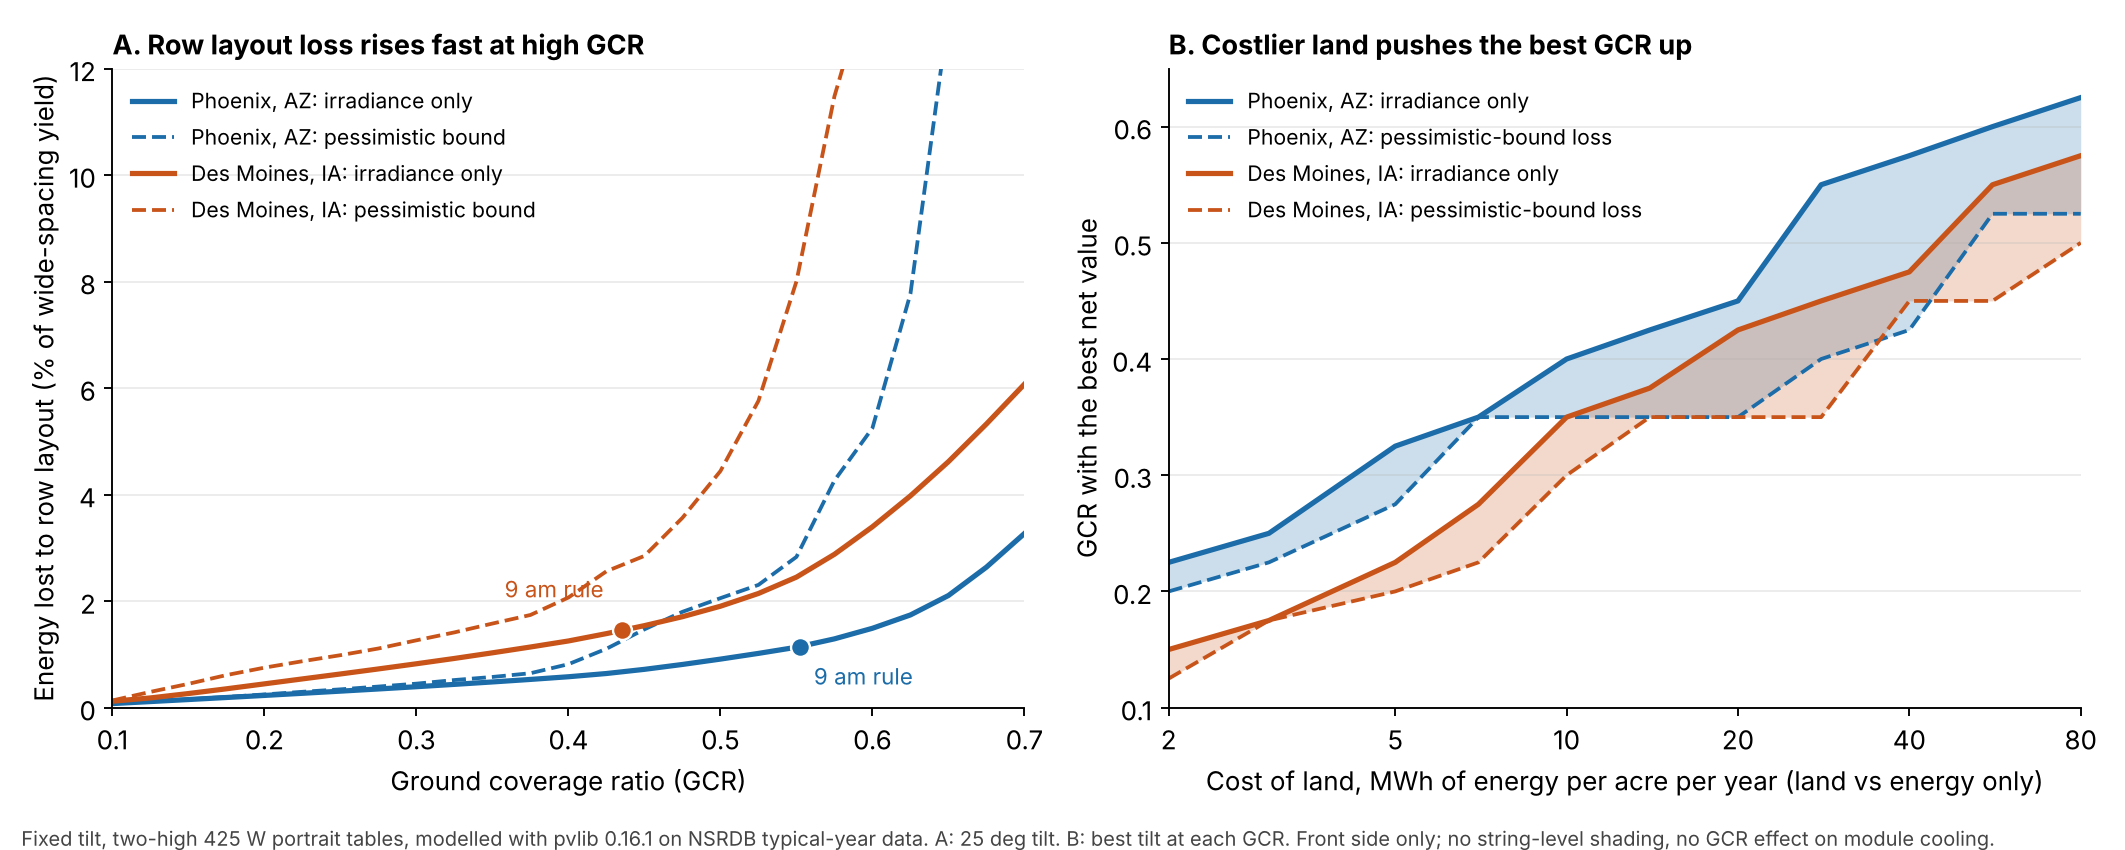
Figure 1. Irradiance-only row layout loss stays under 2% up to GCR 0.5 in both cities, and the GCR with the best net value rises as land gets dearer.
How is a layout optimised?
Pick a plant size, sweep the layout levers, price each option and keep the lowest cost per kWh.
- Fix the plant size in MWdc and the module and table size.
- Sweep pitch (or GCR) and tilt. Work out yield for each pair with row shading. See shading analysis and energy yield simulation.
- Convert pitch to land and cable. Land is module area divided by GCR. Cable follows block size and block shape.
- Add up costs: land, cable, stations, grading. Subtract them from the value of the energy.
- Check terrain, setbacks and string limits, then repeat.
Trackers add rotation and backtracking. See single-axis trackers. For the pitch formula and land density, see ground-mount design. For rooftop and small-array layout, see solar panel layout.
How much energy does a tighter layout cost?
The loss is small until GCR passes about 0.5, then it climbs fast. At GCR 0.4 the cost is 0.6% in Phoenix and 1.3% in Des Moines.
Method. We ran pvlib 0.16.1 (infinite-sheds row shading, front side only) on satellite-derived NSRDB typical-year files. Global horizontal is 2,115 kWh/m² in Phoenix and 1,499 in Des Moines. Tables are two-high 425 W modules in portrait (1.722 m wide each, 3.464 m slant length), fixed at 25° tilt.
We measure loss as DC energy against the same tilt at GCR 0.05, where, in Phoenix, yield is within 0.1% of a near-zero GCR.
The "pessimistic bound" adds all beam light in any hour with row shading, as if the whole string went dark. We did not test real strings, so read the two columns as two assumptions, not as limits on real loss. See mismatch loss.
| GCR | Land (acres per MWdc) | Phoenix loss: irradiance only / pessimistic bound | Des Moines loss: irradiance only / pessimistic bound |
|---|---|---|---|
| 0.3 | 3.78 | 0.4% / 0.5% | 0.8% / 1.3% |
| 0.4 | 2.84 | 0.6% / 0.8% | 1.3% / 2.1% |
| 0.5 | 2.27 | 0.9% / 2.1% | 1.9% / 4.4% |
| 0.6 | 1.89 | 1.5% / 5.3% | 3.4% / 13.9% |
| 0.7 | 1.62 | 3.3% / 21.2% | 6.1% / 24.4% |
At GCR 0.4, row shading costs 0.6% to 1.3% of energy on irradiance alone, or 0.8% to 2.1% with the pessimistic bound.
Land is array footprint only, from module area divided by GCR, at 0.2176 kWp per m² of module. The pessimistic bound is approximate: it adds the beam share to the irradiance loss.
A no-shade rule for 9 am on 21 December gives, at 25° tilt, GCR 0.55 in Phoenix and 0.44 in Des Moines. Pitch is 6.27 m and 7.95 m. The modelled loss there is 1.1% and 1.5% on irradiance alone.
What the model leaves out. NREL authors (Prilliman et al., IEEE PVSC 2022) report in the abstract a SAM result for Phoenix. Cutting fixed-tilt GCR from 0.46 to 0.35 can lift annual module energy by up to 1.7%. They link this to convective heat transfer. Our modules do not cool differently with GCR, so our curves favour tight rows slightly.
Where is the best GCR?
The best GCR rises as land gets dearer, and the range is narrow. It is the GCR where one more acre stops paying for itself. The break-even is the energy an acre must save each year, so we give land cost in MWh per acre-year.
Take a lease of USD 800 per acre-year and energy worth USD 40 per MWh. That is 800 ÷ 40 = 20 MWh per acre-year. Net value is energy minus land acres times that figure, for the same plant size.
Phoenix.
| Land cost (MWh per acre-year) | Best GCR | Tilt | Land (acres per MWdc) |
|---|---|---|---|
| 5 | 0.275 to 0.325 | 30° | 3.49 to 4.13 |
| 10 | 0.35 to 0.4 | 30° | 2.84 to 3.24 |
| 20 | 0.35 to 0.45 | 30° | 2.52 to 3.24 |
| 40 | 0.425 to 0.575 | 25° | 1.97 to 2.67 |
Des Moines.
| Land cost (MWh per acre-year) | Best GCR | Tilt | Land (acres per MWdc) |
|---|---|---|---|
| 5 | 0.2 to 0.225 | 35° | 5.05 to 5.68 |
| 10 | 0.3 to 0.35 | 30° | 3.24 to 3.78 |
| 20 | 0.35 to 0.425 | 30° | 2.67 to 3.24 |
| 40 | 0.45 to 0.475 | 25° to 30° | 2.39 to 2.52 |
Each cell spans the irradiance-only optimum to the pessimistic-bound optimum, searched on a 0.025 GCR grid with tilt from 10° to 40°. Costlier land and a kinder shading model both push GCR up. Figure 1B shows the range.
The optimum is shallow. Moving GCR by 0.05 either way from the irradiance-only optimum cuts net value by 0.02% to 0.23% of annual energy (net value in MWh). That covers 12 cases: two sites, three land costs, up and down. So pick a GCR in the flat part, then put your effort into cable and civil costs.
How do block size and cable length change the layout?
Bigger blocks save inverter stations but lengthen string cable. In our model, cable per MWdc grows with the square root of block size and falls with the square root of GCR.
Model: a square block with the station at the centre. Strings run along the grid, so the mean run is half the block side. Each string has two conductors and 28 modules (11.9 kWp). These are our assumptions. The model leaves out combiner boxes, row-end allowances, MV cable and ohmic loss. See cable routing and trenching and string sizing.
| Block (MWdc) | Stations per 100 MWdc | Conductor-metres per MWdc at GCR 0.3 | At GCR 0.4 | At GCR 0.5 |
|---|---|---|---|---|
| 2 | 50 | 14,707 | 12,737 | 11,392 |
| 4 | 25 | 20,799 | 18,013 | 16,111 |
| 8 | 12 | 29,415 | 25,474 | 22,785 |
| 16 | 6 | 41,599 | 36,026 | 32,222 |
The right block size balances station cost against cable cost, so you need your own prices. The calculator below finds it. Block size is also tied to the DC:AC ratio, which sets how many MWdc sit behind each station.
How does terrain change the pitch?
A north-facing slope (ground falling to the north) needs wider pitch. A south-facing slope allows closer rows. The effect is larger at higher latitude, where the winter sun is low.
For no shade at 9 am solar time on 21 December at 25° tilt, Phoenix needs a 6.27 m pitch on flat ground. It needs 7.98 m on a 10% fall to the north. The slope runs along the north-south line. On flat ground this is the formula on the ground-mount page. Sun elevation is 18.8° at Phoenix and 12.8° at Des Moines. Two ray tests, the second in compass coordinates, gave the same pitch to 0.001 m.
| Slope along north-south line | Phoenix pitch (change) | Des Moines pitch (change) |
|---|---|---|
| 10% fall to the south (south-facing) | 5.17 m (-18%) | 5.99 m (-25%) |
| 5% fall to the south (south-facing) | 5.67 m (-10%) | 6.83 m (-14%) |
| Flat | 6.27 m (0%) | 7.95 m (0%) |
| 5% fall to the north (north-facing) | 7.03 m (+12%) | 9.52 m (+20%) |
| 10% fall to the north (north-facing) | 7.98 m (+27%) | 11.85 m (+49%) |
This covers one slope direction with the table tilt fixed from horizontal. East-west slope, grading and foundations need a terrain tool. See terrain modelling.
GCR, land and cable calculator
Enter your energy value, land cost, cable and station prices. It lists net value for each GCR and finds the best block size. The defaults are placeholders, not market prices. It uses our two modelled sites, so run a full simulation for a real plant. With its default land, cable and station prices (shown in the form), the best GCR for Phoenix at 25° is 0.575. That is above the table range for the same land cost. Cable and station costs favour tighter rows, so they pull GCR up. The best-GCR tables above weigh land against energy only. If the frame does not load, open the GCR, land and cable calculator on its own page.
How solar software handles layout optimisation
Only PVcase Ground Mount is rated Yes for comparing pitch or GCR options. None of the four documents the whole loop of sweeping layouts and ranking them by cost.
| Software | Compares pitch or GCR and tilt options? | Ranks options by cost or LCOE? |
|---|---|---|
| PVcase Ground Mount | Yes | Not stated |
| RatedPower | Partly | Partly |
| HelioScope | Not stated | Not stated |
| PVsyst | Not stated | Not stated |
Not stated: the company page we cite does not say. Partly: the page describes only part of it. The notes below give the wording and source for each tool.
- PVcase Ground Mount: Capacity Iteration varies pitch, GCR or inner spacing, and optionally tilt, each with a from, to and step. It lists viable options with QuickYield results. It is described for fixed-tilt layouts. Source: PVcase help, updated 2 October 2026
- RatedPower:
- A May 2022 article says a batch tool creates up to 10 designs at different pitches. A comparison tool ranks them on energy, performance ratio, capacity and LCOE.
- The article says there is no set calculation for optimal pitch.
- The Power Analyst page says it varies pitch and DC:AC ratio and can target LCOE. It does not mention tilt, GCR or block size.
- Sources: RatedPower blog (May 2022). Power Analyst page (undated).
- HelioScope: Row spacing and GCR rules are on our ground-mount page. Moving combiner boxes or inverters recalculates wire distances and shows STC voltage drop per conductor. No GCR sweep is documented on the page cited. Source: HelioScope help, updated 9 July 2025, checked October 2026
- PVsyst: Unlimited orientations are an alternative way to include mutual shading. The "according to strings" option gives a rough estimate and upper limit for electrical shading. The tools page lists orientation and voltage optimisation, not pitch or GCR. Source: PVsyst help, shadings and tools pages, checked October 2026
Common mistakes with layout optimisation
FAQs
What is a good GCR for a fixed-tilt solar farm?
A good GCR is the one that suits your land cost and shading loss, so there is no single value. With land worth 20 MWh per acre-year, our two sites gave 0.35 to 0.45. Cheaper land favours lower GCR. Use the calculator to run your own numbers.
Does a lower GCR always raise profit?
No. Below the optimum, extra land costs more than the shading it saves. Our optimum was shallow: a 0.05 GCR shift cut net value by 0.02% to 0.23% of annual energy.
How does block size affect cable length?
Longer blocks mean longer cable. In our square-block model, doubling block size raises DC cable per MWdc by 41% and halves the number of stations. Cable per MWdc grows with the square root of block size and falls with the square root of GCR.
What is ground coverage ratio?
GCR is table slant length divided by row pitch. A lower GCR leaves more space between rows, so there is less shading but more land per MWdc. See ground coverage ratio.
Is layout optimisation the same as row spacing?
No. Row spacing is one lever. Optimisation also covers tilt, block size, cable and terrain. For the spacing formula, see ground-mount design.
Related terms
- Ground coverage ratio: table slant length divided by row pitch.
- Row spacing and pitch: the distance from one row to the next.
- Topography and terrain modelling: reading slope into a design.
Next step: find tools that sweep pitch or GCR in the best utility-scale solar design software, or see the best solar software for utility-scale developers.
Sources
All sources checked October 2026.
- Model and data. pvlib 0.16.1 (NREL SPA and infinite-sheds model). NSRDB typical-year files shipped with NREL’s System Advisor Model. Module: Qcells data sheet, Rev06 2025-03.
- Published check. Prilliman et al., NREL/PO-7A40-83033, IEEE PVSC 49 (2022).
- Guides read. PVFARM layout guide. RatedPower, pitch distance (May 2022).
- Software. PVcase Capacity Iteration. RatedPower Power Analyst. HelioScope, optimise conductor sizes. PVsyst help: shadings, tools.
Last updated 30 October 2026. Next scheduled review: 30 January 2027.