Key takeaways
- USGS 3DEP lists 1 m (project-based), 1/3 arc-second (about 10 m north-south) and 1 arc-second (about 30 m) grids. SRTM 1 arc-second is 30 m.
- On our synthetic site a 1 m grid flags 4.3% of cells over placeholder limits. A 10 m grid flags 0.6% and a 30 m grid 0.0%.
- At 35°N with a 9 am no-shade rule, a 10% north-facing slope lengthens pitch from 6.91 m to 8.97 m (+29.9%).
- A 10% south-facing slope shortens that pitch to 5.62 m (-18.7%).
- Makers state slope tolerance in different units and on different axes. Array says DuraTrack HZ v3 takes up to 26% north-south grades. Your limit is your own.
To find tools that read terrain, limit slope per axis and report cut and fill, see the best utility-scale solar design software.
Terrain modelling at a glance
Terrain modelling feeds four design decisions. They are where arrays go, how rows are spaced, how earth moves and how shade is judged.
| Item | Detail |
|---|---|
| Inputs | A DEM from lidar, drone photogrammetry or open data. A DSM (top surface) or DTM (bare ground) |
| Outputs | Slope, aspect, usable area, row pitch, cut and fill |
| Slope formula | Slope % = 100 × rise ÷ run. Aspect is the downslope compass bearing |
| Standard or rule | No universal slope limit. Racking and tracker models state their own |
| In software | Layout tools apply slope limits. Survey tools produce the model |
Why terrain modelling matters for installers
Terrain decides how much of a parcel is usable and what the civil work costs. A slope that looks gentle on a coarse map can still break a tracker limit. To compare tools that read terrain, see the best utility-scale solar design software.
In the northern hemisphere, a north-facing slope forces wider rows, so fewer kW fit per hectare. Grading can fix a slope but adds cost. A poor model hides the problem until the earthworks quote arrives. See earthworks and grading and ground-mount design.
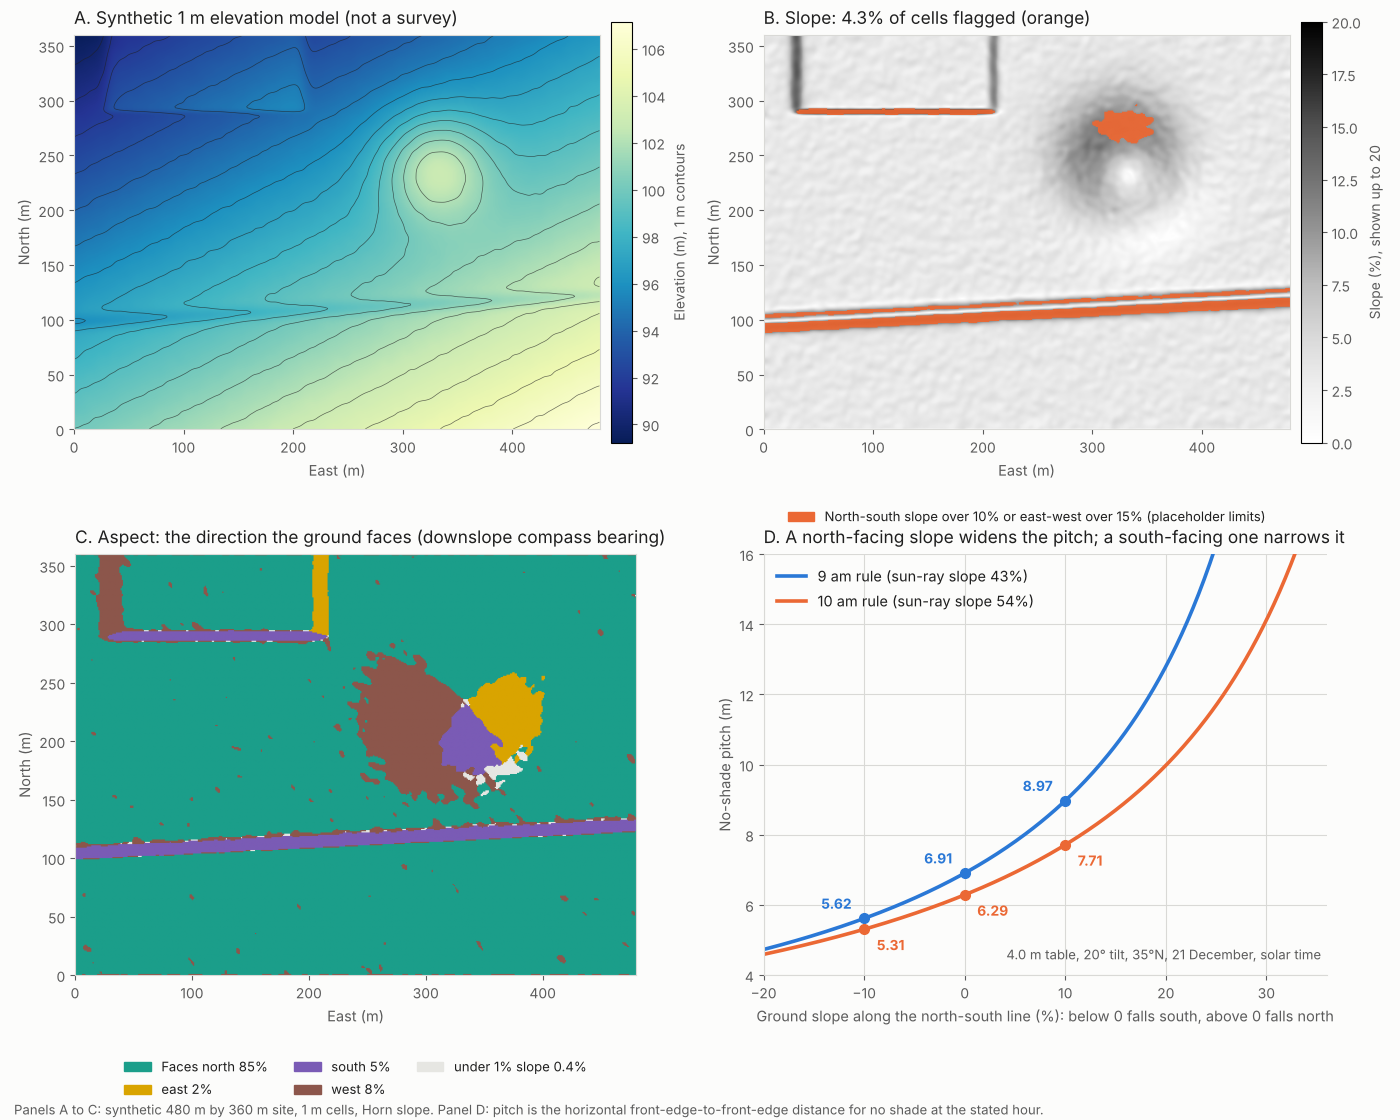
Figure 1. On our synthetic site a swale, a terrace step and a hill flank carry the flagged cells. A 10% north-facing slope lengthens the 9 am pitch by 30%.
What are DEM, DSM and DTM, and where do open ones come from?
A DEM is a grid of ground heights. A DSM records the top of whatever stands there. A DTM records bare ground. Grading needs a DTM. Tree shade needs a DSM.
The table lists open USGS grids at 1 m, about 10 m and about 30 m, plus two global models. Pix4D’s support page says that without point cloud classification, its DTM is a smoothed version of the DSM.
| Source | Grid | What the page says |
|---|---|---|
| USGS 3DEP 1 m | 1 m | Project-based, introduced in 2015 with limited US coverage. USGS says production of a continuous 1 m product (S1M) has been in progress since mid-2025. |
| USGS 3DEP 1/3 arc-second | about 10 m north-south | Covers the 48 states, Alaska, Hawaii and territories. East-west spacing varies. |
| USGS 3DEP 1 arc-second | about 30 m north-south | Covers the conterminous US and Alaska, and most of Canada and Mexico. |
| SRTM 1 arc-second (USGS EROS) | 30 m | Over 80% of land. Small voids filled, larger gaps interpolated. Flown 11 to 22 February 2000. The record does not say surface or bare earth and gives no accuracy figure. |
| Solargis terrain model | 3 arc-seconds (nominally 90 m) | Not open data: Solargis offers it through its own products. Built mainly from SRTM. Fine for regional analysis. Local shading needs a DSM or 3D model. |
USGS calls its lidar-derived 3DEP source DEMs bare earth. OpenTopography (2021) says the standard DEMs are the bare-earth surface. Neither page gives vertical accuracy. Your own survey is the other source: see lidar and drone photogrammetry.
How are slope and aspect calculated?
Slope is the steepest rate of height change in a cell. Aspect is the compass bearing of the downhill direction.
- Put heights on a regular grid with a known cell size.
- Take east-west and north-south gradients from each cell’s eight neighbours. We used Horn’s 3×3 weights.
- Slope % = 100 × the square root of the two gradients squared and summed. Slope angle = arctan of that ratio.
- Aspect = bearing of the downhill vector, clockwise from north. We tested it on four planes: ground falling north gives 0°, east 90°, south 180° and west 270°.
- Flag cells whose north-south or east-west gradient is over your limits.
Some tools report the uphill bearing instead, so check each tool’s convention. On our site 85% of cells face north, by construction.
How much DEM resolution is enough?
Enough that every feature you must flag spans several cells. On our synthetic site, coarser grids lost the flags, because averaging smooths short steep features. The first table shows the flags and the second the cost of missing them.
| Grid | Cells | Steepest cell | Cells flagged |
|---|---|---|---|
| 1 m (reference) | 172,800 | 26.8% | 4.3% |
| 5 m | 6,912 | 13.6% | 2.6% |
| 10 m | 1,728 | 11.7% | 0.6% |
| 30 m | 192 | 8.7% | 0.0% |
The next table shows usable area, missed flags and cut volume for the same four grids.
| Grid | Usable (ha of 17.28) | Flagged at 1 m but missed (% of site) | Cut m³ to level to one plane |
|---|---|---|---|
| 1 m (reference) | 16.53 | 0.0% | 40,684 |
| 5 m | 16.83 | 2.0% | 40,651 |
| 10 m | 17.18 | 3.8% | 40,583 |
| 30 m | 17.28 | 4.3% | 38,681 |
We made the coarse grids by averaging the 1 m surface. The placeholder limits are 10% north-south and 15% east-west. Tang, Pilesjö and Persson (2013), testing 0.5 to 5 m grids, also report lower estimated slopes at coarser resolution. We chose the swale and terrace widths. The 4.3%, 0.6% and 0.0% flagged at 1, 10 and 30 m show the mechanism, not a typical loss.
In the synthetic test, bulk volume barely moved (-4.9% at 30 m). So a coarse grid can still price earthworks roughly while missing slope breaches. Open 10 m data suits regional screening to exclude obviously steep land. On our one synthetic site it missed about 88% of the cells flagged at 1 m (3.8% of 4.3%), so it should not clear a site. Design on survey-grade data.
How does slope change row pitch?
In the northern hemisphere, ground that falls to the north (a north-facing slope) needs a wider pitch. Ground that falls to the south allows a narrower one. The row-spacing method is on the row spacing and pitch page. The north-south slope term is on utility-scale layout optimisation.
The example below also has an east-west term, because the morning sun sits to the east. It assumes 35°N and a 20° tilt.
At 35°N on 21 December, 9 am solar time, the sun is 17.7° high and 42.9° east of south. The sun-ray slope, T, is 0.435. So ground falling north at 43% runs parallel to the sun’s rays, and no shade-free pitch exists. The table assumes a 4.0 m slant length and a 20° tilt.
| North-south ground slope | Pitch, 9 am rule | Pitch, 10 am rule |
|---|---|---|
| 10% fall to the south (south-facing) | 5.62 m (-18.7%) | 5.31 m (-15.6%) |
| 5% fall to the south (south-facing) | 6.19 m (-10.3%) | 5.76 m (-8.5%) |
| Flat | 6.91 m (0%) | 6.29 m (0%) |
| 5% fall to the north (north-facing) | 7.81 m (+13.0%) | 6.93 m (+10.2%) |
| 10% fall to the north (north-facing) | 8.97 m (+29.9%) | 7.71 m (+22.7%) |
| 15% fall to the north (north-facing) | 10.55 m (+52.7%) | 8.70 m (+38.4%) |
With level north-south ground, a 10% rise to the east changes the 9 am pitch from 6.91 m to 7.76 m (+12.4%). A 10% rise toward the west gives 6.35 m (-8.0%).
Direction check. We did not rely on the formula for direction. A separate 3D ray march, using pvlib sun positions, found the same order. For 10% south-facing, flat and 10% north-facing ground it gave 5.61 m, 6.90 m and 8.96 m. Across 45 cases, including a southern-hemisphere mirror, the worst difference was 0.05 m.
Worked example: a synthetic 17.3 ha site
The site is 480 m by 360 m at 1 m cells, with 17.9 m of relief. It has a 3% fall to the north and a 1.5% rise to the east. It also has a hill, a swale and a terrace step. Latitude 35°N is assumed.
| Result | Value |
|---|---|
| Mean slope. 95th percentile | 4.3%. 10.4% |
| Cells flagged (north-south over 10% or east-west over 15%, synthetic site, placeholder limits) | 4.3% (0.75 ha) |
| Usable area | 16.53 ha (95.7%) |
| Mean 9 am pitch on usable cells | 7.53 m against 6.91 m flat |
| Row density on usable cells, against flat | 0.92 at 9 am. 0.94 at 10 am |
| Row density over the whole site | 0.88 at 9 am. 0.90 at 10 am |
Row density is flat pitch divided by local pitch, cell by cell. It is geometry, not energy, and ignores roads, setbacks and shade from the hill. Real rows hold one pitch per block, so use it for screening only.
Slope and row pitch calculator
Part 1 turns two contour lines into a slope and checks it against your limit. Part 2 gives the no-shade pitch on a slope for any latitude, hour, table and tilt.
If the frame does not load, open the slope and row pitch calculator on its own page.
What slope limits do tracker makers state?
There is no universal limit. Each model states its own, in percent or degrees, sometimes for one axis only.
| Model | Statement on the page | Source and date |
|---|---|---|
| Array Technologies DuraTrack HZ v3 | Up to 26% grades north-south, and up to 40° of combined angle east-west | Array blog, posted 28 May 2021, modified 14 April 2023 |
| Nevados All Terrain Tracker | Slope changes of up to 27% at each foundation and 37% overall, in any direction | Nevados page, undated |
| PV Hardware (model not named) | Up to 2° post-to-post, against a "more typical" 1.5° to 1.75° that the article does not attribute | Solar Builder, 11 August 2025 |
| Nextracker NX Horizon-XTR | Terrain-following on north-south undulations. The page gives no numeric tolerance | Nextracker page, undated |
These are company statements we did not test, and a current installation manual may differ. See single-axis trackers for backtracking.
How does terrain drive cut and fill?
Cut and fill is the earth removed and added to reach a design surface. Our synthetic site (placeholder 10% and 15% limits) needs about 40,684 m³ of cut and the same of fill to level to one fitted plane. That is an illustration, not a grading design.
How solar software handles terrain
Of the four layout tools below, only RatedPower documents sloped ground, slope limits and cut and fill together.
| Software | Sloped ground in layout? | Slope limits? | Cut and fill? |
|---|---|---|---|
| PVcase Ground Mount | Yes | Partly | Partly |
| RatedPower | Yes | Yes | Yes |
| PVFARM | Yes | Not stated | Partly |
| HelioScope | Partly | Not stated | Not stated |
Partly: the page covers some of it, not all. Not stated: the company page we read does not say.
- PVcase Ground Mount (page read: PVcase help, fixed-tilt layout, update stamp 13 October 2026): Topographic layout on a terrain survey, existing or proposed surface. Separate spacing limits for uphill, flat and downhill rows. No slope limit described. Optimised mode minimises cut and increases fill. No volumes stated.
- RatedPower (page read: RatedPower knowledge base, undated, input file types not stated): North-south, east-west, linked-row and undulation limits. Totals go into the Design Report and BOQ.
- PVFARM (page read: PVFARM FAQ, undated): Terrain-following trackers. Grading on existing or final terrain. Exports earthwork volume data such as LandXML. Method not described.
- HelioScope (page read: HelioScope help, independent tilt, stamp 10 July 2025, no terrain import described): Independent surface tilt for sloped ground.
For surveys, Pix4D’s support article describes making a DTM from a classified point cloud (page undated, checked October 2026). To compare more tools, read the list of best utility-scale solar design software.
Common mistakes with terrain modelling
FAQs
What DEM resolution do I need for a solar farm?
Match the grid to the smallest feature you must flag. Our test (synthetic site, placeholder 10% and 15% limits) lost most flags at 10 m and all at 30 m. Open 10 m data suits regional screening only. On our one synthetic site it missed about 88% of the cells flagged at 1 m, so do not treat it as clearance.
What slope is too steep for solar?
There is no single limit, because each racking or tracker model states its own, by axis. Array states 26% north-south for DuraTrack HZ v3. Check the installation manual for your model.
Is a north-facing slope bad for solar in the northern hemisphere?
It widens the no-shade pitch. In our example (synthetic site, placeholder limits), 10% north-facing ground raises the 9 am pitch by 30%. We did not model the energy effect.
Can I use SRTM or 3DEP for layout?
Use them for screening, not for layout. The SRTM record does not say whether heights are surface or bare earth. Its 30 m cells also smooth short slopes.
Related terms
- Earthworks and grading: moving earth to reach a design surface.
- Lidar: laser survey that supplies high-resolution terrain.
- GIS: the map software used to derive slope and aspect.
- Row spacing and pitch: how far apart rows sit, and why slope changes it.
Next step: when you shortlist, confirm a tool reads your terrain, limits slope per axis and reports cut and fill, using the best utility-scale solar design software.
Sources
- Data. USGS, About 3DEP products and services (checked October 2026). OpenTopography, 3DEP standard DEMs (2 September 2021). USGS, SRTM 1 arc-second global (record dated 2019-06-01). Solargis knowledge base, terrain models (updated 25 September 2026). Pix4D, generate a DTM. Tang, Pilesjö and Persson (2013), slope from raster data.
- Tracker limits. Array Technologies, DuraTrack terrain flexibility. Nevados, All Terrain Tracker. Solar Builder, PV Hardware slope tolerance. Nextracker, NX Horizon-XTR.
- Software. PVcase fixed-tilt layout. RatedPower topography and earthworks. PVFARM FAQs. HelioScope independent tilt.
- Model. Our own model script and ray-test script. Pvlib 0.16.1 for the sun-position cross-check. All site numbers are synthetic.
Last updated 30 October 2026. Next scheduled review: 30 January 2027.