Key takeaways
- Specific yield removes site size but not weather, so a dull-climate site can look faulty. Actual against expected output removes both.
- In our synthetic 40-site fleet, one of three inverters was off at a 1,254 kWp site. Raw kWh ranked it 39th lowest of 40. Expected vs actual ranked it lowest.
- Over 12 reviews of 30-day windows, flagging the bottom 4 sites each time, expected vs actual covered all 16 real-loss site-windows. Raw kWh covered 3 and specific yield 1.
- A rule of "below 85% of expected for two days" gave 41 alert episodes at five sites in a year. 18 were real losses and 23 were false. It missed an 8% loss.
- A site with no data drops out of a ratio ranking. One 30-day outage left no ratio at all, so add a separate no-data rule.
To rank your own sites in software, see the best solar fleet monitoring software for installers.
Fleet monitoring at a glance
A fleet view turns many sites’ readings into one ranked list, so a person can pick which sites to check first.
| Item | Detail |
|---|---|
| Five jobs | Aggregation, site ranking, alert triage, normalised figures, ticket handoff. |
| Normalised figures | Specific yield (kWh per kWp), performance ratio, and actual divided by expected energy. Raw kWh is not normalised. |
| Data needed per site | Size in kWp, tilt, azimuth, location, timestamps, a status flag and an expected-energy source. |
| Standard or rule | No fleet-monitoring standard found on the pages read. Alert limits are set by the operator. |
| In software | Monitoring portals with a multi-site view. See the table below. |
Why fleet monitoring matters for installers
A ranked list sends the van where it is needed.
It also protects service revenue. An O&M contract promises response times, so the list must show every failed site. See O&M. Alert rules for a single site are on alerts and alarms.
Why must sites be normalised before they are ranked?
Sites differ in size, tilt and weather, so kWh alone ranks size and climate. A fair ranking divides by expected output.
- Raw kWh: energy over a period. It follows size. Do not use it to rank health.
- Specific yield: kWh divided by kWp. It removes size but not weather. See specific yield.
- Performance ratio: energy divided by nameplate output at the sunlight received. It removes size and sunlight. Basis details are on performance ratio.
- Actual divided by expected: uses a model, such as pvlib, fed with each site’s weather, tilt and azimuth. See expected vs actual production.
In our synthetic fleet, the median healthy site in the sunniest invented climate yielded 1,480 kWh per kWp a year. In the dullest it was 765, or 48% lower. In this fleet, a specific-yield list would mark the dull climate down for weather alone.
What data does a fleet view need?
It needs the same few fields from every site. A ratio is only as good as the tilt, azimuth and kWp on record.
- Site record: kWp, tilt, azimuth, location and commissioning date.
- Readings: energy per interval with time zone, and a flag for missing data. Intervals are set by the logger.
- Weather: a site sensor or a satellite-derived series. Note which one you use, because satellite data is modelled.
Worked example: 40 synthetic sites, eight injected events
We built a synthetic fleet with pvlib and injected eight events. All numbers below are example. We used no real plants or weather. In this fleet of 40 sites, the largest is 292 times the smallest, so raw kWh ranks size, not health.
The fleet has 22 residential, 14 commercial and 4 large C&I sites across five example climates. Sizes run from 4.3 to 1,253.9 kWp (6,011.7 kWp in all). Weather is pvlib clear-sky scaled by a made-up daily clearness index.
Expected output uses the same physics as actual output, with a 3.5% optimistic loss factor and its own irradiance error. These rankings and alert rules are untested on real fleets.
| Setting | Value |
|---|---|
| Loss factor | 0.86 actual, 0.89 expected |
| As-built spread | 2% |
| Daily noise | 1% |
| Expected irradiance error | 3% plus 2% |
The table gives each event’s rank among 40 sites (1 = lowest) in the 30 days from its start. A rank of 4 or less is in the bottom 4.
| Event (site size, kWp) | Real energy loss? | Raw kWh rank | Specific yield rank | Expected vs actual rank |
|---|---|---|---|---|
| F1 one of three inverters off (1,254) | Yes | 39 | 9 | 1 |
| F2 open string, 8% loss (219) | Yes | 35 | 13 | 3 |
| F3 12% soiling-type loss (5.1) | Yes | 3 | 16 | 1 |
| F4 export limit, curtailment (116) | Yes | 27 | 6 | 1 |
| F5 no data for 30 days (9.2) | No | 1 | 1 | No value |
| F6 no data for 15 days (92) | No | 24 | 1 | 12 |
| F7 reference sensor reads 20% high (244) | No | 36 | 18 | 1 |
| F8 platform azimuth 180, roof faces 100 degrees (4.3) | No | 4 | 32 | 1 |
F4 is curtailment: a real loss of energy, but a grid limit, not a fault. In F3, raw kWh ranks the site low only because it is tiny, and expected vs actual ranked it first among the 39 sites with a ratio. F5 has no ratio because no day reported.
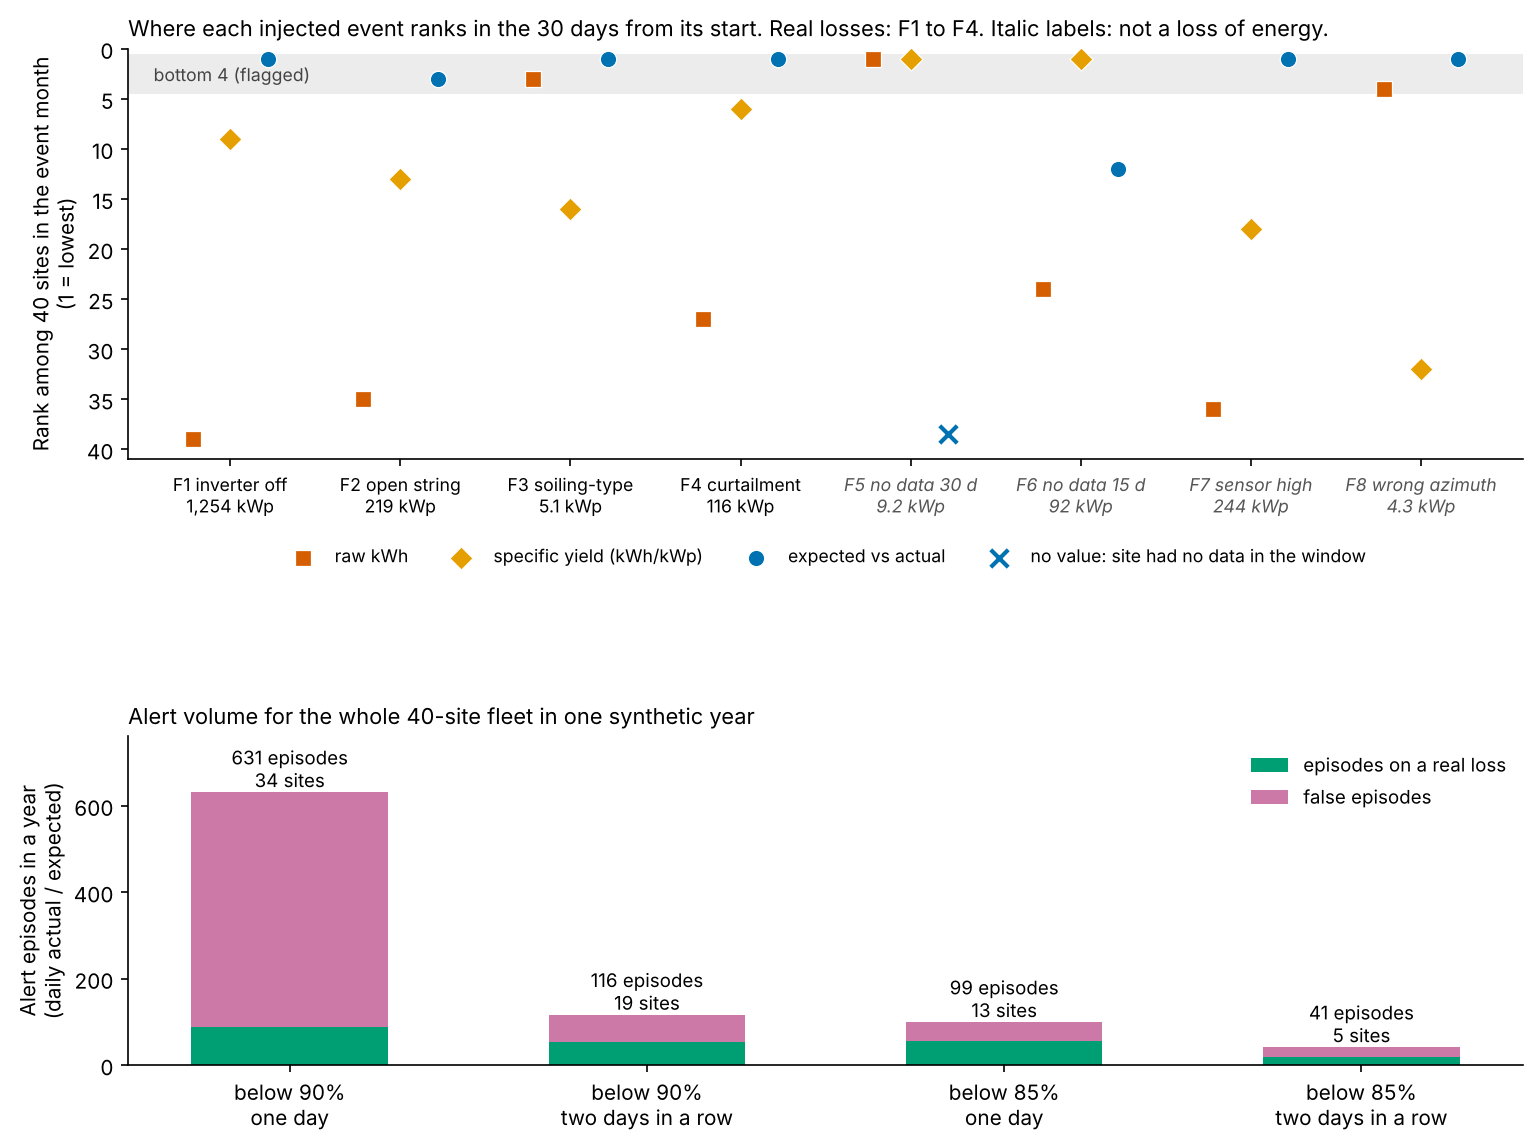
Figure 1. In a synthetic 40-site fleet, expected vs actual put all four real losses inside the bottom 4. Raw kWh ranked the 1,254 kWp inverter fault 39th lowest of 40. Requiring two days in a row and an 85% threshold together cut episodes from 631 to 41 but missed one real loss.
We also ran 12 reviews of 30-day windows, flagging the bottom 4 sites each time. There were 16 site-windows with a real loss. Expected vs actual put all 16 in the bottom 4. Raw kWh put 3 there, and specific yield 1. 40 of raw kWh’s 48 flag slots went to the eight smallest sites.
The alert rule compares daily actual with expected. It skips days with no data and days with expected energy under 0.5 kWh per kWp. An episode is a run of low days. A false episode has no real-loss day in it, so the sensor and metadata errors count as false.
| Rule (actual / expected) | Episodes in a year | Real and false episodes | Real losses caught |
|---|---|---|---|
| Below 90%, one day | 631 at 34 sites | 87 on a real loss, 544 false (510 from noise alone) | 4 of 4 |
| Below 90%, two days in a row | 116 at 19 sites | 53 on a real loss, 63 false (48 from noise alone) | 4 of 4 |
| Below 85%, one day | 99 at 13 sites | 56 on a real loss, 43 false (8 from noise alone) | 4 of 4 |
| Below 85%, two days in a row | 41 at 5 sites | 18 on a real loss, 23 false (0 from noise alone) | 3 of 4 |
The 85% two-day rule missed F2, the 8% open string. A healthy site averaged 0.969, so an 8% loss reads about 0.89. The other rules caught it, with more noise-only episodes. At 85% over two days, the 23 false episodes came from the two non-loss events, F7 and F8. The curtailed site alerted 12 days after the export limit began, because the limit only cuts output on bright days.
How does fleet monitoring fail?
In our example it failed three ways: offline sites vanished from the ranking, alerts flooded, and baselines were wrong.
- Offline-site blindness. In the example, a site with 30 days of no data had no ratio, so that view could not rank it. Raw kWh and specific yield ranked it lowest only because the missing days added no energy. A separate rule for "no data for N hours" fires on the first missing day.
- Alert floods. A one-day 90% rule gave 631 episodes at 34 of 40 sites, 510 from noise alone. Requiring two days in a row alone cut it to 116, and an 85% threshold alone cut it to 99. Both together gave 41, at the cost of one missed 8% loss. The 41 episodes of the 85% two-day rule came from 5 sites, so 5 tickets.
- Mismatched baselines. The sensor reading 20% high (F7) and the wrong azimuth on record (F8) produced 23 false episodes. The azimuth error sat in the bottom 4 in 10 of 12 expected-vs-actual reviews. Raw kWh flagged that tiny site in 12 of 12. The fix is a data correction, not a repair. A specific-yield rule at 85% of the fleet median flagged 96 of 480 site-windows, 2 of them real.
Count the sites that need review
The calculator takes one row per site for one period and counts sites below your threshold. The first button loads the synthetic fleet for days 150 to 179. It finds 3 sites by expected vs actual, 13 by specific yield and 17 by raw kWh. Of those 3, two are real losses and one is a high-reading sensor.
Ratios above 130% are listed for a data check. The default minimum is 1 kWh per kWp expected over the period, and you can change it.
How solar software handles fleet monitoring
Of the six tools, only AlsoEnergy and Solar-Log document both a full cross-site comparison and an alert-to-ticket route on the pages we read. VCOM lists a ticket system but not alarm-to-ticket creation. Each cell is rated only from the pages named, read in October 2026.
| Software | Multi-site view documented? | Cross-site comparison or normalised figure documented? | Alert to ticket or task documented? |
|---|---|---|---|
| Victron VRM | Yes | Partly | Not stated |
| SMA Sunny Portal (ennexOS, with Data Manager) | Yes | Partly | Not stated |
| AlsoEnergy PowerTrack | Yes | Yes | Yes |
| Solar-Log WEB Enerest 4 | Yes | Yes | Yes |
| meteocontrol VCOM Cloud | Yes | Partly | Partly |
| Enphase Enlighten | Partly | Not stated | Not stated |
What each page says:
- Victron VRM: Fleet Dashboard needs "at least 10 sites". Sites with an active alarm are shown first. A widget "compares actual kWh produced at each site with the forecasted solar yield over the past 24 hours". No specific yield or PR on the pages read. Pages read: VRM manual, "managing multiple installations" (no date printed). Victron blog, 4 April 2025.
- SMA Sunny Portal (ennexOS, with Data Manager): "Energy monitoring of several systems with 1 user account" and "Creating system groups". It lists "Calculation of a performance ratio and alert in case thresholds are exceeded" and "Display and configuration of an expected yield". Comparing plants is not mentioned. Pages read: SMA manual feature table (no date printed).
- AlsoEnergy PowerTrack (pages read: two PowerTrack fliers, no date printed): users can "prioritize sites that are experiencing the most severe energy losses". Reports list "expected versus actual modeling" and "actual versus weather-adjusted energy production". It offers "CMMS integration for work orders" and "hand off faults and create work orders". Its view: "The Portfolio View allows you to zoom out for a higher-level look at your entire portfolio."
- Solar-Log: "Control centre: central overview of your portfolio." KPIs include "Specific yield (day, month, year)". The analysis module can "Compare components across plants". It can "Convert alarms to tasks for tracking purposes." Pages read: datasheet, EN 04.2026, version 6.0.
- meteocontrol VCOM Cloud: pages read are the VCOM monitoring page (no date printed) and the PR comparison chart help page, last modified 2026-07-22. Also listed are "Performance ratio as per IEC 61724-1" and "Comparison of target/actual values". The PR chart help page covers one system. It also lists a "ticket system" and "Ticket statistics". Alarm-to-ticket creation is not stated. Overview: "Operations overview – tabular display of the key performance indicators for all systems."
- Enphase Enlighten: the Enphase installer newsletter of July 2023 says the Fleet Management Dashboard lets you "filter sites, analyze systems issues, and coordinate service". It is the only Enphase source read, so confirm the current dashboard on Enphase’s site.
Not stated means the pages read do not describe it. Partly means the pages describe a narrower feature than the column asks. These ratings answer fleet questions only. They can differ from alerts and alarms. A SolarEdge portal guide (distributor copy, no version printed) lists only a per-account site list. Neither is rated. For plant-level dashboards and alerts, see the best solar monitoring software.
Common mistakes with fleet monitoring
FAQs
What is the difference between fleet monitoring and SCADA?
Fleet monitoring compares and triages many sites by actual against expected output. SCADA polls, stores and commands the devices inside one plant, so the two work at different levels. See SCADA for the plant side.
How many sites do you need before fleet monitoring pays off?
No standard sets a number, so test it yourself: if you cannot look at every site’s output each week, you need a ranked list. One company example is Victron’s Fleet Dashboard, which needs an account linked to at least 10 sites.
What should I rank sites by instead of kWh?
Rank by actual divided by expected energy for the same period and weather, and show data coverage beside it. Specific yield is a simpler fallback, but it can flag dull climates.
How do I stop alert floods?
Require two days in a row and use an 85% threshold. Skip days with little expected energy and days with no data. Group alerts into one ticket per site. In our example, the two-day rule alone cut 631 episodes to 116. With 85% as well, it was 41, but one 8% loss was missed.
Related terms
- Alerts and alarms: rules that turn site data into messages.
- Performance ratio: output compared with nameplate at the sunlight received.
- Module-level monitoring: readings below the inverter.
Next step: shortlist tools that rank sites by actual against expected energy in the best solar fleet monitoring software for installers.
Sources
- Victron, VRM Portal manual, managing multiple installations (no date printed, checked October 2026).
- Victron, New on VRM Fleet Dashboard, 4 April 2025 (checked October 2026).
- SMA, Sunny Portal powered by ennexOS feature table (no date printed, checked October 2026).
- AlsoEnergy, PowerTrack flier and Performance Engineer flier (no issue date printed, checked October 2026).
- Solar-Log, WEB Enerest 4 datasheet, EN 04.2026, version 6.0 (checked October 2026).
- meteocontrol, VCOM monitoring (no date printed) and PR comparison chart help page, last modified 2026-07-22 (checked October 2026).
- Enphase, installer newsletter, July 2023 (checked October 2026).
- SolarEdge Monitoring Portal User Guide, distributor copy, no version printed, and SolarEdge press release, 17 June 2024 (checked October 2026). Neither is rated in the table.
- Fronius, partner programme help page (checked October 2026). Not rated.
- Synthetic fleet: pvlib 0.16.1 (Ineichen clear-sky model, Haydavies transposition, PVWatts DC and inverter models), fixed random seed 2026.
Last updated 30 October 2026. Next scheduled review: 30 January 2027.