Key takeaways
- In our simulation, a 30% loss on one of 24 modules reads 30.7% low at module level but only 2.6% low at string level. All figures here use one set of assumed noise levels.
- With MLPE, the inverter read 1.3% low (z = -0.4), while the faulty module read z = -16.5. Module data comes from optimisers, microinverters or add-on devices.
- With a string inverter and monitor-only devices, the module read 0 W. The string read 8.7% low (z = -5.7) and the inverter 4.4% low.
- At z = 3, the smallest single-module loss flagged was 4% for monitor-only devices, 6% for MLPE and 13% for string comparison.
- On 24 healthy modules over 30 days, a 6% threshold held for two days gave under 0.001 false alerts a month. A 4% one-day threshold gave 11.2.
Module-level monitoring at a glance
It adds a measurement at every module. You then compare a faulty module with its peers. It no longer hides in a string total.
A z-score says how many noise standard deviations a reading sits from its peers. The page uses z = 3 as the alert line.
| Item | Detail |
|---|---|
| Core idea | Deviation = (module reading minus peer median) divided by peer median. Alert when it stays below a set limit. |
| Typical data | Tigo lists power, energy and reclaimed energy at 15 minutes (free tier). It lists voltage, current and signal strength at 1 minute (paid tier). |
| Where it matters | Service dispatch and O&M. |
| Standard or rule | No standard for module alert limits is stated on the pages read. |
| In software | Company monitoring platforms. See the table below. |
Why module-level monitoring matters for installers
It tells you which module to visit. A string or inverter total can look normal while one module loses output.
Fraunhofer IFF said in April 2026 that inverter-level measurements "miss or often only detect certain fault types with a delay". It also said faulty electrical connections "frequently go undetected". That is a project claim, not a test result.
Each fault costs little. In our June model, a 30% current loss on one module cost 0.51 kWh a day. That is 1.3% of the array. Site performance ratio would fall by the same 1.3%. In our model, noise of 3.0% at the inverter can hide that.
How does module-level monitoring work?
A small device at each module measures its output. It sends the data through a gateway to a cloud platform. There are three hardware routes.
- Optimisers: a power optimiser already sits on the module. SolarEdge’s 2019 note lists these for each optimiser: energy, input and output voltage, input current and temperature.
- Microinverters: each microinverter reports on its own module. Enphase’s page says a non-producing module is "shown as blacked out".
- Add-on monitoring devices: some MLPE units measure only. They do not optimise. The MLPE page covers the hardware. Tigo’s page lists a Cloud Connect Advanced and an access point as "Required" for its TS4-A-S unit, which it describes as enabling monitoring and rapid shutdown.
Data reaches the platform through a data logger or gateway. Tigo’s help centre says its Management Unit or Cloud Connect needs an internet connection to send data. For many sites at once, see fleet monitoring. This page covers one array.
What can module-level monitoring detect that string or inverter monitoring cannot?
It can detect a fault too small, as a share of the total, to lift a string or inverter reading above noise.
- Soiling or shade on one panel: one dirty module is one of 24 in our array. See soiling.
- Wiring and connector faults: Fraunhofer says faulty electrical connections frequently go undetected.
- Bypass diode problems: SolarEdge alert 72, "Module voltage mismatch", names "potential bypass diode failure".
- Dead or silent modules: SolarEdge alert 74 is "No communication with Power Optimizer".
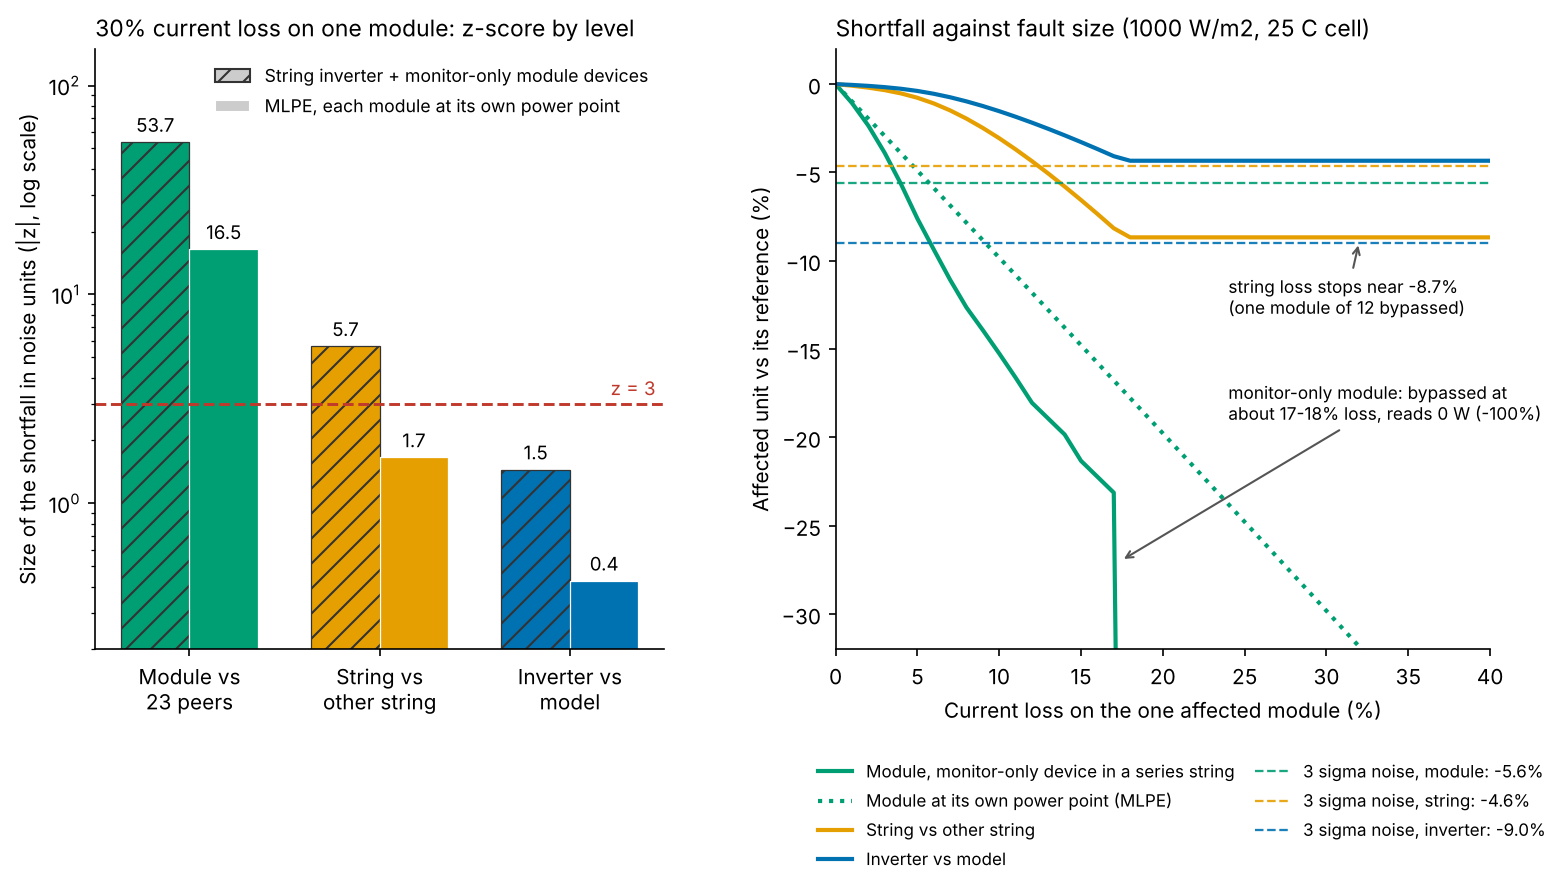
Figure 1. In a simulation with assumed noise, only module-level comparison flagged a 30% single-module loss in both setups. String comparison flagged it only when the module was bypassed.
Worked example: one faulty module in 24
This is a simulation. Expected and actual values come from one pvlib model plus chosen noise. Real sites may show different false-alert rates. In the MLPE case, the 30% loss read z = -16.5 at module level and -0.4 at inverter level.
| Setup item | Value |
|---|---|
| Module | Canadian Solar CS6X-315P, 72-cell polycrystalline, 315 W, Vmp 36.6 V, Imp 8.61 A, Voc 45.1 V, Isc 9.18 A. |
| Module source | Datasheet V5.3_EN, August 2015, international variant. A pvlib 0.16.1 CEC fit gives 315.1 W and -0.416%/C against the printed -0.41. |
| Array | 24 modules as two strings of 12 on one inverter (our choice). 25 degree south tilt. |
| Weather and yield | Modelled Atlanta June, random daily clearness, seed 2026. Mean 1.677 kWh per module-day, 40.25 kWh for the array (DC, inverter losses ignored, modelled, not measured). |
| Fault | One module in the first string loses 30% of its photocurrent over the whole module. |
| Diodes | Three diodes (datasheet: "J-Box IP67, 3 diodes"), treated as bypass diodes with a 0.5 V drop assumed. |
| Noise (assumptions) | 1.0% reading error and 1.5% day-to-day module difference, giving 1.86% for one module against the median of 23 peers. |
| Noise, string and inverter | String against the other string: 1.54%. Inverter against the model: 3.0%. |
| Architecture A | String inverter with monitor-only module devices. The model assumes the tracker finds the best power peak. A bypassed module reads 0 W. |
| Architecture B | MLPE, each module at its own power point. Conversion loss is ignored. See the MLPE page for it. |
Module-level comparison flags the fault in both setups. Inverter level does not.
| Level | Compared with | Noise, 1 sd | A: shortfall (z) | B: shortfall (z) |
|---|---|---|---|---|
| Module | Median of 23 peers | 1.86% | -100%, reads 0 W (z = -54) | -30.7% (z = -16.5) |
| String | Other string | 1.54% | -8.7% (z = -5.7) | -2.6% (z = -1.7) |
| Inverter | Model | 3.0% | -4.4% (z = -1.5) | -1.3% (z = -0.4) |
Shortfalls are 30-day means. Daily values stayed within 0.8 points.
- Only one of the four string and inverter cells clears z = 3: the A string. Both module cells clear it by a wide margin.
- String loss stops near 8.7%. Bypassing one module of 12 costs 8.3% of the string. The diode drop adds more. In our model this happens by 18% loss.
- The module reading depends on the hardware. In string A the weak module’s power drops faster than its current. A 5% current loss reads -7.6% in the simulation.
- Smallest loss flagged at z = 3 (1000 W/m2, 25 C cell, 1% steps) was 4% for a monitor-only module. It was 6% for MLPE. It was 13% for the string. The inverter never reaches the 9.0% it needs.
How many false alerts will it raise?
The count depends on the threshold, the number of days and the noise. Each day, each module is compared with the median of its 23 peers.
The run covers 24 healthy modules for 30 days with no fault. 1% of readings were missing (skipped). It uses the noise above. The table gives mean alerts a month, from the formula the calculator uses. A 600-run Monte Carlo agreed within 2% wherever the count was above 1. All alerts here are false.
A 4% limit on one day gives 11.2 false alerts a month. A 6% limit held for two days gives under 0.001.
| Alert if below peers by | 1 day | 2 days | 1 day, noise x2 | 2 days, noise x2 |
|---|---|---|---|---|
| 4% | 11.2 | 0.17 | 87.2 | 11.8 |
| 6% | 0.46 | <0.001 | 36.3 | 1.87 |
| 8% | 0.006 | <0.001 | 11.2 | 0.17 |
| 10% | <0.001 | <0.001 | 2.59 | 0.009 |
Counting a missing reading as zero changes the one-day result a lot. The table shows alerts a month at base noise:
| Alert if below peers by | Gaps skipped | Gaps counted as zero |
|---|---|---|
| 4% | 11.2 | 18.1 |
| 6% | 0.46 | 7.58 |
| 8% | 0.006 | 7.14 |
| 10% | <0.001 | 7.13 |
Noise is modelled as Gaussian and independent from day to day, which real sites do not match. At limits of 6% and above, missing readings were the larger source of false alerts. At 6% and one day, they added 7.1 alerts a month.
With the same 1% of readings missing, the chance of flagging a real fault on one day tops out at 99%.
| Fault (module shortfall) | Chance flagged on one day | Alert within 30 days (6%, 2 days) |
|---|---|---|
| 5% | 29% | 88% |
| 10% | 97% | 100%, about day 2 |
| 30% | 99% | 100%, about day 2 |
Calculate false alerts and detection for your array
Enter your own noise, limit and fault size. The buttons load the cases from the tables above. All noise inputs are your own assumptions.
What does module-level monitoring cost in data and hardware?
Data cost is storage plus any platform fee. The company pages read give no hardware prices, so none are given here. The MLPE page covers the hardware.
- Data volume: 24 modules at 15 minutes (96 readings a day) and 3 fields give 6,912 values a day. At 1 minute and 6 fields it is 207,360, 30 times more. All 24 hours are counted.
- Platform fee: Tigo’s page lists EI Basic as included with monitored hardware. EI Premium is listed at 20 a year per site up to 35 modules, with no currency name, on an undated page. At 24 modules, that is about 0.83 per module-year.
What are the limits of module-level monitoring?
It finds which module is off, not why. Its alerts are only as good as the noise assumption behind them.
- Noise: companies do not publish thresholds. SolarEdge alert 72 says "significant difference" and gives no number.
- Research limits are early: an undated NEXT ENERGY paper used a 2% deviation threshold. It came from error estimates. It lists 1% sensor error for module voltage and string current. Its authors said field reliability still had to be tested. It reports no false-alarm rate.
- Lost contact: SolarEdge calls an optimiser non-reporting after an hour without contact. Treat a gap as a gap, not as zero output.
- Shared events: a peer comparison cannot see a fault that hits most peers at once.
- Diagnosis: follow an alert with thermal inspection or I-V curve tracing. Alert rules are on the alerts and alarms page.
How solar software handles module-level monitoring
Tigo EI and SolarEdge document module-level data and alerts. Enphase does so only in part. None states a module alert threshold.
| Software | Module-level data and alerts documented? | Source (checked October 2026) |
|---|---|---|
| Tigo Energy Intelligence | Yes | Tigo EI pricing and monitoring pages (undated). Help centre "Monitoring - Features & Pricing", updated 20 January 2025. |
| SolarEdge monitoring platform | Yes | Module-level data note, version 1.0, January 2019. Alerts note, version 1.0, November 2023. |
| Enphase Enlighten | Partly | Two Enphase Australia support pages (undated). |
Partly means the page documents module data but no module alert rule. What the pages state, and where they stop:
- Tigo Energy Intelligence: Basic: "Module-level power, energy, reclaimed energy" at 15 minutes. Premium: voltage, current, RSSI at 1 minute and "customizable safety and performance notifications". The help centre lists Premium Performance Alerts for "Module production". The hardware needs Cloud Connect Advanced and an access point. The pages do not say if you can retrofit an existing system.
- SolarEdge monitoring platform: Per optimiser: energy, input and output voltage, input current, temperature. Alert 74 "No communication with Power Optimizer". Alert 72 "Module voltage mismatch". The module screens in the 2019 note are on the inverter display. No threshold for alert 72.
- Enphase Enlighten: "If a module is not producing it is shown as blacked out". Production Issue status when site output falls below a set limit. It also shows when more than 10% of microinverters show a hardware issue. Alert emails come in batches. Its alert statements cover site-level status. No module-level underperformance rule is documented. The page says one non-producing panel has minimal effect on total output.
Enphase’s alert features are mostly site-level, so it is rated Partly for module-level alerting. To compare monitoring tools, see the best solar monitoring software.
Common mistakes with module-level monitoring
FAQs
What is the difference between module-level and string-level monitoring?
String-level monitoring reads one value for a group of modules. Module-level reads each one. In our simulation, a 30% loss on one of 24 modules read 8.7% low at string level. At module level it read 0 W.
Can module-level monitoring find one soiled panel?
Yes, if the loss is bigger than the noise. In our model, a 6% loss reached z = 3 for an MLPE module. A peer comparison cannot find panels that soil evenly. See soiling.
Does it need optimisers or microinverters?
No, not always. The MLPE page, citing Tigo, describes non-optimising units. The Tigo pages read do not say if you can add them to an old system.
Why do module alerts fire when nothing is wrong?
Readings carry noise, and gaps can look like zeros. In our simulation, a 4% one-day threshold raised 11.2 alerts a month. A 6% threshold held for two days raised under 0.001.
Related terms
- MLPE: module-level hardware that manages each module.
- Alerts and alarms: rules that turn data into messages.
- Mismatch loss: power lost when wired modules differ.
- SCADA: plant control and data collection.
- Solar monitoring software: a platform that collects and stores readings from PV sites.
Next step: before you promise module alerts to a customer, compare what each tool in the best solar monitoring software list documents.
Sources
- Canadian Solar CS6X-310/315/320P datasheet. PV Module Product Datasheet V5.3_EN, August 2015 (distributor copy, checked October 2026).
- Tigo, Energy Intelligence pricing and monitoring pages. Undated (checked October 2026).
- Tigo help centre, Monitoring - Features & Pricing. Updated 20 January 2025 (checked October 2026).
- SolarEdge, Installation Troubleshooting using Module-level Data. Version 1.0, January 2019 (checked October 2026).
- SolarEdge, Troubleshooting Alerts in the Monitoring Portal. Version 1.0, November 2023 (checked October 2026).
- Enphase Australia support, alert emails and microinverters not reporting. Undated (checked October 2026).
- Fraunhofer, module-level sensor system detects faults in large PV plants early. 1 April 2026 (checked October 2026).
- NEXT ENERGY, STORM Energy and FH Bielefeld, SunSniffer InSeMo progress paper. Undated. Data from 2012 and 2013 (checked October 2026).
Last updated 30 October 2026. Next scheduled review: 30 January 2027.