Key takeaways
- On PG&E’s summer E-TOU-C plan, 90% efficiency clears 0.0786 USD per kWh before wear. At the placeholder cost, daily wear is larger than that margin.
- Break-even efficiency is the off-peak price divided by the peak price. On winter E-TOU-C prices it is 92.5%.
- At the data sheet’s 90%, a 5 kWh cycle earns 0.39 USD in summer, before wear. In winter it loses 0.05 USD.
- Enphase measures 90% at half power and 25°C. One owner’s month in its white paper was 84.0%. That cuts the summer margin to 0.0470 USD per kWh.
- Wear can outweigh the gap. At a placeholder 1,000 USD per usable kWh and 80% average capacity, daily cycling wears 0.2283 USD per kWh against the 0.1230 USD summer spread.
To model battery dispatch against a tariff, see the best battery energy storage software.
Energy arbitrage at a glance
Arbitrage earns the gap between two prices. Take off what the battery loses and what cycling costs.
| Item | Detail |
|---|---|
| Formula | Margin per kWh discharged = peak price − (off-peak price ÷ efficiency). Break-even efficiency = off-peak price ÷ peak price (energy only). |
| Unit / typical range | USD per kWh or USD per cycle. No sourced typical range is cited. Our case runs from -0.0108 to 0.0786 USD per kWh. |
| Where it matters | Battery proposals on time-of-use tariffs. Also storage sold into wholesale markets. |
| Standard or rule | No standard. Tariffs, interconnection terms and incentive programmes set what is allowed. |
| In software | Hourly battery dispatch models with a tariff input. See the software table. |
Why does energy arbitrage matter for installers?
A battery sold on time-of-use savings must clear three costs. These are the price gap, the energy lost inside the battery, and wear. If a proposal counts only the gap, it overstates the saving.
The same tariff can pay in one season and lose in another. On PG&E E-TOU-C the summer margin is positive. At the data sheet efficiency, the winter margin is negative.
Grid charging is not always allowed. Utility terms may limit it. So may the interconnection application or an incentive programme. Confirm this before you promise a saving. For sizing, see battery storage design.
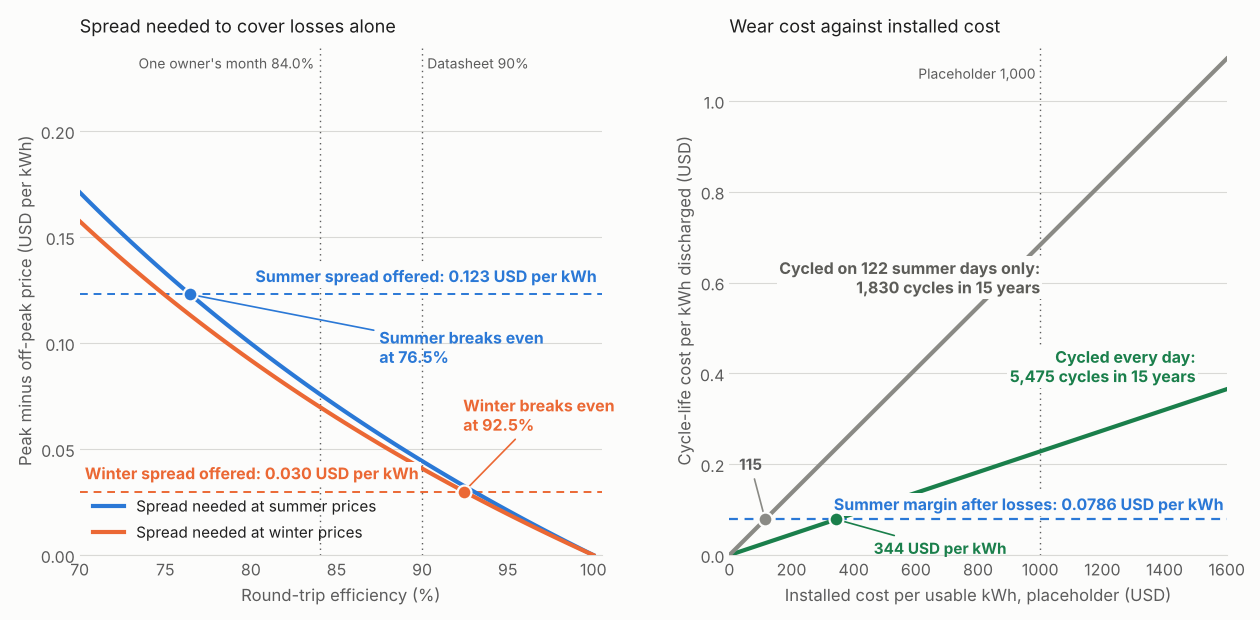
Figure 1. On PG&E’s summer prices the gap covers losses down to 76.5% efficiency. At the placeholder installed cost, wear costs more than the whole gap.
How do you calculate energy arbitrage?
Work out what each discharged kWh earns. Subtract what it cost to put in. Then subtract wear.
- Read the two prices. Use total usage rates per kWh, with delivery included. See tariff rate databases for where to find them.
- Find the energy bought. Energy in = energy out ÷ efficiency. At 90%, 5 kWh out needs 5.556 kWh in.
- Find the margin. Margin per kWh out = peak − (off-peak ÷ efficiency). The spread needed to cover losses is off-peak × (1 ÷ efficiency − 1).
- Subtract wear. Wear per kWh = installed cost per usable kWh ÷ (lifetime cycles × average capacity). Lifetime cycles are the smaller of two numbers. One is the cycle cap. The other is cycles per year × years.
Worked example: one battery on one tariff
One 5 kWh battery on PG&E’s E-TOU-C plan. It charges off-peak and discharges at peak. Table 1 lists every input and its source.
Table 1. Inputs. Prices are PG&E’s total bundled usage rates for a bundled customer.
| Input | Value | Source or status |
|---|---|---|
| Summer prices (peak 4 to 9 pm, every day, off-peak all other hours) | 0.5224 and 0.3994 USD per kWh | PG&E Schedule E-TOU-C, sheet 61364-E, effective 1 June 2026 |
| Winter prices (same hours) | 0.39757 and 0.36757 USD per kWh | Same sheet |
| Seasons | Summer 1 June to 30 September (122 days). Winter 1 October to 31 May (243 days). | Same sheet. Days counted from its dates |
| Usable energy | 5.0 kWh | Enphase IQ Battery 5P, North America data sheet DSH-00010-8.0, August 2024 |
| Round-trip efficiency | 90%, "AC to the battery to AC at 50% power rating" | Same data sheet |
| Warranty | Above 60% capacity, up to 15 years or 6,000 cycles, whichever comes first | Same data sheet. Restrictions apply |
| Installed cost | 1,000 USD per usable kWh | Placeholder, not a quote or benchmark |
| Average capacity over life | 80% of new | Assumption: straight-line fade to the 60% floor |
Assumptions: the baseline credit of 0.0814 USD per kWh is the same in both periods, so we ignore it. Nothing is exported. The home has at least 1 kW of load through the peak. The model counts energy only.
Table 2. One 5 kWh cycle at 90% efficiency, before wear.
| Line | Summer | Winter |
|---|---|---|
| Energy bought off-peak (kWh) | 5.556 | 5.556 |
| Cost of that energy (USD) | 2.22 | 2.04 |
| Peak cost avoided (USD) | 2.61 | 1.99 |
| Net per cycle (USD) | 0.39 | -0.05 |
| Margin per kWh discharged (USD) | 0.0786 | -0.0108 |
| Break-even efficiency | 76.5% | 92.5% |
| Net if cycled on every day of the season (USD) | 47.96 | -13.17 |
Winter loses because the off-peak price is 92.5% of the peak price, and the battery returns only 90%. Cycling in summer only keeps 47.96 USD a year before wear.
Real efficiency is lower than the headline. The 90% is measured at half power and 25°C. Enphase’s white paper says real-world efficiency "will always be lower". Our 5 kWh over five peak hours averages 1.00 kW, so check the maker’s efficiency at that power.
The same paper shows one owner’s app data. Over 24 hours, 13.1 kWh came out for 15.3 kWh in (85.6%). Over a month it was 386.5 kWh for 460 kWh (84.0%). That is one owner with no sample size. At 84.0% the summer margin falls to 0.0470 USD per kWh. The summer total falls to 28.70 USD.
Lower efficiency needs a wider gap, and the winter gap fails first.
Table 3. Spread needed to cover losses alone, per kWh discharged, at these off-peak prices.
| Efficiency | Needed, summer prices (USD) | Covered by the 0.1230 spread? | Needed, winter prices (USD) | Covered by the 0.0300 spread? |
|---|---|---|---|---|
| 100% | 0.0000 | Yes | 0.0000 | Yes |
| 95% | 0.0210 | Yes | 0.0193 | Yes |
| 90% | 0.0444 | Yes | 0.0408 | No |
| 85% | 0.0705 | Yes | 0.0649 | No |
| 80% | 0.0999 | Yes | 0.0919 | No |
| 75% | 0.1331 | No | 0.1225 | No |
| 70% | 0.1712 | No | 0.1575 | No |
The needed spread rises as efficiency falls. It also scales with the off-peak price. Compare it with the offered spread in your own tariff. See peak shaving for demand charges and self-consumption for solar-charged batteries.
What do degradation and cycle life add?
Wear adds a cost per kWh discharged. It is the installed cost divided by the kWh the battery gives over its life. The warranty sets a cycle cap and a capacity floor. It does not set the fade curve.
Daily cycling for 15 years is 5,475 cycles. So the 15 years end before the 6,000 cycles do. Cycling on 122 summer days gives 1,830 cycles. The same cost is spread over fewer kWh.
Table 4. Cycle-life cost at the placeholder 1,000 USD per usable kWh, with 80% average capacity.
| Cycling pattern | Lifetime cycles | kWh out per usable kWh | Wear (USD per kWh out) | Break-even installed cost (USD per usable kWh) |
|---|---|---|---|---|
| Every day (365 a year) | 5,475 | 4,380 | 0.2283 | 344 |
| Summer days only (122 a year) | 1,830 | 1,464 | 0.6831 | 115 |
The break-even installed cost is the cost at which wear equals the 0.0786 USD summer margin after losses, not the 0.1230 USD spread. Both wear figures exceed even the full 0.1230 USD spread. So on arbitrage alone, no efficiency breaks even at this placeholder. Use all 6,000 cycles and wear is still 0.2083 USD per kWh. That is at the placeholder 1,000 USD per usable kWh and 80% average capacity. Daily cycling also means winter cycles that lose money at 90%.
The battery may also give backup or shift solar. Then only part of the wear belongs to arbitrage. The data sheet gives no split. NREL (renamed NLR in December 2025)’s 2024 ATB page for residential storage assumes 85% round trip, a 15-year life and about one cycle a day. For lifetime money, use NPV and payback period. This page shows maths, not advice.
Battery energy arbitrage calculator
Enter two prices, a battery and a cycle count. The calculator returns the margin. It also returns the break-even efficiency and the wear. Its defaults match the summer column. A second button loads winter prices.
How solar software handles energy arbitrage
Of the five tools below, only HOMER Grid names an arbitrage strategy in its knowledge base, and SAM’s slides name energy arbitrage as a use of manual dispatch. A proposal model also needs an hourly tariff input and separate efficiency and degradation inputs. A good rule charges from the grid only when the margin is positive.
| Software | Dispatches a battery for time-of-use arbitrage? | Feature the page names |
|---|---|---|
| HOMER Grid | Yes | Arbitrage strategy |
| SAM | Partly | Utility Rate Dispatch |
| PVsyst | Partly | Power shifting |
| Energy Toolbase (ETB Developer) | Not stated | Not stated |
| HOMER Pro | Not stated | Not stated |
Not stated: the pages read do not say. Partly: the pages describe a related feature, not full arbitrage dispatch.
- HOMER Grid: knowledge base lists an Arbitrage strategy that uses the battery to exploit off-peak and peak price differences. Pages undated. Footer UL LLC 2026. Read October 2026.
- SAM: Utility Rate Dispatch (formerly Price Signals Dispatch) schedules discharge in the highest-cost periods and charging in the lowest, with a per-cycle cost term. The deck lists energy arbitrage as the use case of Manual Dispatch. Slides dated 20 September 2023, not a help page.
- PVsyst: help describes power shifting as delaying grid injection to benefit from time-of-use rates. The word arbitrage and grid charging are not stated for it. Page undated. Added in version 8.0.17. Read October 2026.
- Energy Toolbase (ETB Developer): Storage Capacity Optimizer article lists degradation rate and separate charge and discharge efficiency as inputs. It does not mention arbitrage or dispatch logic. Undated. Read October 2026.
- HOMER Pro: dispatch article describes controllers that charge the battery from generators or excess. Price-based dispatch and grid charging appear for HOMER Grid only. Undated. Footer UL LLC 2026. Read October 2026.
For more tools that model battery dispatch on a tariff, see the best battery energy storage software list.
Common mistakes with energy arbitrage
FAQs
Does battery arbitrage make money?
Only when the gap between peak and off-peak prices, after efficiency losses, beats wear per kWh. In our example, energy only, a 5 kWh cycle earns 0.39 USD in summer and loses 0.05 USD in winter. At the placeholder installed cost, wear is larger than the whole summer gap.
What efficiency and spread do I need to break even?
Efficiency must be at least the off-peak price divided by the peak price. That is 76.5% on E-TOU-C summer prices and 92.5% on winter prices. Add wear per kWh to the needed spread.
How many cycles does a home battery last?
Enphase’s data sheet for the IQ Battery 5P warrants above 60% capacity. The cover is up to 15 years or 6,000 cycles, whichever comes first. Daily cycling reaches 5,475 cycles in 15 years. Read each maker’s warranty before you compare.
Is energy arbitrage the same as peak shaving?
No. Arbitrage moves kWh between price periods. Peak shaving lowers the highest kW a demand charge bills. One battery can serve both goals. But you cannot count the same kWh twice.
Can a battery sell to the grid for arbitrage?
Only where the export price makes it pay. Where exports pay less than imports cost, selling back earns less than avoiding imports. See net metering and NEM 3.0. Our example avoids imports. It exports nothing.
Related terms
- Round-trip efficiency: energy out of a battery divided by energy in.
- Battery cycle life: cycles a battery delivers before it falls to a stated capacity.
- Time-of-use optimisation: scheduling loads and storage around price periods.
- Solar power forecasting: predicting plant output for a coming period.
Next step: before you quote a battery on a time-of-use tariff, compare battery software that models dispatch and wear.
Sources
- PG&E Schedule E-TOU-C, sheet 61364-E, effective 1 June 2026 (checked October 2026).
- Enphase IQ Battery 5P data sheet, North America, DSH-00010-8.0, August 2024 (checked 30 October 2026).
- Enphase white paper, Battery efficiency demystified, WHP-00032-1.0, September 2025 (checked October 2026).
- NREL Annual Technology Baseline 2024, residential battery storage, older page version (checked 30 October 2026).
- LandGate, Understanding battery arbitrage, 26 September 2025, updated 7 October 2025, used for the buy-low, sell-high definition only (checked October 2026).
- HOMER knowledge base: Grid control dispatch strategies and Dispatch strategy and controllers (checked October 2026).
- SAM behind-the-meter battery webinar slides, 20 September 2023 (checked October 2026).
- PVsyst, Grid systems with storage (checked October 2026).
- Energy Toolbase, Storage Capacity Optimizer (checked October 2026).
Last updated 30 October 2026. Next scheduled review: 30 January 2027.