Key takeaways
- One system gives different figures by boundary. In the example they are 96.0% at the battery, 92.2% at the AC terminals and 90.8% at the grid connection.
- The sources leave the basis open. NREL’s method (December 2023) does not say AC or DC. The 2013 Sandia and PNNL protocol requires naming the boundary but does not fix it.
- Tesla’s 89% Powerwall 3 figure is quoted at 5 kW in the South Africa datasheet and at 3.3 kW in the US manual.
- In this example’s model, AC round-trip efficiency falls as power rises (Figure 1). Real curves need the maker’s data.
- Using the 96.0% DC figure overstated the example’s margin by 1.10 USD a cycle (example prices). That is about 402 USD a year.
To find storage tools that report AC and DC round-trip efficiency separately, see the best battery energy storage software.
Round-trip efficiency at a glance
RTE is a ratio of two meter readings. Both cover the same period. It means little until you know where the meters sit.
| Item | Detail |
|---|---|
| Formula | RTE = energy out ÷ energy in. Loss = energy in − energy out. Over a long period the state of charge should start and end at the same level. |
| Unit and range | Percent. PNNL’s GridPIQ page lists an older 83% for lithium-ion, citing a 2014 study. The Tesla documents cited later on this page quote 89%. |
| Where it matters | Sizing charge energy, tariff savings, warranty and contract terms, and proposal accuracy. |
| Standard or rule | No standard text is cited. See the AC or DC section. |
| In software | Storage simulators and some project-analysis tools. See best battery energy storage software. |
Why does round-trip efficiency matter for installers?
You buy every kWh lost in the round trip. You never sell it. A figure from the wrong boundary makes a proposal look better than the meter will. So does a favourable power level. The meter will show less.
You pay for the loss at the charge price. It also sets how much spread a tariff must offer. The break-even maths is on the energy arbitrage page. Rules that move load in time are on time-of-use optimisation and demand charge management. To size a system, see battery storage design and the BESS page.
Is round-trip efficiency measured AC to AC or DC to DC?
Either one. The sources cited do not fix one. The same battery has a higher DC figure and a lower AC figure. The inverter adds losses both ways.
The Sandia and PNNL protocol (SAND2013-7084, August 2013) defines it as "The useful energy output from an ESS divided by the energy input into the system". Section 2 says the ESS includes "any power conversion systems installed with the storage device". Section 4.2 requires the boundary to be named. It also requires its inputs and outputs to be named. It does not fix AC or DC.
PNNL’s GridPIQ page says it is taken "as measured at the point of connection." NREL’s method (December 2023) divides energy discharged by energy charged. It does not say where the meters sit.
The AC figure is the product of the stages. HOMER Front’s manual multiplies inverter, battery and rectifier efficiency. PVsyst’s page does the same for its model. A DC-coupled layout can save a conversion. See AC coupling vs DC coupling for AC-to-AC datasheet examples.
The Tesla Powerwall 3 manual row is "Solar to Battery to Home/Grid Round Trip Efficiency". Its footnote 2 reads "Typical solar shifting use case." That is a solar path. It is not an AC-to-AC test.
We could not read IEC 62933-2-1:2017, so we do not quote its definition.
What test conditions change the number?
Power, temperature, state of charge, age and auxiliary loads can each move the result. Without its conditions, you cannot compare a figure.
- Power level: PVsyst says "Ohmic losses are proportional to the square of the current". So loss as a share of energy rises with power. Figure 1 shows an example model.
- Temperature: NREL says "Efficiency can vary with temperature and charge rates". PVsyst says temperature affects voltage and resistance. No cited page gives a size for a product. Use the maker’s test data.
- State of charge and depth of discharge: PVsyst says its ratio is "only meaningful over a sufficiently long period". NREL says the start and end state of charge are only roughly known. See depth of discharge and state of charge. No cited page gives a number for its effect.
- Auxiliary loads: the 2013 protocol counts "all parasitic energies needed to run the system, such as heating or cooling". A Sandia preprint (May 2023) modelled a container enclosure at eight US locations. Heating and cooling took "from 8% in MA with PCS inside the enclosure to 34% in AKF with PCS outside the enclosure" of battery energy. In the paper, MA is Boston and AKF is Fairbanks. That is one modelled design.
- Age: Tesla’s footnotes say "beginning of life". See degradation rate and battery cycle life.
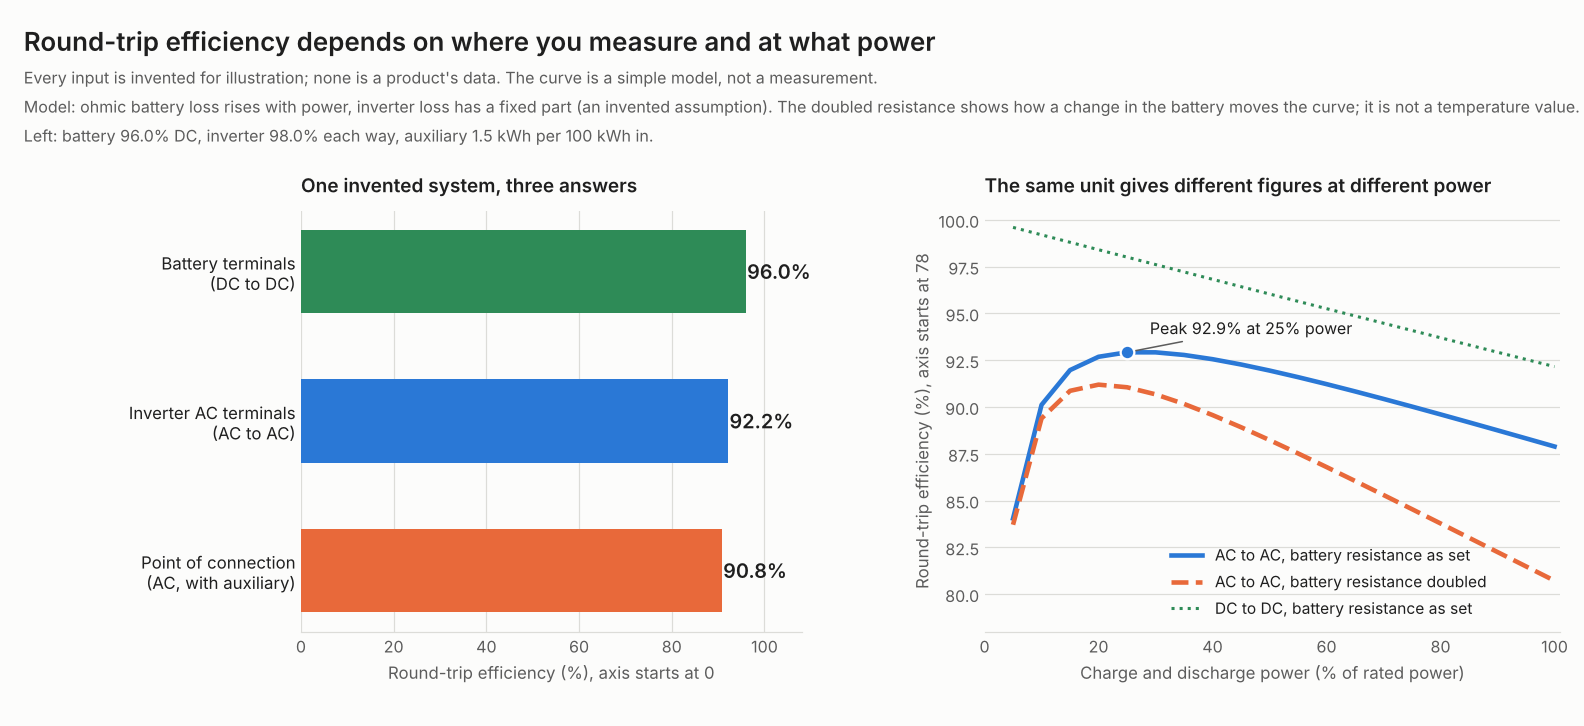
Figure 1. In an example system, RTE falls from 96.0% to 90.8% as the meter moves out to the grid connection. In a simple example model, AC RTE peaks near 25% power.
Datasheet, warranty or measured: which figure is which?
A datasheet quotes a test. A warranty states a promise. A meter shows what happened. They can differ. A warranty may not mention RTE at all.
| Kind of figure | Example read | What it leaves out |
|---|---|---|
| Datasheet or manual | Tesla Powerwall 3: US-market manual page (topic last modified 3 April 2026) and a South Africa datasheet (footer 2026, no date). | Different test powers in documents for two markets. Neither states AC or DC. |
| Warranty | Deye BOS-G-Pro warranty, Australia (no version or date). | It sets a usable-energy term and a throughput limit, with no RTE figure. |
| Contract | Con Edison and Orange and Rockland, Appendix C9 to a bulk storage RFP (no date). | No definition, boundary or test on that page. |
| Measured | NREL BESS Evaluation Method, December 2023. | No measured values, and no stated AC or DC point. |
What each figure says:
- Datasheet or manual. 89% in both. Manual footnote 1 reads "Values provided for 25°C (77°F), at beginning of life. 3.3 kW charge/discharge power." The datasheet row is "Solar to Battery to Home/Grid Efficiency". Its footnote 1 says 13.5 kWh is guaranteed "at beginning of life, 25°C, and 5 kW charge/discharge power".
- Warranty. "maintain seventy percent (70%) of its Usable Energy within ten (10) years". A minimum throughput also applies.
- Contract. "Round Trip Efficiency: Bidder defined value with minimum 80 percent requirement."
- Measured. Energy discharged divided by energy charged, from meters. It says "Accurate metering is required to measure the small difference between energy in and energy out of an efficient battery."
The sources differ. TWAICE says "Battery manufacturers guarantee a minimum RTE in their warranty contracts". ESMAP (January 2021) lists "System round trip efficiency;" as an item a warranty should specify. It calls efficiency a less common metric. Read the warranty itself.
NREL calls its equal split of RTE between charging and discharging "another approximation". It says battery monitors are "less than ±1%" at best and "less accurate power meters may vary ±3%". Revenue meters may be 0.1%, 0.2% or 0.5%.
How to calculate round-trip efficiency
- Pick the boundary. Choose the battery terminals (DC). Or choose the inverter AC terminals. Or choose the point of connection.
- Meter energy in and out at that boundary. Use one full cycle. Or use a long period with the same start and end state of charge.
- For a grid-connection figure, add the auxiliary energy to the input.
- Divide energy out by energy in. For the cost, multiply the loss (in minus out) by the charge price.
Worked example: 100 kWh in, one cycle a day
All inputs are example. They are set so the curve in Figure 1 is near 92% at half power. A script works out every figure.
| Input (example) | Value |
|---|---|
| Energy in at the AC terminals | 100 kWh per cycle |
| Battery DC round-trip efficiency | 96.0% |
| Inverter efficiency | 98.0% charging and 98.0% discharging |
| Auxiliary energy | 1.5 kWh per cycle, drawn from the grid |
| Charge price and discharge value | 0.10 and 0.25 USD per kWh |
| Cycles | 365 a year |
The results for one cycle follow.
| Result | Value |
|---|---|
| Energy at the battery in, then out | 98.00 kWh, then 94.08 kWh |
| Energy out at the AC terminals | 92.20 kWh |
| RTE at the battery, at the AC terminals, at the point of connection | 96.0%, 92.2%, 90.8% (92.20 ÷ 101.50) |
| Energy lost per cycle, with auxiliary | 9.30 kWh, costing 0.93 USD at the charge price |
| Margin per cycle, with auxiliary | 92.20 × 0.25 − 101.50 × 0.10 = 12.90 USD |
| Margin per cycle using the 96.0% DC figure alone | 96.00 × 0.25 − 100 × 0.10 = 14.00 USD |
| Overstatement | 1.10 USD per cycle (8.5%), about 402 USD a year |
| Loss per year, with auxiliary | 3,395 kWh, costing 339.51 USD |
| Discharge value needed to cover the charge cost | 0.1101 USD per kWh |
| One more percentage point of efficiency, per year | 92.62 USD (101.50 kWh × 1% × 0.25 × 365) |
The gap comes from the inverter and the auxiliary load, not the battery. This leaves out wear, idle standby, fixed charges and ageing.
Round-trip efficiency calculator
Enter metered energy to get RTE and cost per cycle. Or convert a DC figure to AC. The defaults are the example above.
How solar software handles round-trip efficiency
One of the five tools reports a round-trip metric outright, and two do so in part. The pages below were checked in October 2026 and carry no dates unless noted. A Yes needs a named round-trip figure or definition. For storage modelling more broadly, see the BESS page.
| Software | Does it calculate or report round-trip efficiency? | Method |
|---|---|---|
| SAM | Yes | Modelled |
| PVsyst | Partly | Modelled |
| HOMER Front (UL) | Partly | Modelled |
| HOMER Grid | Not stated | Modelled |
| PV*SOL | Not stated | Modelled |
Not stated: the page we cite gives no RTE figure or definition. Partly: the page gives an efficiency term, not a stand-alone round-trip figure. What each page says, with notes:
- SAM. Battery results list a metric "Battery roundtrip efficiency". Notes: SAM help, battery results page, undated. The page gives no AC or DC point. It defines the metric as "The ratio of total battery discharge energy to battery charge energy over the life of the project."
- PVsyst. Defines one battery efficiency, EffBatE = (EBatDis + ESOCBal) ÷ EBatCh, and no separate round-trip term. Its architecture page names the converter chain as inverter efficiency × AC-DC charger efficiency. Notes: PVsyst battery efficiency and grid storage architecture pages, undated.
- HOMER Front (UL). Manual defines "system roundtrip efficiency" as an intermediate variable: η = ηinv ηrt ηrect. Notes: HOMER Front manual, Version 1.0 footer, undated.
- HOMER Grid. The dispatch strategies page mentions battery bank wear as a cost, not efficiency. Notes: HOMER knowledge base page, footer 2026.
- PV*SOL. The battery systems page describes coupling types and energy flow, with no efficiency or loss figures. Notes: PV*SOL help, battery systems, footer 2026.
These lists compare more tools: best battery energy storage software, best solar battery storage design software, commercial and utility-scale design tools.
Common mistakes with round-trip efficiency
FAQs
What is the difference between AC and DC RTE?
DC RTE covers the battery alone. AC RTE also includes the inverter in both directions. In our example, 96.0% DC becomes 92.2% AC with a 98.0% inverter each way.
Does RTE change with power?
Yes, in the sources cited. NREL says it can vary with charge rates. PVsyst says ohmic loss scales with current squared. This example’s model gives 92.9% at 25% power and 87.9% at full power. Real curves need the maker’s data.
Is RTE in the warranty?
Not always. The Deye warranty cited has a 70% usable energy term. It also has a throughput limit. It does not mention efficiency. The contract text decides. A utility RFP appendix cited asks bidders to guarantee at least 80 percent.
What is a good RTE?
Compare products only on one stated boundary and one power level, because no single number is good everywhere. Tesla quotes 89% for Powerwall 3, at 3.3 kW in its US manual and 5 kW in its South Africa datasheet. PNNL’s GridPIQ page lists an older 83% for lithium-ion, citing a 2014 study.
Related terms
- Depth of discharge: the share of stored energy used in a cycle.
- Battery management system: the unit that guards the cells.
- C-rate: charge or discharge power relative to capacity.
Next step: when you compare storage tools, ask which meter boundary each one reports, starting with the best battery energy storage software.
Sources
All pages were checked in October 2026.
- Sandia and PNNL protocol, SAND2013-7084, August 2013.
- PNNL GridPIQ: storage efficiency, undated.
- NREL: BESS Evaluation Method, DOE/GO-102023-6083, December 2023.
- Sandia: heating and cooling loads on battery sizing in cold climates, preprint dated 11 May 2023.
- Tesla: Powerwall 3 US manual, modified 3 April 2026.
- Tesla: Powerwall 3 datasheet, South Africa, footer 2026.
- Deye: BOS-G-Pro warranty, Australia, undated.
- Con Edison and O&R: Appendix C9, bulk storage RFP, undated.
- TWAICE: warranty and RTE, undated.
- ESMAP: BESS warranties, 12 January 2021.
- JRC: IEC 62933-2-1:2017 listing, undated.
- HOMER Front manual, undated.
- HOMER knowledge base: HOMER Grid dispatch strategies, undated.
- PVsyst help: battery efficiency and losses, undated.
- PVsyst help: grid storage, system architecture, undated.
- SAM help: Battery results, undated.
- PV*SOL help: Battery systems, footer 2026.
Last updated 30 October 2026. Next scheduled review: 30 January 2027.