Key takeaways
- Our 40 kW rooftop has an NPV of +2,958 USD over 25 years. Above about 6.3% it turns negative, so the margin is thin.
- The sources we read quote rates from 2.0% to 10%, on different bases, so show NPV at several rates.
- Nominal cash flows need a nominal rate. Mixing the two moved our result from +2,958 to +39,236 or to minus 21,599 USD.
- Rate escalation and degradation both move NPV, and escalation moves it more.
- Ending the analysis at 20 years instead of 25 turns the same system to minus 12,051 USD.
Figures on this page are nominal, use a 6% rate and 2.5% inflation, and ignore tax, unless stated.
To test your own numbers, run the solar NPV calculator. To compare how tools report NPV, see the best solar financial modeling software.
NPV at a glance
NPV turns a stream of future savings into one figure in present-day money. Positive means the project earns more than the discount rate.
| Item | Detail |
|---|---|
| Formula | NPV = −C0 + sum of CFt ÷ (1 + r)^t, for years t = 1 to N |
| Unit and example | Currency. Our example: +2,958 USD at 6% nominal over 25 years |
| Where it matters | Commercial proposals, comparing designs, any buyer with a required return |
| Standard | No single standard. Tools differ on discount rate, horizon, tax, and whether they discount to year 0 or year 1 |
| In software | Financial and proposal tools report it. Read each tool’s definition before you compare numbers |
Why does NPV matter for installers?
NPV tests a proposal against the customer’s required return. Payback cannot do that. NPV also shows how easily a result can break.
Our 40 kW commercial example gives +2,958 USD at a nominal 6%. The margin is thin: it is 2,958 USD on a 104,000 USD system. A one-point rise in the discount rate flips the sign.
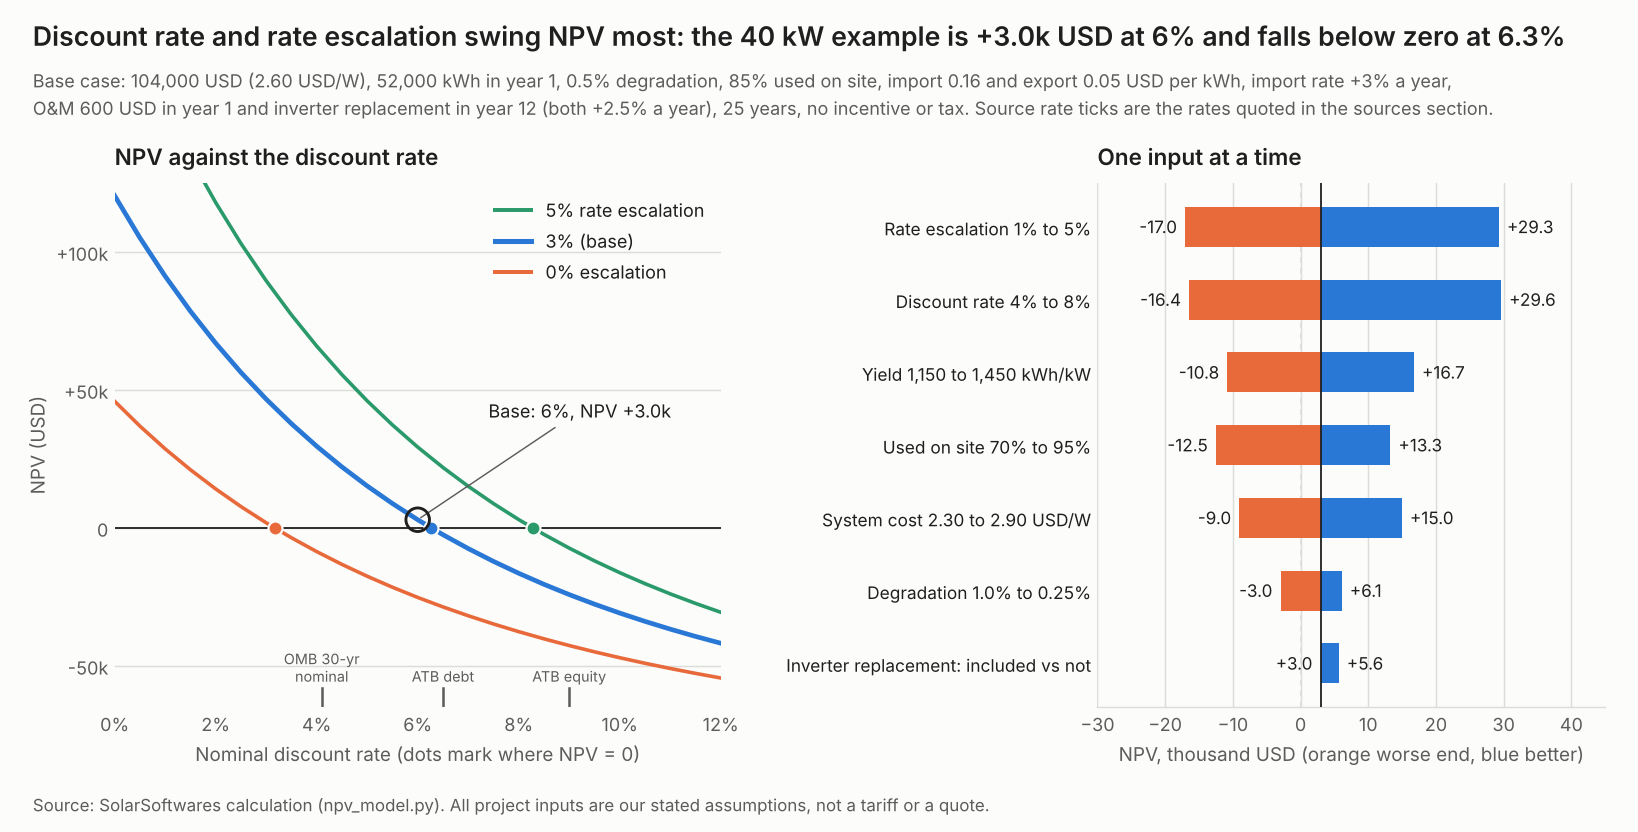
Figure 1. Rate escalation (1% to 5%) and the discount rate (4% to 8%) swing NPV most. Each moves it by about 46,000 USD. Degradation and the inverter replacement move it least.
How do you calculate NPV?
Discount each year’s net cash flow back to today. Add them up, then subtract the upfront cost. First, build the yearly flows with cash flow analysis.
- Set the cost at year 0, minus any incentive received on that date.
- Work out each year’s net cash flow. Take bill savings and export income. Then subtract O&M and one-off costs, such as an inverter replacement.
- Pick a discount rate and note whether it is nominal or real.
- Divide each year’s flow by (1 + r)^t. The first year-end has t = 1.
- Add the discounted flows and subtract the cost.
SAM’s help says it discounts to year one, so tools can differ by a timing step.
Which discount rate should you use?
Use the return the owner could earn elsewhere at similar risk. Show a range. The sources below span 2.0% to 10%. They do not share a basis.
| Source (date) | What it says | Basis |
|---|---|---|
| Aurora help, "Discount rate" (updated 15 May 2026) | 3 to 5% for cash purchases, 4 to 8% for consumer loans. Many US installers use 4 to 8%, and no single rate is correct | Not stated |
| HelioScope glossary (no date shown in the text we read) | Discount rate "typically set to 10%" | Not stated |
| NREL Annual Technology Baseline 2025 (assumptions as of July 2025) | PV: 9.0% after-tax equity return, 6.5% term debt. Renewables: nominal after-tax WACC 5.6 to 6.5%. Inflation 2.5% (Without Tax Credits case) | Equity and WACC: after tax, WACC labelled nominal. Debt rate not labelled |
| OMB memo M-26-09 (6 March 2026) | 30-year Treasury rates of 4.1% nominal and 2.0% real, for federal cost-effectiveness and lease-purchase analysis | Government rate, not an investor’s |
| UK Green Book supplementary guidance (June 2026) | 3.50% for years 1 to 30, applied to values in real terms | Public-sector appraisal |
| SAM help (no date shown) | Results are "very sensitive" to the real discount rate. For PPA models it represents an alternative investment | Real rate input |
| Energy Toolbase help (no date shown) | One approach is the expected return of other investments of similar risk | Not stated |
Not stated: the source page we cite does not say. Aurora’s 4 to 8% installer claim is Aurora’s own. We found no second source.
Our base case uses a nominal 6%. That is our assumption. It sits inside this span and near the ATB’s WACC range. It is not a recommendation. If a financing partner gives you a rate, Aurora’s help says to use it.
Should NPV use a real or nominal discount rate?
Either one, if the cash flows match. Nominal flows (with escalation and inflation) take a nominal rate. Constant-money flows take a real rate.
The 2024 edition of OMB Appendix C says nominal rates discount nominal flows and real rates discount constant-dollar flows. SAM gives the link: nominal = (1 + real) × (1 + inflation) − 1. At 2.5% inflation, 6% nominal is 3.41% real. The LCOE page shows the same conversion for energy cost.
| Combination on our 40 kW example | NPV (USD) | Verdict |
|---|---|---|
| Nominal flows at 6% nominal | 2,958 | Consistent |
| Flows deflated by 2.5% a year at 3.41% real | 2,958 | Consistent, same answer |
| Nominal flows at 3.41% real | 39,236 | Mismatch: overstated |
| Deflated flows at 6% nominal | minus 21,599 | Mismatch: understated |
How do degradation and rate escalation change NPV?
Escalation lifts later savings. Degradation cuts later output. Both act mostly in late years, which discounting shrinks. The effect is still large.
First, the import rate escalation. Between 2% and 5%, each extra point moves NPV by 10,677 to 14,084 USD.
| Import rate escalation (per year) | NPV at 6% nominal (USD) |
|---|---|
| 0% | minus 25,209 |
| 2% | minus 7,719 |
| 3% (base) | 2,958 |
| 4% | 15,208 |
| 5% | 29,292 |
The base 3% is nominal. At 2.5% inflation it is 0.49% in real terms.
Next, module degradation. Raising it from 0.5% to 1.0% costs 5,913 USD.
| Module degradation (per year) | NPV at 6% nominal (USD) |
|---|---|
| 0% | 9,306 |
| 0.5% (base) | 2,958 |
| 1.0% | minus 2,954 |
| 2.0% | minus 13,605 |
At 6%, NPV reaches zero when escalation is 2.74%. Each row changes one input. Results use nominal flows, a 6% nominal rate, 2.5% inflation, before tax, no incentive. See utility rate escalation and degradation rate for how to pick them.
Worked example: a 40 kW commercial rooftop
The example is a 40 kW dc rooftop on a small retail building. The gain before discounting is 120,408 USD. Discounting cuts it to an NPV of 2,958 USD. Every figure is computed from the inputs below and re-checked on the base case.
| Input | Value |
|---|---|
| System cost | 2.60 USD per W = 104,000 USD, no incentive |
| Year-1 output | 1,300 kWh per kW = 52,000 kWh, falling 0.5% a year |
| Used on site | 85% |
| Import and export rate, year 1 | 0.16 and 0.05 USD per kWh |
| Escalation | Import rate +3% a year (nominal). Export rate flat |
| O&M | 15 USD per kW in year 1 = 600 USD, rising 2.5% a year |
| Inverter replacement | 4,000 USD at current prices, paid in year 12 = 5,380 USD after 2.5% inflation |
| Discount rate and horizon | 6% nominal. 25 years. Before tax |
| Year-1 net saving | 7,462 USD saving less 600 USD O&M = 6,862 USD |
| Result | Value |
|---|---|
| Net inflows over 25 years, undiscounted | 224,408 USD |
| Present value of those inflows at 6% | 106,958 USD |
| NPV at 6% (present value less 104,000 USD cost) | +2,958 USD |
| Break-even rate where NPV = 0 (see IRR) | 6.27% |
| Present value of inflows per USD of cost | 1.03 |
| NPV at nominal 4%, 5%, 7%, 8%, 10% (2.5% inflation) | 29,608, 15,196, minus 7,488, minus 16,450, minus 30,872 USD |
| NPV at 6% nominal if the analysis stops at 15, 20 or 30 years | minus 29,904, minus 12,051 and 15,584 USD |
| NPV with no inverter replacement | 5,632 USD |
The 30-year row adds no second inverter replacement. Nothing here is a tariff, quote or benchmark.
Solar NPV calculator
The presets reproduce the tables above. If an input is blank, zero, negative or out of range, the calculator warns you. It does not show a wrong number. It is a design aid, not investment advice.
How does NPV differ from payback, IRR, LCOE and cash flow analysis?
Each measure answers a different question about the same cash flows. NPV is the one that shows the value added, in money, at a chosen rate.
| Measure | Question it answers | Needs a discount rate? |
|---|---|---|
| Payback period | When is the cost recovered? | Only for discounted payback |
| IRR | What yearly return do the flows earn? | No. It is the rate where NPV is zero |
| LCOE | What does each kWh cost to make? | Yes |
| Cash flow analysis | What is the net flow in each year? | No. NPV starts from it |
How solar software handles NPV
Of the six tools we checked in October 2026, only SAM states a nominal basis for its discount rate. Aurora does not label its rate. Definitions also differ on the horizon.
| Software | Reports NPV? | Source |
|---|---|---|
| Aurora Solar | Yes | Aurora help, updated 15 May 2026 |
| HelioScope | Partly | HelioScope glossary, no date shown |
| SAM | Yes | SAM help, NPV and commercial model pages |
| PVsyst | Yes | PVsyst help, economic evaluation and financial parameters |
| Energy Toolbase | Yes | Energy Toolbase help, no date shown |
| OpenSolar | Partly | OpenSolar support, updated 16 July 2025 |
Partly: the page mentions NPV but leaves out how it is worked out.
- Aurora Solar: NPV is "the total present-day value of all cash flows". A higher discount rate lowers NPV and lifetime savings. The rate is not labelled nominal or real.
- HelioScope: lists "Lifetime Value (NPV)" as the sum of energy revenue over the system life, discounted to present value. Cost netting is not stated. Discount rate is an input.
- SAM: the NPV page says after-tax cash flow is discounted to year one at the nominal rate. The commercial page says SAM works out the nominal rate from the real rate and inflation, then calls it an input.
- PVsyst: economic evaluation lists NPV among its results. Discount rate is an input for LCOE and NPV. No default or real-nominal basis stated.
- Energy Toolbase: present value of inflows less present value of outflows. Discount rate is set in the Proposal Editor, with a settable default. No numeric default stated.
- OpenSolar: lists NPV as a metric to highlight in a proposal. The article does not say how it is worked out or name a discount rate.
For ranked tools, see the best solar financial modeling software list. The commercial solar proposal software list covers proposal tools for commercial jobs.
Common mistakes with NPV
FAQs
What is a good NPV for a solar project?
Above zero at the buyer’s required return. Our example returns 1.03 USD of present value per USD of cost. A thin margin is fragile, as in our example. The sources read give no dated benchmark figure. NPV also scales with project size, so compare it with the cost, as in the 1.03 ratio above.
Which discount rate should a solar proposal use?
Use the customer’s or financier’s required return, shown at several rates. Aurora’s help suggests 3 to 5% for cash purchases and 4 to 8% for consumer loans. It says there is no single correct rate.
Does NPV include degradation and rate escalation?
Only if the cash flows do. Build both into each year’s saving. In our example, removing escalation moves NPV from +2,958 to minus 25,209 USD.
Why do two tools show different NPVs for one system?
Their inputs and definitions differ. Rate, horizon, tax, real or nominal basis and timing all change the result. HelioScope’s glossary entry, for example, defines NPV on energy revenue.
Is NPV the same as lifetime savings?
No. Aurora’s help says a higher discount rate lowers both NPV and lifetime savings, so both are discounted. NPV also subtracts the upfront cost, so it can be negative while lifetime savings stay positive.
Related terms
- Payback period: how many years of savings it takes to repay the net cost.
- IRR: the discount rate at which NPV is zero.
- LCOE: discounted lifetime cost divided by discounted lifetime energy.
- Cash flow analysis: the year-by-year flows that NPV discounts.
- Return on investment: net gain divided by cost.
Next step: before you compare NPVs across tools, read each discount rate input in the best solar financial modeling software list.
Sources
All sources opened October 2026. OMB M-26-09, the UK Green Book guidance and the HelioScope glossary were re-opened on 30 October 2026.
- Discount rates. OMB memo M-26-09, 6 March 2026. OMB Circular A-94 Appendix C, revised 14 November 2024. NREL ATB 2025, financial cases and methods. UK Green Book supplementary guidance, June 2026.
- Software. Aurora, discount rate and financial analysis overview. HelioScope financial modeling glossary. SAM, NPV and commercial model. PVsyst economic evaluation and financial parameters. Energy Toolbase, NPV and discount rate. OpenSolar, financial savings.
- Calculation. Figures are computed from the inputs on this page. The inputs are our assumptions.
Last updated 30 October 2026. Next scheduled review: 30 January 2027.