Key takeaways
- FF is how much of the Voc × Isc rectangle the maximum-power rectangle fills.
- On REC’s 430 W class, 430 W ÷ (59.7 V × 8.91 A) is 0.808, so the power box fills 80.8% of the Voc × Isc box.
- On one datasheet, Pmax rises 7.5% from the 400 W to the 430 W class. Voc × Isc rises 2.6% and FF rises 4.8%.
- The ideal FF for the 430 W class is 0.854 at ideality 1.0 or 0.833 at 1.2, so the shortfall is 0.045 or 0.024.
- Compute FF as Pmax ÷ (Voc × Isc). A result above the ideal, such as 0.879 from a transposed Isc, usually means an input is wrong.
To measure fill factor on site, see the best solar commissioning software.
Fill factor at a glance
Fill factor is a ratio between 0 and 1, sometimes written as a percentage. The table gives the formula, the usual range and where it shows up. The TU Delft range is a textbook figure for typical cells. The REC cells are 80 half-cut bifacial heterojunction cells (the sheet’s wording), and the top REC value, 0.808, sits just above that range.
| Item | Detail |
|---|---|
| Formula | FF = Pmax ÷ (Voc × Isc) = (Vmp × Imp) ÷ (Voc × Isc). Rearranged, Pmax = Voc × Isc × FF. |
| Unit / typical range | No unit. About 0.75 to 0.80 in practice for crystalline silicon (TU Delft). 0.83 maximum for a typical commercial cell (PVEducation). REC’s sheet works out at 0.772 to 0.808. |
| Where it matters | Datasheet checks, I-V curve tracing at commissioning, and comparing modules or faults. |
| Standard or rule | Read at standard test conditions like the other datasheet values. The REC sheet’s STC table lists no FF row. |
| In software | I-V curve tracer software and libraries such as pvlib report it (see the table below). |
- PVEducation: maximum FF of 0.85 for a silicon laboratory cell and 0.83 for a typical commercial cell.
- TU Delft: crystalline silicon is in the range 0.75 to 0.80 in practice.
- REC sheet on this page: 0.772 to 0.808.
Why does fill factor matter for installers?
It is a cheap cross-check on three numbers that every design uses: Voc, Isc and Pmax. It also tells you how healthy a measured curve is.
A datasheet typo shows up as an odd FF before it reaches a stringing tool. In the field, a trace gives FF alongside Voc and Isc. A fall in FF with Voc and Isc unchanged can point to series resistance, shade or mismatch. The I-V curve tracing page shows how each fault changes it.
How do you calculate fill factor and Pmax = Voc × Isc × FF?
Divide Pmax by Voc × Isc, all taken from the same watt class at STC. To go the other way, multiply Voc, Isc and FF.
- Read Pmax, Voc and Isc from one datasheet column. Do not mix watt classes or temperature columns.
- Multiply Voc by Isc. For the REC 430 W class, 59.7 V × 8.91 A is 531.93 W.
- Divide Pmax by that product: 430 ÷ 531.93 is 0.808.
- Cross-check with Vmp × Imp. 50.5 V × 8.52 A is 430.26 W, which gives 0.809. The gap comes from rounding in the printed values.
- To rebuild power, use Voc × Isc × FF. With an invented string of 12 identical modules, Voc is 716.4 V and Isc is 8.91 A. At FF 0.808 that gives 5,160 W, which is 12 × 430 W.
Step 5 holds only when every module is identical and equally lit. If not, see mismatch loss. The Voc and Isc page and the Vmp and Imp page cover the inputs.
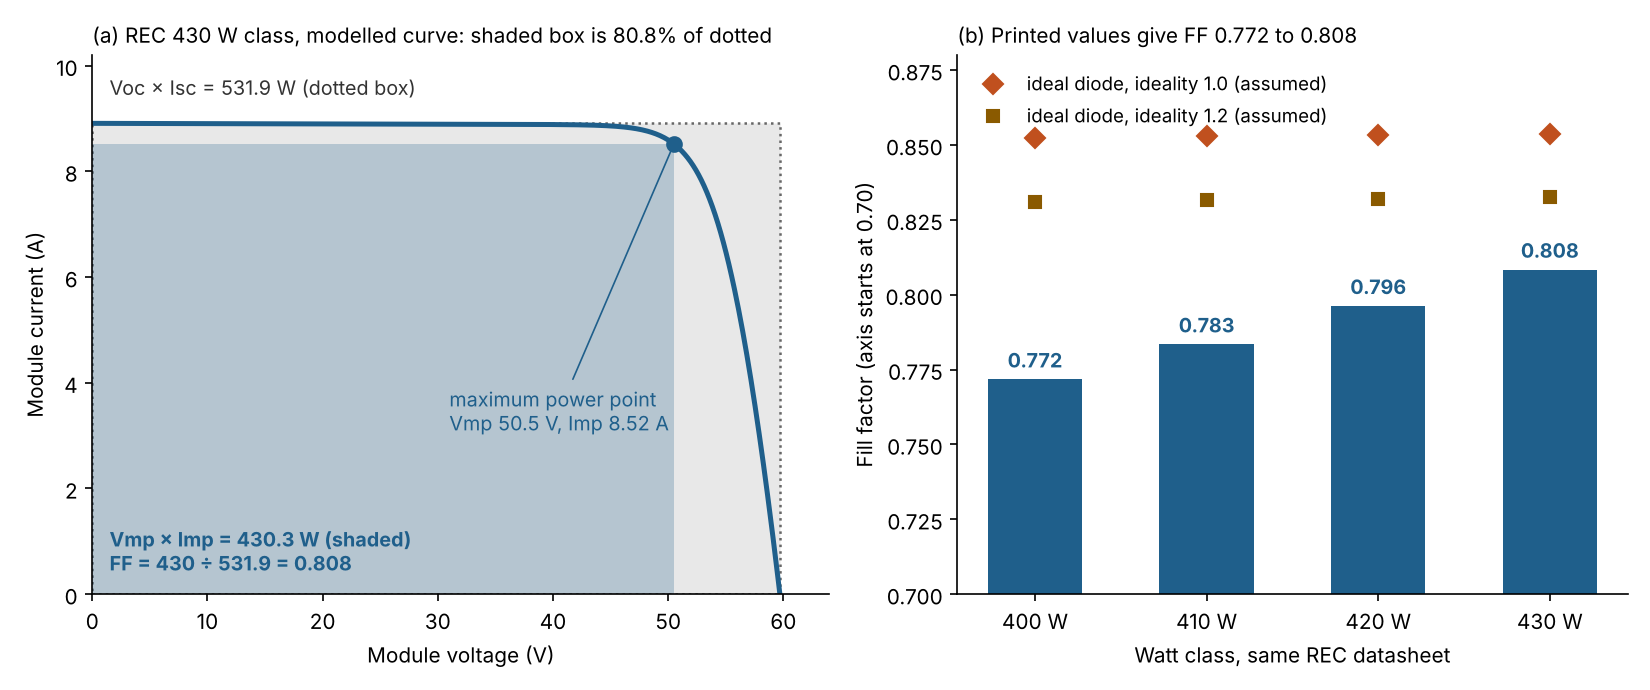
Figure 1. On REC’s 430 W class the maximum-power box fills 80.8% of the Voc × Isc box. Across its four watt classes, FF runs from 0.772 to 0.808, below the modelled ideal.
Worked example: one REC datasheet, four watt classes
The same datasheet gives four STC columns, so you can see how FF moves with power class. The first table works out FF for each column. Source: REC Alpha Pure-R, US print "REF: PM-DS-12-06-REV-/D UL EN 6.2025". It has 80 half-cut cells.
| Watt class and Pmax | Voc and Isc | Voc × Isc (W) | FF from Pmax | FF from Vmpp × Impp |
|---|---|---|---|---|
| 400 W class, Pmax 400 W | 58.9 V, 8.80 A | 518.32 | 0.772 | 0.772 |
| 410 W class, Pmax 410 W | 59.2 V, 8.84 A | 523.33 | 0.783 | 0.783 |
| 420 W class, Pmax 420 W | 59.4 V, 8.88 A | 527.47 | 0.796 | 0.796 |
| 430 W class, Pmax 430 W | 59.7 V, 8.91 A | 531.93 | 0.808 | 0.809 |
From 400 W to 430 W, Pmax rises 7.5%. Voc × Isc rises 2.6% and FF rises 4.8%, so most of the gain is FF. The sheet does not say why. Its tolerance note lets Pmax, Voc and Isc each vary by ±3% within one watt class.
Now compare with an ideal diode. We assume 80 cells in series (the layout is not printed), 25 °C, and ideality 1.0 or 1.2. Ideal FF uses Green’s expression, as printed in Javier et al., which covers ideality 1 to 1.2. Series resistance comes from their correction, and we put all of the shortfall on it. Gaps use unrounded values. The second table sets printed FF against the ideal for two classes.
| Class and ideality (assumed) | Ideal FF | Printed FF | Gap | Series resistance if it is all of the gap |
|---|---|---|---|---|
| 400 W, ideality 1.0 | 0.852 | 0.772 | 0.081 | 0.585 ohm |
| 400 W, ideality 1.2 | 0.831 | 0.772 | 0.059 | 0.440 ohm |
| 430 W, ideality 1.0 | 0.854 | 0.808 | 0.045 | 0.327 ohm |
| 430 W, ideality 1.2 | 0.833 | 0.808 | 0.024 | 0.179 ohm |
A datasheet cannot separate ideality, resistance and shunt losses, so the resistances are upper bounds. For the 430 W class that bound is at most 0.33 or 0.18 ohm per module. It is an upper bound, not a measurement. We checked the expression against a numerical single-diode solution (pvlib 0.16.1, shunt resistance set very high), and the two agree closely.
- No series resistance: the solution gives 0.8537 and 0.8326, and the expression gives 0.8538 and 0.8327.
- With the implied resistances: the expression returns 0.8087 for ideality 1.0 and 0.8083 for 1.2. The printed value is 0.8084.
- Cells of 720 mV and 600 mV: the expression gives 0.850 and 0.828, and TU Delft prints 0.85 and 0.83.
FF also works as a typo check. If Isc is keyed as 8.19 A instead of 8.91 A, FF is 430 ÷ (59.7 × 8.19), or 0.879. That is above the ideal-diode value of 0.854 for this module, so recheck. The sheet’s Imp of 8.52 A would also sit above a keyed Isc of 8.19 A, which cannot happen.
What lowers fill factor?
Anything that rounds the knee of the I-V curve lowers FF. Causes include series resistance, shunt paths, higher diode ideality and heat. In the field, shade or mismatch also lower it.
- Series resistance: PVEducation says its main impact is to reduce fill factor. It says Voc is not affected and Isc is unaffected until the resistance is very large.
- Shunt resistance: PVEducation says it lowers FF, and that the effect is particularly severe at low light levels.
- Ideality: TU Delft says a high ideality factor lowers the FF.
- Temperature: to first order, FF changes by the Pmax coefficient minus the Voc coefficient minus the Isc coefficient. Numbers for this sheet are on the Vmp and Imp page. See also temperature coefficient. FF also moves with light, so compare traces at the same conditions or against an expected curve.
The left panel of Figure 1 is modelled, not measured. It is a single-diode curve fitted to the 430 W class’s printed Voc, Isc, Vmp and Imp. The fit gives ideality 1.00 and series resistance 0.31 ohm, with shunt resistance fixed at 2,000 ohm.
Fill factor calculator
Enter Voc, Isc, Pmax, Vmp and Imp from one datasheet column. The defaults reproduce the 430 W row. It also shows Pmax from an FF you choose and the ideal-diode comparison. It warns you when an input looks wrong.
How solar software handles fill factor
Of the three tools we checked, Fluke PVA and pvlib python document fill factor and PVsyst does not name it. The table shows each tool’s method and where its page says so.
| Software | Reports or computes fill factor? (method) | How / where | Notes |
|---|---|---|---|
| Solmetric PV Analyzer (Fluke PVA-1500 series) | Yes (measured on site with a tracer) | The product page says the PVA generates the P-V curve, Isc, Voc, Imp, Vmp, Pmax and fill factor. | Fluke PVA-1500 series page (en-us), undated, checked 30 October 2026. It lists the PVA-1500 models, not the older PVA-1000S. |
| pvlib python | Yes (calculated from a curve you supply) | The function pvlib.ivtools.utils.astm_e1036 returns voc, isc, vmp, imp, pmp and ff. | Docs for 0.16.1, October 2026. Cites ASTM E1036-15(2019). The singlediode function returns i_sc, v_oc, i_mp, v_mp and p_mp, so divide yourself. |
| PVsyst | Not stated (modelled) | The one-diode module model page lists series resistance, shunt resistance and a diode quality factor. | Pages undated, read October 2026. |
Not stated means the pages we read do not name fill factor. For PVsyst those were the help index, the physical models index and the one-diode module model page. For tools that trace and report curves at commissioning, see the best solar commissioning software.
Common mistakes with fill factor
FAQs
What is a good fill factor for a solar panel?
In practice a good fill factor for crystalline silicon is about 0.75 to 0.80, says TU Delft. PVEducation gives 0.83 as the maximum for a typical commercial silicon cell. Rather than use a pass mark, compare a module’s FF with its other watt classes and its ideal-diode value. The REC sheet works out at 0.772 to 0.808.
Is fill factor the same as efficiency?
No. Efficiency is Pmax divided by the light power on the module. FF is just the shape ratio inside Pmax = Voc × Isc × FF. REC prints 22.3% efficiency for the 430 W class, against an FF of 0.808. See module efficiency.
Can fill factor be above 1?
No. The maximum-power point lies inside the Voc × Isc box, so Pmax cannot exceed Voc × Isc. A computed FF of 1 or more means an input is wrong.
Does fill factor change with temperature?
Yes. To first order its relative change per kelvin is the Pmax coefficient minus the Voc coefficient minus the Isc coefficient. The Vmp and Imp page works this through for the REC sheet.
Where do I find fill factor on a datasheet?
Most sheets do not print it, and the REC sheet’s STC table has no FF row. Compute it from Pmax, Voc and Isc in one column. See equipment datasheets.
Related terms
- Voc and Isc: the voltage and current at the two ends of the curve.
- Vmp and Imp: the voltage and current at the maximum power point.
- I-V curve tracing: measuring the whole curve in the field.
- Mismatch loss: power lost when modules in a string differ.
Next step: run your own datasheet column through the calculator above, then compare other free tools in the best free solar calculators for installers. To measure FF on a live array, compare I-V tracers in the best solar commissioning software.
Sources
- PVEducation: fill factor, series resistance and shunt resistance (no dates on the pages) (checked October 2026).
- TU Delft OpenCourseWare, Chapter 9, Solar Cell Parameters and Equivalent Circuit (no date in the text read) (checked October 2026).
- Javier et al., Improving the Accuracy of Fill Factor Empirical Expressions for Modern Industrial Solar Cells. APVI conference PDF, Table II, no date in the text read (checked October 2026).
- REC Alpha Pure-R datasheet, US print (UL EN 6.2025) (checked October 2026).
- Company pages: Fluke PVA-1500 series, pvlib astm_e1036, pvlib singlediode and PVsyst one-diode model (checked October 2026).
Last updated 30 October 2026. Next scheduled review: 30 January 2027.