Key takeaways
- A trace shows whether a weak string has a light, heat, shade, resistance or diode problem, because each one reshapes the curve differently.
- We simulated a 10-module string (Canadian Solar CS6U-325P, assumed 850 W/m² and 45 °C cell). It should read Isc 7.99 A, Voc 422.3 V, Pmax 2,545 W and fill factor 0.754. STC gives 0.764. The string is hotter and dimmer.
- Shade: power -3.5%, Isc unchanged, two power peaks. Shorted diode: Voc -3.5%, fill factor unchanged.
- Soiling-like 8% light loss: Isc -8.0%, Voc -0.4%. Extra 2.0 ohm: fill factor -3.3 points, Voc unchanged.
- Correction decides the verdict. Against STC datasheet values the clean string looks 21.7% low on power. Against its own expected curve it is 0.0% off.
To import tracer files and compare each curve with an expected curve, see the best solar commissioning software.
I-V curve tracing at a glance
A tracer loads the string through its whole range and plots what it delivers. You compare the result with the curve expected at the same light and temperature.
| Item | Detail |
|---|---|
| Formula | Fill factor = Pmp ÷ (Voc × Isc), where Pmp = Vmp × Imp. PVEducation defines it this way. |
| Unit and range | Volts, amps, watts and a ratio below 1. Our datasheet module at STC: 0.764. Our simulated string reads lower, 0.754, because it is hotter (45 °C) and dimmer (850 W/m²). |
| Where it matters | Commissioning, string fault-finding, periodic O&M checks. |
| Standard or rule | IEC’s webstore lists IEC 60891:2021 (corrections to measured I-V curves) and IEC 61829:2015 (on-site array measurement). Only the webstore listings are used, not the texts. |
| In software | Tester software shows the curve, an expected curve and pass/fail. Libraries such as pvlib simulate curves. |
Why I-V curve tracing matters: when do teams trace a curve?
They trace at commissioning, when a string underperforms, and on a schedule. A Voc and Isc reading gives two points. A trace gives the whole curve.
- Commissioning or after maintenance. Fluke says a trace confirms a module or string produces power within expected tolerances. A Fluke slide deck (May 2024) calls it a Category 2 test in IEC 62446-1. Separately, under Category 1 it says a trace may replace Voc and current measurements. It also says tests may be done on a sample. The commissioning report page lists the rest of the test regime.
- Fault-finding. Fluke lists shade, soiling, cracked cells, high series resistance and bypass diode faults. Compare identical strings under similar light, as ICS Schneider’s article does.
- Periodic checks and warranty data. Seaward’s FAQ says periodic traces can compare current output with earlier performance or product warranty data. It does not say a trace settles a claim. See O&M.
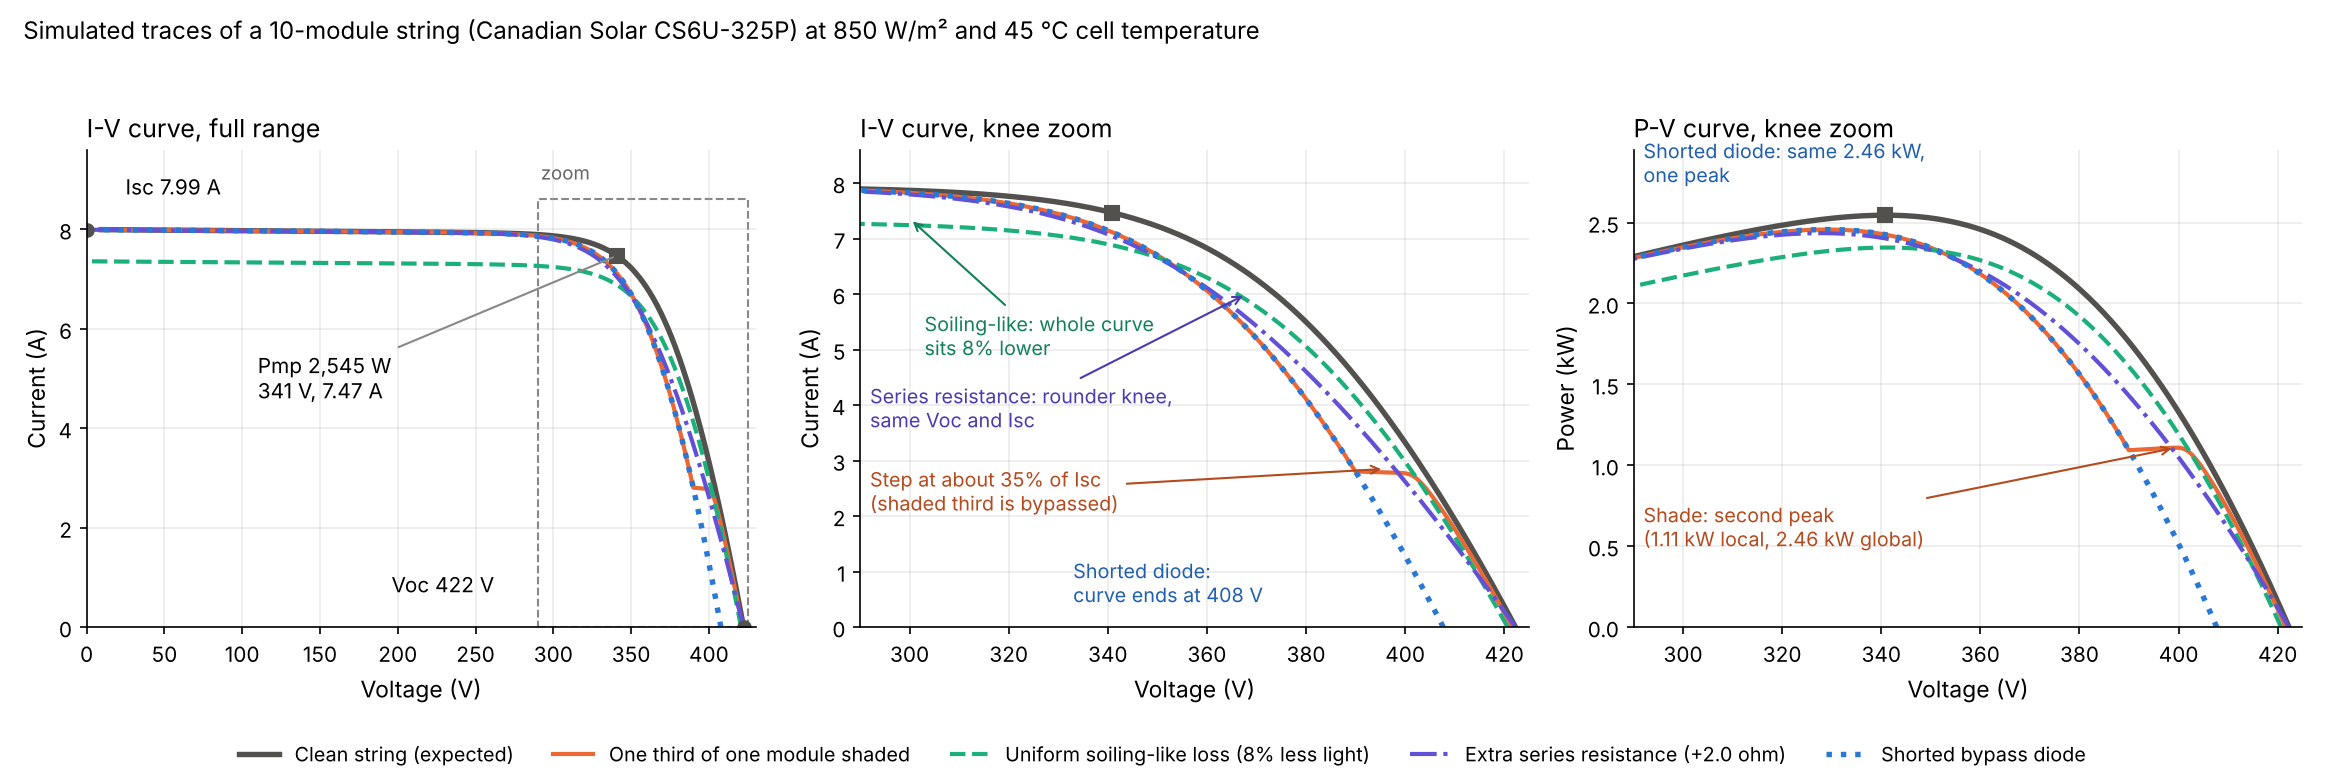
Figure 1. Shade adds a step and a second power peak, soiling lowers the whole curve, and a shorted diode shortens it. Series resistance rounds the knee.
What does an I-V curve show?
It shows five points and one ratio. Each answers a different question, so a faulty string can fail one and pass another.
- Isc is the current at zero volts. It follows light, so it shows shade, soiling and the irradiance reading. See Voc and Isc.
- Voc is the voltage at zero current. It follows cell temperature and the number of working cell groups.
- Pmp, Vmp and Imp mark the maximum power point, where the inverter’s tracker aims. See Vmp and Imp.
- Fill factor is Pmp ÷ (Voc × Isc). It measures how square the curve is, so it falls when the knee rounds. See fill factor.
Worked example: four faults on one simulated string
Each fault is simulated with pvlib 0.16.1 on one string. It reads the same numbers a tracer gives. All values are model output, not site data.
| Input | Value |
|---|---|
| Module | Canadian Solar MaxPower CS6U-325P: 72 cells, STC Voc 45.5 V, Isc 9.34 A, Vmp 37.0 V, Imp 8.78 A. |
| Datasheet | "April 2018, V5.561_E1_NA" (the "NA" print, distributor copy), which prints "3 diodes". |
| Parameters | pvlib’s bundled SAM CEC library row Canadian_Solar_Inc__CS6U_325P (SAM 2018.11.11 r2, dated 1/3/2019). It matches the datasheet Isc, Voc, Imp and Vmp within 0.001%. |
| String and conditions | 10 modules in series. Assumed 850 W/m² in the plane of the array and 45 °C cell temperature. |
| Diodes (our assumptions) | Each of the 3 diodes spans 24 cells (the datasheet does not say). Forward drop 0.5 V. At 0.3 or 0.7 V, shaded power moves under 0.1%. |
Our assumed faults:
- Shade: one third of one module at 35% of the light.
- Soiling-like: 8% less light on every module.
- Series resistance: +2.0 ohm in the string.
- Shorted diode: one third of one module permanently bypassed.
The model uses pvlib’s single-diode functions. It splits each module into three substrings, one per bypass diode, and clamps each substring at the diode drop.
| Case | Isc (A) | Voc (V) | Pmax (W) | Fill factor |
|---|---|---|---|---|
| Clean (expected) | 7.99 | 422.3 | 2,545 | 0.754 |
| Shade | 7.99 (0.0%) | 421.6 (-0.2%) | 2,457 (-3.5%) | 0.729 |
| Soiling-like | 7.36 (-8.0%) | 420.7 (-0.4%) | 2,345 (-7.9%) | 0.758 |
| Series resistance +2.0 ohm | 7.99 (-0.05%) | 422.3 (0.0%) | 2,434 (-4.4%) | 0.721 |
| Shorted diode | 7.99 (0.0%) | 407.7 (-3.5%) | 2,457 (-3.5%) | 0.754 |
Three findings stand out.
- Same power loss, different shape. Shade and a shorted diode both cost 3.5% power. Shade lowers fill factor and keeps Voc. A shorted diode lowers Voc and keeps fill factor.
- A passing Voc and Isc does not clear a string. The shade and resistance rows both pass them. Series resistance rounds the knee, so Vmp ÷ Voc falls to 0.776 against 0.807.
- Resistance must be large to show. At +0.4 ohm the fill factor falls only 0.65 points.
A separate solver (scipy root-finding) checked the directions. It matched pvlib’s curves to 1e-11 V. Shaded-case power matched a hand rule: 29 of 30 cell groups, less the diode drop. Fill factor fell at every step of a 0 to 2.0 ohm sweep, with Voc exactly constant. The mismatch loss and shading analysis pages cover the energy side of shade.
The table sets out what two sources say about each signature and what to check first.
| Signature | What the sources say | Check first |
|---|---|---|
| Step in the curve (shade) | Steps come from bypass diodes around weaker cells, shorted diodes or uneven dirt (Fluke). Local soiling acts like shade, and a step alone does not prove a defective diode (ICS Schneider). | Clear shade or dirt, then trace again. See bypass diode failure. |
| Lower Isc, no step (soiling) | Uniform shading or soiling lowers Isc (Fluke), with no steps (ICS Schneider). | Light reading and dirt. See soiling. |
| Rounder knee, lower fill factor (series resistance) | Series resistance rounds the curve and lowers fill factor while Voc can look normal (ICS Schneider). | Connectors and wiring, after the Voc checks below. |
| Lower Voc | The sources disagree. Fluke lists "increased circuit resistance" among causes of low Voc. PVEducation says series resistance does not affect Voc, and our model agrees. | Temperature, a missing module and a shorted diode first. |
What irradiance and temperature corrections does a trace need?
A trace needs the light in the plane of the array and the cell temperature at the moment of the sweep. Without them you cannot tell a fault from a cloud or a hot roof.
Our clean string at 850 W/m² and 45 °C reads low against STC datasheet values: Isc 14.4%, Voc 7.2% and power 21.7%. That gap would hide the 8% soiling-like loss entirely. Against the expected curve at the measured conditions, the clean string is 0.0% off and soiling shows as -8.0%.
| Clean string (model) | Isc (A) | Voc (V) | Pmax (W) | Fill factor |
|---|---|---|---|---|
| 1,000 W/m², 25 °C (STC) | 9.34 | 455.0 | 3,249 | 0.764 |
| 850 W/m², 45 °C | 7.99 | 422.3 | 2,545 | 0.754 |
| 600 W/m², 45 °C | 5.64 | 415.6 | 1,803 | 0.769 |
| 400 W/m², 45 °C | 3.76 | 407.9 | 1,197 | 0.780 |
| 1,000 W/m², 65 °C | 9.47 | 395.5 | 2,710 | 0.724 |
Light moves Isc in step and Voc slowly. Heat cuts Voc and power. Sensor errors carry through. A 5 K temperature error moves expected Voc by 7.4 V, which is 1.8% of the 422.3 V reading. That is 0.326% of the 455.0 V STC value per K, times 5. The slopes below are per K of STC value. A 5% irradiance error moves expected Isc by 5.0%. Our model’s Voc and power slopes (-0.326 and -0.413 %/K) are within 0.03 %/K of the datasheet’s. Its Isc slope (+0.034 %/K) is below the sheet’s +0.05 %/K.
IEC and Fluke sources set these rules for corrections. IEC’s webstore says IEC 60891:2021 (edition 3.0, 27 October 2021) defines procedures for temperature and irradiance corrections to measured I-V curves. It adds "translation procedure 4" for c-Si technologies with unknown temperature coefficients. It lists IEC 61829:2015 (edition 2.0, 22 October 2015) as covering on-site measurement of flat-plate arrays, the weather conditions and translation to STC or other conditions. The listings are not the standard text, so no clause or formula from either is stated.
A Fluke deck cites clause 7.2 of IEC 62446-1 for two rules. Irradiance must be at least 400 W/m² and stable. The temperature probe goes on the back of the module centre. ICS Schneider says curves taken at 950 and 600 W/m² cannot be compared directly.
I-V curve reading calculator
Enter measured Voc, Isc, Vmp and Imp for fill factor, power and ratios. Optionally add expected values at the same light and temperature, and an irradiance reading. The tool accepts thousands separators and decimal commas, and rejects impossible entries. You choose the band, because no source sets one.
How solar software handles I-V curve tracing
Solmetric, Fluke TruTest Solar and Seaward SolarCert work with tester data, while pvlib only simulates curves. Entries come from company pages as checked October 2026.
| Software | Does it show or analyse I-V curves? | Method |
|---|---|---|
| Solmetric PV Analyzer (Fluke PVA-1500 series) | Yes | Tracer plus software |
| Fluke TruTest Solar | Yes | Imports SMFT-1000 data |
| Seaward SolarCert | Yes | Imports tester data |
| pvlib python | Yes | Simulation only |
- Solmetric PV Analyzer: Measures with a capacitive load (100 or 500 points). It calculates the expected curve and a performance factor. It translates to STC using sensor data. Notes: Fluke product page for the PVA-1500 series. The profile lists the older PVA-1000S. Windows only. Checked October 2026.
- Fluke TruTest Solar: Lists "I-V curve analysis with easy pass/fail visuals". Notes: Page does not mention STC translation. SMFT-1000 is the only tester named. Checked October 2026.
- Seaward SolarCert: "Display and compare I-V and power curves". Converts PV200 and PV210 data to STC. Notes: STC conversion listed only for those two testers. Page undated. Checked October 2026.
- pvlib python: pvlib.pvsystem.singlediode returns i_sc, v_oc, i_mp, v_mp and p_mp. Notes: Open-source library. You write the code and it imports no tracer files. Docs for 0.16.1, October 2026.
Of these, only the tester packages store curves for a report. The best solar commissioning software list compares them.
Common mistakes with I-V curve tracing
FAQs
What is a good fill factor for a solar module?
Judge it against the expected value, not a benchmark. PVEducation gives 0.83 as the maximum possible for a typical commercial silicon cell, and says real cells fall below it. Our datasheet module computes to 0.764, and the clean string at 850 W/m² and 45 °C to 0.754.
Can an I-V trace find a failed bypass diode?
It can point to one. In our model a shorted diode drops Voc by one cell group, 14.6 V of 422.3 V. Isc and fill factor stay unchanged. ICS Schneider says a step alone does not prove a defective diode.
Does series resistance change Voc?
Not in the model: Voc stayed at 422.3 V from 0 to 2.0 ohm, while fill factor fell from 0.754 to 0.721. PVEducation says no net current flows at open circuit, so there is no voltage drop.
Is I-V curve tracing required at commissioning?
Not always. The Fluke deck says Category 2 needs only one of the I-V and infrared tests. Check which category your contract or AHJ calls for.
Related terms
- Fill factor: how square the I-V curve is.
- Standard test conditions: 1,000 W/m² and 25 °C cell temperature.
Next step: compare your next trace with the expected curve, then file it in a tester package from the best solar commissioning software list.
Sources
- Fluke, What is I-V curve tracing in solar? (undated, checked October 2026).
- Fluke, How to analyze an I-V curve and Identifying and interpreting I-V curve deviations (undated, checked October 2026).
- Fluke slide deck, May 2024, company summary of IEC 62446-1 (checked October 2026).
- ICS Schneider Messtechnik, Measuring PV I-V curves, published 28 August 2026, modified 31 August 2026 (checked October 2026).
- Seaward FAQ, Is I-V curve tracing only useful during installation? (undated, checked October 2026).
- PVEducation, fill factor and series resistance (checked October 2026).
- IEC webstore, IEC 60891:2021 and IEC 61829:2015 (listing pages only, checked October 2026).
- pvlib 0.16.1 docs: singlediode, calcparams_cec, v_from_i and retrieve_sam (checked October 2026).
- Canadian Solar MaxPower CS6U-P datasheet, April 2018, V5.561_E1_NA, distributor copy (checked October 2026).
- Company pages: Fluke PVA-1500, Fluke TruTest Solar and Seaward SolarCert (checked October 2026).
Last updated 30 October 2026. Next scheduled review: 30 January 2027.