Key takeaways
- GTI is the total on a surface with a defined tilt and azimuth. PV*SOL’s help writes it as GTI = BTI + DTI + RTI: beam, diffuse and reflected parts.
- The name does not say which plane. Solargis lists GTI for fixed mounting, for trackers and at the optimum angle. The Global Solar Atlas layer is for optimally tilted surfaces.
- In one modelled typical-year file (Greensboro, NC, pvlib 0.16.1), Hay-Davies gave +2.2% and Perez +4.0% annual GTI against the simple isotropic model (albedo 0.25 throughout).
- In the same file, azimuth 30° off south cost 1.8% to 2.1%, and a 5° tilt change cost 0.2% to 0.4%.
- Same file, Perez model with albedo 0.20: fixed 30° gave 1,776 kWh/m². An invented tracker setup gave 1,986 kWh/m², or +11.9%.
To build GTI from a weather file in software, see the best solar simulation software.
GTI at a glance
GTI is sunlight on the panel plane, not on the ground. It is the figure a yield model needs after transposition.
| Item | Detail |
|---|---|
| Formula | GTI = beam + sky diffuse + ground-reflected, all on the tilted plane. Inputs are GHI, DNI and DHI. Our POA page splits the parts. |
| Unit | W/m² for a time series. kWh/m² for a total. Solargis prints kWh/m² and says sub-hourly data comes as W/m². |
| Where it matters | Yield simulation, site screening, and checks against a plane-of-array sensor. |
| Naming | By product. Solargis, Solcast, the Global Solar Atlas, NASA POWER and PV*SOL write GTI. pvlib and DNV SolarFarmer write POA. PVsyst writes "incident irradiance". |
| In software | Design tools build it from GHI, DNI and DHI. Data providers such as Solargis deliver it ready-made for a stated plane. |
Why GTI matters for installers
A yield estimate is only as good as the sunlight on the module plane. Two reports for one roof can show different "GTI". The reason may be harmless or real.
Name the source, plane and model in every report. See energy yield simulation and P50, P90 and P99.
Which products call it GTI, and which call it POA?
The label depends on the product. The first table below says what each data product lists as GTI.
| Data product | What it lists |
|---|---|
| Solargis Prospect | GTI (kWh/m²) "for fixed mounting" and "for trackers". GTI_OPTA is the annual value at the optimum angle. OPTA is that angle, in degrees. |
| Solargis Evaluate | "Global tilted irradiation", GTI, kWh/m². Sub-hourly values are W/m². |
| Global Solar Atlas | "global irradiation for optimally tilted surfaces (GTI) in kWh/m²". The entry does not state the azimuth. CC BY 4.0. |
| NASA POWER | GTI at five tilts: 0°, |latitude| minus 15°, |latitude|, plus 15° and 90°. GTrI is the dual-axis value. The tilted surface faces the equator. |
| Solcast | GTI in W/m²: "Total irradiance received on a surface with defined tilt and azimuth", "fixed or tracking". |
Each product’s grid or time step is below. The source pages are in the Sources list.
- Solargis Prospect: GTI 0.00083° (about 90 m). GTI_OPTA 0.0025° (about 250 m). OPTA 0.0333° (about 3 km).
- Solargis Evaluate: 15-minute series and TMY. 90 m grid, "considering terrain shading effects".
- Global Solar Atlas: 9 arc-seconds (nominally 250 m). OPTA 2 arc-minutes.
- NASA POWER: hourly, daily and monthly. CERES SYN1deg ED4.1. Checked against BSRN ground data for 2000-04 to 2020-12. Page: "Equatorward Tilted Surfaces".
- Solcast: Not stated.
Not stated means the source page we cite does not say. It has the same meaning everywhere on this page.
Grids differ. Solargis lists about 90 m and about 250 m layers. The Global Solar Atlas layer is nominally 250 m. Check the period and the plane before you mix them.
The next table lists the default model each tool prints. The PVGIS and DNV SolarFarmer pages do not state one.
| Tool or service | Default model, as printed | Source page |
|---|---|---|
| PVGIS | Not stated | JRC manual and API page, no date. PVGIS. |
| pvlib | Isotropic. Albedo 0.25. | pvlib 0.16.1 documentation. See pvlib. |
| PVsyst | Perez "from version 6". V7.0 changed the circumsolar treatment. | PVsyst help, transposition model, no date. |
| DNV SolarFarmer | Not stated | SolarFarmer manual v1.1, Tilt Effect, no date. |
- PVGIS: Label: "Irradiance on fixed plane". "Global irradiation, optimal angle" and "selected angle". Azimuth 0 is south. Hourly file column G(i).
- pvlib: Label: poa_global, W/m². The PVGIS column G(i) maps to it. Azimuth 180 is south.
- PVsyst: Label: "incident irradiance on a tilted plane". The page does not use GTI or POA.
- DNV SolarFarmer: Label: POA: G_poa = G_dir,poa + G_dif,poa + G_r,poa.
Which plane is a GTI figure for: fixed tilt, tracker or optimum tilt?
The product’s own setting decides it. The same name can mean three planes. Read the parameter definition before you compare numbers.
- Fixed tilt: Solargis GTI "for fixed mounting". PVGIS "selected angle". PVGIS’s optimiser picks the slope with the highest energy for the whole year.
- Optimum tilt: the Global Solar Atlas and Solargis GTI_OPTA use the best angle at each place. So the angle changes across a map. Do not compare it with a roof pitch.
- Tracker: Solargis GTI "for trackers" and Solcast’s "fixed or tracking" cover moving planes. See single-axis tracker.
Our tilt angle page sweeps tilt at three sites. For compass direction, see azimuth.
Worked example: why two tools show different GTI for one site
Take one weather file and change one setting at a time. Each change below moved annual GTI by 4.0% or less. Changing the mounting type moved it by 11.9% (tracker against fixed 30°) to 13.4% (fixed 30° against flat). Both of those comparisons use the Perez model with albedo 0.20.
Inputs: the Greensboro, NC TMY3 file bundled with pvlib 0.16.1. It is typical-year data, not measurements. The baseline is a plane tilted 30° facing south. It uses the isotropic model and albedo 0.25 (pvlib’s defaults). Results are modelled sunlight, not energy.
| Change from the baseline | Annual GTI (kWh/m²) | Against baseline |
|---|---|---|
| Baseline (isotropic, albedo 0.25, 30°, south) | 1,712.7 | 0.0% |
| Perez model, albedo 0.25 (pvlib allsitescomposite1990 coefficients) | 1,781.2 | +4.0% |
| Hay-Davies model | 1,749.7 | +2.2% |
| Albedo 0.40 | 1,728.5 | +0.9% |
| Albedo 0.20 | 1,707.5 | -0.3% |
| Tilt 25° | 1,710.1 | -0.2% |
| Tilt 35° | 1,706.6 | -0.4% |
| Sun position taken 30 minutes late | 1,704.2 | -0.5% |
| Azimuth 210° (30° west of south) | 1,681.4 | -1.8% |
| Azimuth 150° (30° east of south) | 1,676.2 | -2.1% |
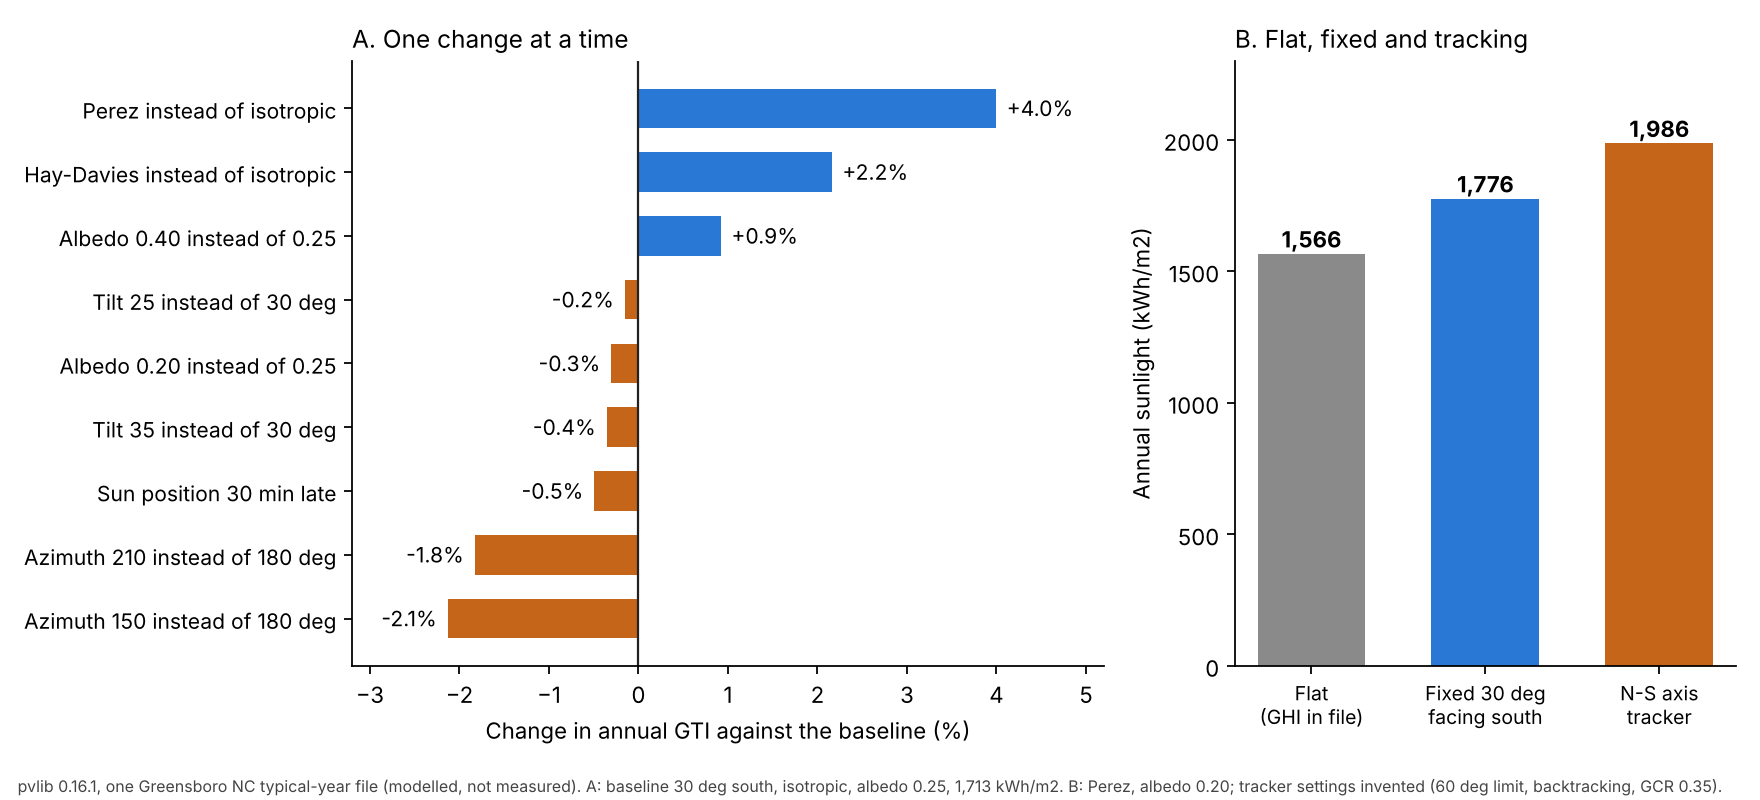
Figure 1. In one modelled typical-year file, changes to model, albedo, tilt and azimuth stay within 4% of baseline. A tracker adds 11.9% over fixed 30°.
Panel B uses the Perez model and albedo 0.20, so its fixed 30° value (1,775.9) differs from the Perez row above (1,781.2, albedo 0.25). The tracker has a north-south axis, an example 60° limit and backtracking on. Its example GCR is 0.35.
| Plane (Perez, albedo 0.20) | Annual sunlight (kWh/m²) |
|---|---|
| Flat: GHI in the file | 1,566.2 |
| Fixed 30°, south | 1,775.9 |
| Vertical (90°), south | 1,141.2 |
| North-south axis tracker (example settings) | 1,986.4 |
Fixed 30° is 13.4% above flat GHI here, and the tracker is 11.9% above fixed 30°. The result is for one site and these models. Treat it as a size guide, not a rule. For other tilts, see the tilt angle page.
What to compare when two tools disagree, in this order:
- Units and period: kWh/m² per year, per day or mean W/m². The baseline value can appear as 1,712.7 kWh/m² per year, 4.69 kWh/m² per day or 195.5 W/m² mean power. A daily average is the same number as peak sun hours.
- The plane: tilt, azimuth, and fixed, optimum or tracking. In the example file, only a change of mounting type (flat, fixed or tracking) gave a gap above 10%.
- The weather source and years: typical year or real year, satellite or ground. See weather and solar resource data.
- Model and albedo: defaults differ: pvlib isotropic, PV*SOL Hay-Davies, PVsyst Perez. Solargis’s incident-irradiance page names a "simple Perez anisotropic model" for its GTI Simulator. It names the all-weather Perez model for its PV Simulator.
- Shading: the same Solargis page says ray tracing models shading by surrounding objects. It ends with "final Global tilted irradiance (GTI) for each cell". Its GTI energy system page says the tool "is not working with the terrain data".
Calculator: put two GTI figures on one basis
Enter two values, pick each unit and the period length. The tool converts both to one basis and shows the gap. It does not model sunlight. Preset values come from the example above.
How solar software handles GTI
Solargis, Solcast and PV*SOL all name GTI in their own pages, as checked October 2026. The plane, the shading and the model each page states are in the list under the table.
| Software | Names and uses GTI? | Source page |
|---|---|---|
| Solargis (Prospect, Evaluate) | Yes | Prospect subscription parameters. Evaluate data specs. Knowledge base, Creating GTI energy system (published 26 Nov 2024, updated 25 Sep 2026). |
| Solcast | Yes | Solcast knowledge base, glossary and modelling FAQ (no dates). |
| PV*SOL premium | Yes | PV*SOL help, Irradiation onto inclined plane (footer 2026). |
- Solargis (Prospect, Evaluate): Prospect lists GTI for fixed mounting and for trackers. Evaluate lists GTI in 15-minute series. The GTI energy system tool sets "mounting type, azimuth, and tilt".
- Solcast: GTI is a data parameter (W/m²). The FAQ says "Higher GHI than GTI is a normal scenario".
- PV*SOL premium: GTI = BTI + DTI + RTI. Five diffuse models are listed. Hay and Davies is marked "(Default model)".
To see which simulation tools build GTI from a weather file, read the best solar simulation software.
Common mistakes with GTI
FAQs
Is GTI the same as POA irradiance?
Yes, in practice. Both are the sum of beam, sky diffuse and ground-reflected light on a tilted surface. Solcast and PV*SOL define GTI that way. DNV’s manual defines POA that way. Ask whether a given figure is before or after shading.
Why can GHI be higher than GTI?
A tilted plane sees less sky. Solcast says higher GHI than GTI "is a normal scenario". In the Greensboro example, fixed 30° south was 13.4% above flat GHI. A vertical south-facing plane got 1,141.2 kWh/m² (see the plane table), below the 1,566.2 flat GHI.
Which GTI should I use in a proposal?
Use a figure for your tilt, azimuth and mounting. The Global Solar Atlas layer is for optimally tilted surfaces. So it suits screening only. A simulation should state its weather source and model.
How do I turn annual GTI into peak sun hours?
Divide the annual total in kWh/m² by 365. In our example, 1,712.7 kWh/m² is 4.69 peak sun hours per day. A leap year divides by 366.
Related terms
- POA: the same sum of beam, diffuse and reflected light, split into parts.
- GHI: sunlight on a flat horizontal surface, the usual input to GTI.
- Tilt angle: the module angle from horizontal that sets the plane.
- Albedo: ground reflectivity, which feeds the reflected part.
Next step: put any two GTI figures on one basis with the calculator above, then compare simulation tools in the best solar simulation software list.
Sources
- Solargis, Prospect subscription parameters (published 23 July 2025, updated 24 September 2026, checked October 2026).
- Solargis, Evaluate data parameters (no date shown, footer 2026, checked October 2026).
- Solargis knowledge base, Creating GTI energy system (published 26 November 2024, updated 25 September 2026, checked October 2026).
- Solargis knowledge base, Incident irradiance (page metadata 23 July 2026, checked October 2026).
- World Bank Data Catalog, Global Solar Atlas GTI dataset (metadata updated 30 January 2023, checked October 2026).
- NASA POWER, Equatorward Tilted Surfaces (no date shown, checked October 2026).
- Solcast, Available solar radiation terms and modelling FAQ (no dates shown, checked October 2026).
- PV*SOL help, Irradiation onto inclined plane (footer 2026, checked October 2026).
- PVsyst help, transposition model (no date shown) and DNV SolarFarmer manual, Tilt Effect (no date shown), checked October 2026.
- JRC PVGIS user manual and API page (no dates shown, checked October 2026).
- pvlib 0.16.1 documentation: get_total_irradiance, get_pvgis_hourly and tracking.singleaxis (checked October 2026).
Numbers: modelled from one typical-year file. Last updated 30 October 2026. Next scheduled review: 30 January 2027.