Key takeaways
- PVGIS is free. Its manual says there are no restrictions on what the results are used for. The data download page asks you to acknowledge the source.
- The manual lists five radiation databases. The two with the latest end year, 2023, are PVGIS-SARAH3 (satellite, about 5 km) and PVGIS-ERA5 (reanalysis, about 25 km).
- Use PVGIS 5.3, the production version since September 2024. PVGIS 6 has been in beta since June 2026, and JRC expects the full version in 2027.
- The file header names the radiation database used. The manual’s table does not list the US for version 5.3. Its ERA5 row is the default where no satellite database covers a place.
- The PV tool’s loss input defaults to 14%. JRC says the largest uncertainty is the radiation data, and its general information page gives no accuracy figure.
To run PVGIS-style yield in software that takes a PVGIS weather file, see the best solar simulation software and the best free solar design software.
PVGIS at a glance, and why installers use it
PVGIS gives you a no-cost second opinion on yield. It is also a weather source that other tools can read. The facts below are as printed on the JRC pages listed in Sources.
| Item | Detail |
|---|---|
| Host | European Commission Joint Research Centre (JRC). The general information page says PVGIS has been developed at the JRC site in Ispra, Italy, since 2001. |
| Cost and terms | The manual calls it "completely free to use" with "no restrictions on what the results can be used for" and "no registration necessary". |
| Coverage | "for any location in the world, except the North and South Poles" (JRC home page). Which database a US location gets is not spelled out. See the databases section. |
| Outputs | PV yield, off-grid estimate, radiation series, a typical year and a horizon profile. |
| Databases | Five in the manual table: SARAH3, SARAH2, NSRDB, ERA5 and SARAH. |
| In software | pvlib, PV*SOL and HelioScope document PVGIS use. See the software table below. |
The download page says its data are "free for public use if the source is acknowledged". It prints the credit line "PVGIS © European Communities, 2001-2026" and names no licence.
Running PVGIS beside your design tool is one way to spot a wrong tilt or a bad weather file before a proposal goes out. A typical-year file has no spread, so lender work needs more. See P50, P90 and P99.
Which tools does PVGIS offer?
The JRC API page lists these tool names.
| API name | What it returns | Checked |
|---|---|---|
| PVcalc | Grid-connected and tracking PV output. Inputs include peak power (kW), loss, technology, mounting, slope, azimuth and horizon. | Oct 2026 |
| SHScalc | An off-grid estimate. Inputs include battery size, cut-off and daily consumption. | Oct 2026 |
| MRcalc and DRcalc | Monthly and daily radiation. | Oct 2026 |
| seriescalc | Hourly radiation, with optional PV power. | Oct 2026 |
| tmy | A typical meteorological year in CSV, JSON or EPW. The CSV header holds "A list of years used for each month to construct the TMY." | Oct 2026 |
| printhorizon | The horizon profile for a point. | Oct 2026 |
A header note on the tmy tool, dated December 2024, adds the irradiance time offset. The API page sets a rate limit of 30 calls per second per IP address. It allows GET only, and says access via AJAX is not allowed. For the typical-year idea, see TMY. For the horizon, see horizon profile.
Which radiation database does PVGIS use?
PVGIS uses a satellite database where one covers the place. It uses ERA5 reanalysis where none does. The manual’s table lists them below.
| Database | Type | Years | Resolution | Manual comment |
|---|---|---|---|---|
| PVGIS-SARAH3 | Satellite | 2005 to 2023 | about 5 km | In PVGIS 5.3, default for Europe, Central Asia, Africa and South America (partly). |
| PVGIS-SARAH2 | Satellite | 2005 to 2020 | about 5 km | In PVGIS 5.2, default for Europe, Asia, Africa and South America (below 20 S). |
| PVGIS-NSRDB | Satellite | 2005 to 2015 | about 4 km | In PVGIS 5.2, default for the Americas (above 20 S). |
| PVGIS-ERA5 | Reanalysis | 2005 to 2023 | about 25 km | Default for the rest of the world without satellite coverage. |
| PVGIS-SARAH | Satellite | 2005 to 2016 | about 5 km | No longer updated. The manual says to use SARAH3 instead. |
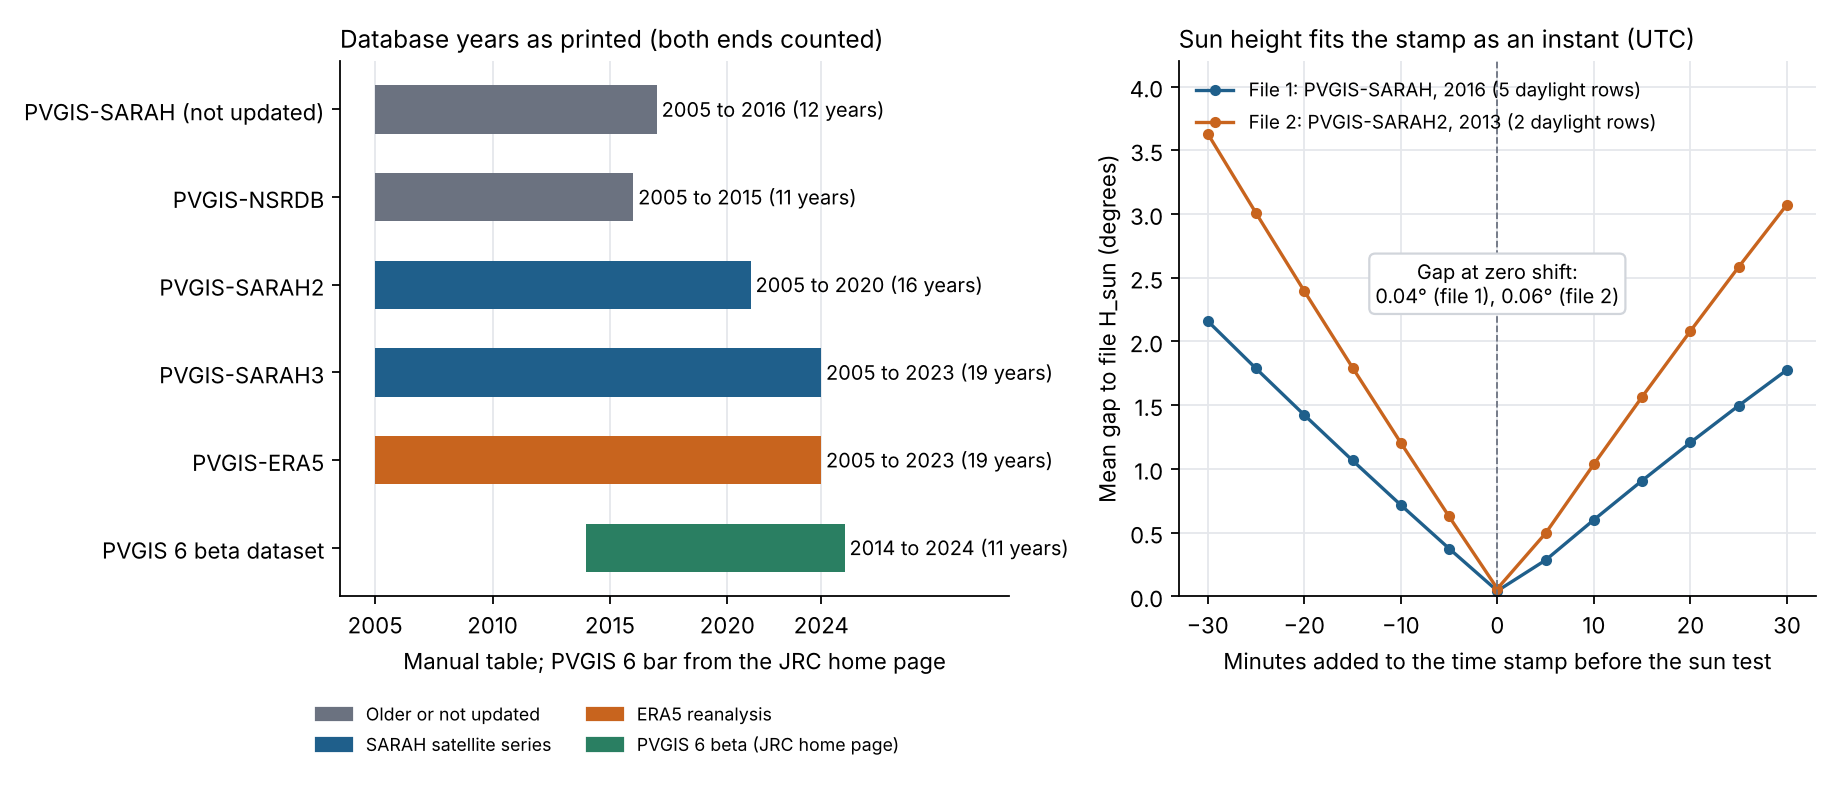
Figure 1. PVGIS’s two newest series end in 2023. In two short test extracts, the sun height fits the time stamp as an instant, with a gap of 0.04° and 0.06° at zero shift.
- The API page says PVGIS-NSRDB "is only available with PVGIS 5.2". PV*SOL’s help says North and South America are mostly NSRDB data. See NSRDB.
- The API page writes SARAH3 under PVcalc and SARAH under seriescalc. Check the name in the header of the file you download.
Which PVGIS version should you use?
Use PVGIS 5.3, the production version since September 2024. PVGIS 6 is still a beta, and JRC expects the full version in 2027, with timings "strictly indicative".
The table gives JRC’s own status line for each version.
| Version | Status as JRC prints it | Data |
|---|---|---|
| 5.1 | Released December 2019. "It was taken offline on 25/09/2024." | Default databases were PVGIS-SARAH, PVGIS-NSRDB (Americas) and PVGIS-ERA5 (Nordic countries). |
| 5.2 | The API page (undated) says the old entry point will serve PVGIS 5.2 "for a limited period". | The manual table gives SARAH2 as 2005 to 2020. |
| 5.3 | The "production version for the web user interface and for API calls since September 2024". | SARAH-3 and ERA5 to 2023. Coverage extends 25 km outside the coastline. JRC-SARAH and JRC-ERA-Interim are no longer available. |
| 6 (beta) | "released in beta version in June 2026", with "The full version is expected for 2027." The home page says the backend is now Python, with a public version on the Commission’s GitLab. | The home page says the dataset "now covers from 2014 up to 2024". |
JRC’s own pages are not all up to date. The TMY tool page still says its data period is "currently 2005-2020 in PVGIS 5.2". The manual table gives SARAH3 to 2023, and PV*SOL’s help prints 2005 to 2023 for the PVGIS typical year. Trust the database and years named in your file.
Worked check: how do you read a PVGIS hourly file?
Read the header, then the time stamps, then the row count. The example uses two real PVGIS files, test extracts bundled with pvlib 0.16.1, for one site (45.0 N, 8.0 E, elevation 250 m).
- Read the radiation database name in the header.
- Note the minute in each time stamp. The manual says SARAH stamps give "the time of when the satellite ‘sees’ a particular location".
- Compute the sun’s height with pvlib at each daylight stamp and compare it with the file’s H_sun column.
- Count the rows (8,760, or 8,784 in a leap year) and divide the column sum by 1,000 for one-hour rows.
| Check | File 1 (CSV) | File 2 (JSON) |
|---|---|---|
| Radiation database in the file | PVGIS-SARAH | PVGIS-SARAH2, with ERA-Interim for other weather fields |
| Year in the file | 2016 | 2013 to 2014 |
| Rows in the extract | 14 | 10 |
| Minute of every time stamp | 10 | 10 |
The second table gives the sun-height test on the daylight rows of those extracts.
| Check | File 1 (CSV) | File 2 (JSON) |
|---|---|---|
| Daylight rows tested | 5 | 2 |
| Mean gap, sun height against stamp as given | 0.04° | 0.06° |
| Mean gap if the stamp is moved to the top of the hour | 0.72° | 1.20° |
| Mean gap at a 30-minute shift, earlier or later | 2.16° or 1.78° | 3.63° or 3.07° |
Both files are short extracts for one winter morning, so the test covers these two files only. The manual says NSRDB stamps are "always HH:00" and ERA5 values are at HH:30.
With the stamp read as an instant at minute 10 UTC, the gap is 0.04° and 0.06°. At a 30-minute shift it is 1.8° to 3.6°. H_sun is a PVGIS column, so this checks the stamp, not the radiation.
The next table turns a column sum into energy. Every input is invented for the demonstration. None is PVGIS output.
| Item (example inputs) | Value |
|---|---|
| File | 8,784 hourly rows for 2016, a leap year. First stamp 20160101:0010, read as UTC. |
| System and clock | 4 kWp (example). Local time is UTC plus 1 hour (example). |
| Sum of the P column | 4,150,000 W (example) |
| Energy | 4,150,000 W × 1 h ÷ 1,000 = 4,150 kWh |
| Specific yield | 4,150 ÷ 4 = 1,037.5 kWh/kWp |
The checker below adds local times and row counts. A leap-year file has 24 more rows than a normal year. See specific yield for the kWh/kWp basis.
PVGIS hourly file checker
Enter the column sum, the row count, the first stamp and your UTC offset. It gives kWh, local times for the first and last rows, and a warning if the rows are not whole years. The two buttons load examples.
How solar software handles PVGIS
The pages we read split into two groups. pvlib reads PVGIS directly and PV*SOL lists it as a source. HelioScope takes an EPW you download yourself. Ratings rest on the pages named, read October 2026.
| Software | Uses or imports PVGIS? | Page read |
|---|---|---|
| pvlib python | Yes | pvlib 0.16.1 documentation and installed package |
| PV*SOL premium | Yes | PV*SOL help, climate data page (footer "© 2026", no software version stated) |
| HelioScope | Partly | HelioScope help, updated 8 July 2025 and 21 July 2026 |
Partly means the page describes a manual step, not a built-in link. What each page says:
- pvlib python: Functions get_pvgis_hourly, get_pvgis_tmy and get_pvgis_horizon, and readers for saved files. The hourly docstring says "Get hourly solar irradiation and modeled PV power output from PVGIS." Azimuth follows pvlib’s own convention, not the PVGIS one.
- PV*SOL premium: Lists PVGIS among the sources for a new location. Its PVGIS TMY entry covers Europe and Africa completely, the Americas "for the most part (data from NSRDB)", and Asia for the most part. Period 2005 to 2023.
- HelioScope: An article gives four steps: take the TMY tab in PVGIS, download EPW, then upload it "like any other weather file". It is a manual upload. The external sources article does not mention PVGIS.
- PVsyst: not rated. We could not open a PVsyst help page that confirms or rules out a PVGIS import.
For tools that run a full yield simulation, see the best solar simulation software. For a no-cost option, see the best free solar design software.
What are the limits of PVGIS?
PVGIS is a regional radiation-and-yield tool, not a site model. These limits matter to you.
- Radiation uncertainty: JRC says "The largest uncertainty in estimating solar energy system output comes from the solar radiation data." It prints no figure. See satellite-derived solar data.
- One loss figure: the PV tool takes a single loss input, 14% by default. The manual says it covers "losses in cables, power inverters, dirt (sometimes snow) on the modules". Compare a loss diagram.
- Bifacial: the manual says "PVGIS doesn’t make specific calculations for bifacial modules at present."
- Shade: the manual’s horizon text speaks of shadows from "nearby hills or mountains". For roof obstructions, use near shading tools.
- Terms: the data page names no licence. Ask JRC before you redistribute data in a product.
Common mistakes with PVGIS
FAQs
Is PVGIS free for commercial use?
Yes, the manual says there are no restrictions on what the results can be used for. The data download page asks you to acknowledge the source and names no licence. If your product resells PVGIS data, ask JRC. Its general information page lists JRC-PVGIS@ec.europa.eu. This is not legal advice.
How accurate is PVGIS?
PVGIS gives no single accuracy figure. JRC says radiation data is the largest source of uncertainty, and its general information page prints no figure. Check a run against metered output from a similar system. See expected vs actual production.
Does PVGIS cover the United States?
Yes as a location, but the US database is not spelled out. JRC says it covers any location except the poles. The manual calls ERA5 the default "for rest of the world without coverage from satellite-based DBs", and its SARAH3 row names no part of North America. Read the database name in your file header, and see our NSRDB page for the US source.
Which PVGIS version should I use?
Use PVGIS 5.3, the production version since September 2024. JRC says it serves the web interface and API calls. PVGIS 6 is still a beta, and the file you download names the version it came from.
Which radiation database does PVGIS use?
It uses a satellite database where one covers the place and a reanalysis database where none does. The file header names the one it used.
Related terms
- Weather and solar resource data: the sunlight and weather record a simulation reads.
- TMY: a one-year file built from typical months.
- Meteonorm: a commercial weather data service.
- pvlib: an open Python library that reads PVGIS files.
Next step: to run a full yield simulation with a PVGIS weather file, compare the best solar simulation software.
Sources
- JRC PVGIS home page and general information (undated, checked October 2026).
- JRC PVGIS user manual (undated, refers to PVGIS 5.3 as current, checked October 2026).
- JRC API non-interactive service page (undated, checked October 2026).
- JRC release pages for PVGIS 5.1, PVGIS 5.3 (dataset report dated 26 September 2024) and future release planning (checked October 2026).
- JRC PVGIS data download page and TMY generator page (note dated December 2024, checked October 2026).
- pvlib get_pvgis_hourly documentation and the pvlib 0.16.1 package and test data (checked October 2026).
- PV*SOL help, climate data (footer 2026, checked October 2026).
- HelioScope: Uploading International Weather Files from PVGIS (updated 8 July 2025) and External Weather File Data Sources (updated 21 July 2026).
Last updated 30 October 2026. Next scheduled review: 30 January 2027.