Key takeaways
- Of requests made 2000-2020, 13% by capacity is operating, 10% is active and 75% was withdrawn (Berkeley Lab, Queued Up 2026 edition, data to end of 2025).
- Projects built in 2025 took a median of 61 months from request to operation. It was 36 for 2015 builds and 22 for 2008 builds.
- A signed agreement is not the finish line. Of capacity with agreements signed 2000-2022, 43% was operating and 41% had withdrawn.
- FERC Order 2023 changed studies from one-by-one to cluster studies. Berkeley Lab says it is too early to measure the full effect.
To compare tools for queue requests and study timelines, see the best solar interconnection software.
Interconnection queue at a glance
It is the waiting list for grid access at the transmission level. Each request holds a spot while the grid operator studies what upgrades the project needs.
| Item | Detail |
|---|---|
| What it is | A list of requests to connect generation or storage, kept by an ISO, RTO or utility. Berkeley Lab’s 2026 data covers 7 ISO/RTOs and 50 non-ISO balancing areas, about 98% of installed US generating capacity. |
| Size at end of 2025 | About 2,061 GW active across all request years: 1,312 GW generation and 749 GW storage, in 8,244 requests. Down 10% from about 2,290 GW. |
| Who it affects | Utility-scale and larger C&I developers. Berkeley Lab leaves out systems on the local distribution grid and behind the meter. |
| Rules | FERC Order No. 2023 (issued 28 July 2023) sets rules for transmission providers, per FERC’s explainer. ISO and utility tariffs are not covered here. |
| Not the same as | The interconnection application, which covers the form and drawings for smaller systems. This page covers the queue those requests join. |
Why the interconnection queue matters for developers
The queue sets when a project can sell power. It also sets whether it gets built at all. Most requests in the data never reached operation.
Your in-service date drives a power purchase agreement or other offtake. The median for 2025 builds is 61 months. A date promised at request needs a wide margin. Late study results can also trigger re-studies of other requests. Berkeley Lab notes that this can make later withdrawals costly.
The request names a size and a connection point. So site and layout work come first. See site selection software, utility-scale layout optimisation and substation design. Rooftop and other behind-the-meter systems do not join these queues. See net metering.
What are the stages of the interconnection queue?
Berkeley Lab describes four steps: request, studies, agreement, then construction and operation. A project can withdraw at any point.
- Request: the developer files an interconnection request and joins the queue. FERC’s explainer says Order 2023 requires study deposits with the request. It also requires 90% site control at submission.
- Studies: studies find the upgrades needed and assign their costs. Under Order 2023, a 150-day cluster study comes first, then a facilities study.
- Agreement: the studies end in an interconnection agreement. This is a contract between the grid operator and the plant owner.
- Construction and operation: many projects are then built and reach commercial operation. Berkeley Lab calls a project "active" while it is in study. It is also active if it has an agreement but is not yet operating.
Phase names differ by ISO and utility. This list gives only the steps these two sources describe. For the distributed-system path and PTO, see PTO.
How long does it take, and how many projects get built?
For projects built in 2025, the median was 61 months from request to operation. Of capacity requested in 2000-2020, 13% was operating at the end of 2025.
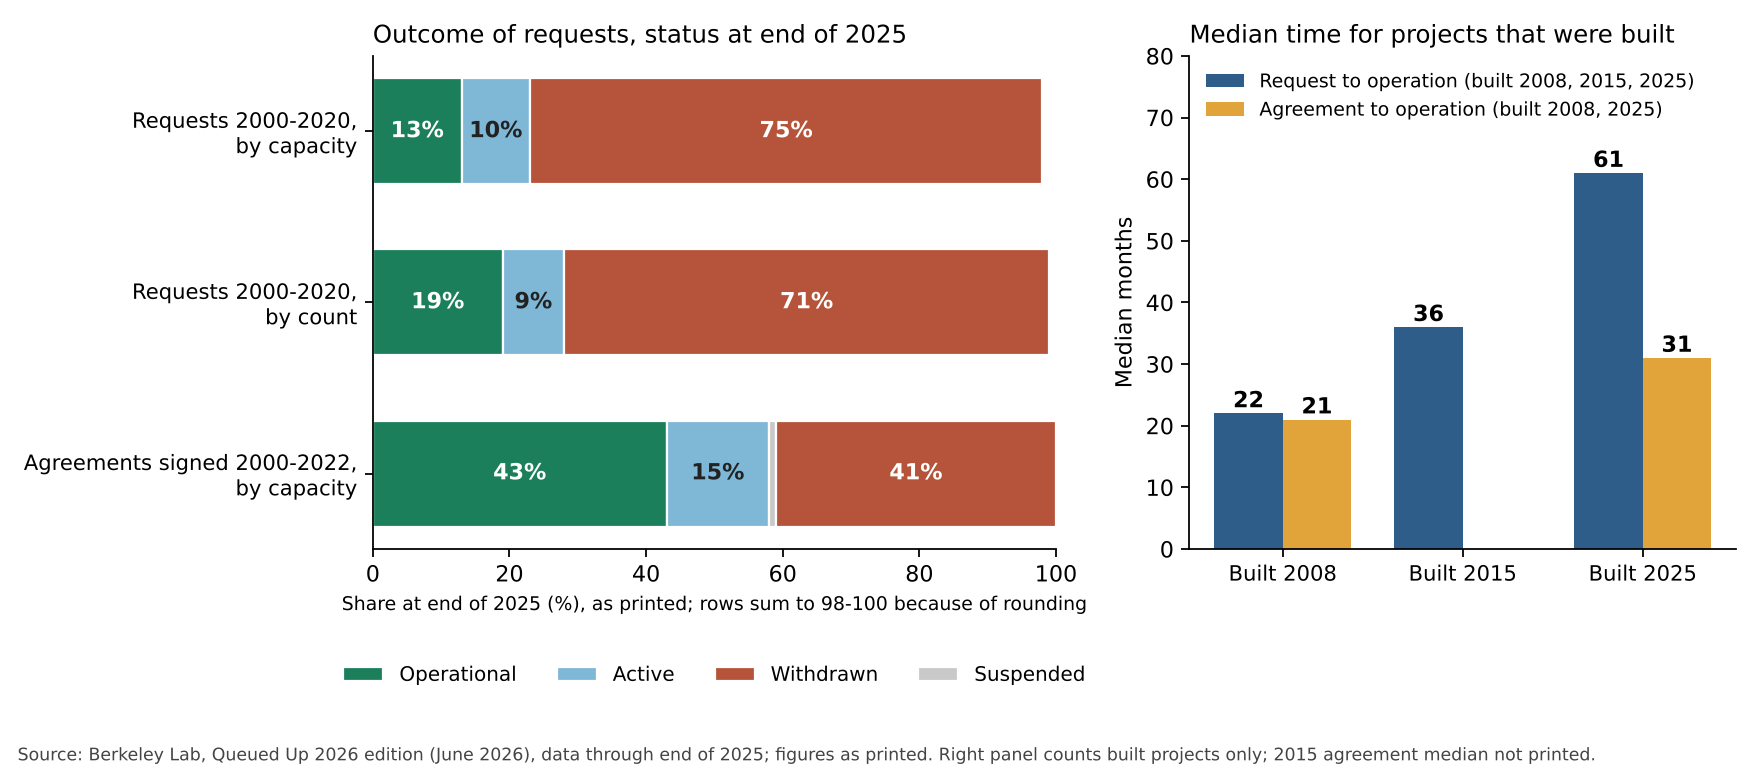
Figure 1. Most requests were withdrawn (75% of 2000-2020 capacity). Median time to operation rose from 22 months (2008) to 61 (2025). The bars show different cohorts. The right panel counts built projects only. Source: Berkeley Lab, Queued Up 2026 edition (data to end of 2025). Percentages are as printed. Active is 10% by capacity but 9% by count.
These numbers have three limits.
- The completion cohort stops at requests made in 2020. Berkeley Lab says newer requests may not have an outcome yet. Some projects take five or more years. The "active" share could still finish or withdraw.
- The median covers built projects only. Withdrawn projects are not in it. The mix of regions in the sample can move it.
- Solar: active capacity was 773 GW, down 19% in 2025. Solar-only completion shares are not used here.
The report also gives medians by project size, from request to agreement, for projects with agreements since 2010. The median is 12 months under 5 MW. It is 15 months from 5 to under 20 MW. For larger projects they sit around 30 months.
How did FERC reforms change the interconnection queue process?
FERC Order No. 2023, issued 28 July 2023 and effective 6 November 2023, replaced one-by-one studies with cluster studies. Its effect on the data is not yet clear.
FERC’s explainer (last updated 23 January 2025) states the aim. It wants to cut backlogs and add certainty. It cites over 10,000 active requests. It also cites over 2,000 GW at the end of 2022. It says 68% of the 2,179 studies completed that year were late. The main requirements are below.
- Cluster studies: batches replace one-by-one, first-come studies. Projects in a cluster share the study costs.
- Money and readiness: study deposits grow with MW. Commercial readiness deposits apply at the start of each study.
- Site control: 90% at request and 100% when the facilities study agreement is signed, with limited exceptions.
- Penalties: a withdrawal that hurts other requests can be penalised. So can a missed study deadline.
Compliance filings were first due 5 December 2023. After two extensions, including one tied to Order 2023-A, the deadline became 16 May 2024.
FERC’s page warns that its text may not fully reflect 2023-A. Later filings are not covered here.
The 2026 edition says the effects "will not be immediate". Most of its data pre-date the reforms, and it calls it too early to measure the full impact.
The previous edition (data to end of 2024) also lists ISO actions. FERC approved PJM’s move to a cluster process in November 2022. It approved MISO’s higher milestone payments and automatic withdrawal penalty in January 2024, and MISO’s queue cap in January 2025. It approved CAISO’s process changes in October 2024. That edition said Order 2023 and other reforms "may have motivated" some 2024 withdrawals.
Worked examples
Example A works out implied totals from printed figures. Example B is an illustration built on assumptions we chose.
Example A: recomputed from Berkeley Lab’s printed figures. The 2026 edition prints 21,927 requests (3,501 GW) for 2000-2020, and its slide notes give 22,061. We used 21,927 and multiplied by the printed shares. Results are rounded, so they carry the rounding of those shares.
| Outcome at end of 2025 | Printed share by count | Implied projects | Printed share by capacity | Implied GW |
|---|---|---|---|---|
| Operational | 19% | 4,166 | 13% | 455 |
| Active | 9% | 1,973 | 10% | 350 |
| Withdrawn | 71% | 15,568 | 75% | 2,626 |
Rounding makes the printed shares add up to 99% by count and 98% by capacity. The average request was 160 MW (3,501 GW over 21,927).
Example B: an illustration, not data or a forecast. Assumptions: 100 requests of 50 MW each, filed January 2027. We assumed 39% reach a signed agreement and 49% of those reach operation. That gives about 19% built, close to the printed share by count.
| Scenario | Agreements | Projects in service | MW in service | Month in service |
|---|---|---|---|---|
| Base case | 39.0 | 19.1 | 955.5 | February 2032 |
| Delay 12 months, no extra withdrawals | 39.0 | 19.1 | 955.5 | February 2033 |
| Delay 12 months, 5 points more withdrawals per 12 months | 34.0 | 16.7 | 833.0 | February 2033 |
| Delay 24 months, 5 points more withdrawals per 12 months | 29.0 | 14.2 | 710.5 | February 2034 |
Where the assumptions come from. The 49% is printed in the previous edition: the share by count of 2000-2021 signed agreements that reached operation. We back-solved the 39% as 19 divided by 49, so the table is arithmetic, not evidence. Stage times total 61 months, the 2026 median for 2025 builds. The 31 months from agreement to operation is also its median, and the 30-month first stage is our assumption.
A delay moves the date for every project that survives. It cuts the count only if delay causes withdrawals, which is our "extra withdrawals" assumption. The sources cited do not show that link. NBER Working Paper 31946 (December 2023) only reports that longer queues mean longer waits. The calculator lets you change every input.
Queue delay calculator
Change the request count, size, pass rates, months and delay. It returns agreements, projects and MW in service, and the month in service.
If the frame does not load, open the queue attrition and delay calculator on its own page.
How solar software handles the interconnection queue
We rated two tools on the company pages we could read. Interconnection.fyi tracks queue requests, and Enverus is rated Partly for study analysis.
| Tool | Queue tracking or study analysis? | What the company page says | Source, checked October 2026 |
|---|---|---|---|
| Interconnection.fyi (GridTracker) | Yes | "Tracking 44,281 interconnection queue requests from 1995 to 2026." Free to browse, with filters by region, state, year, market, project type and status. Developer names and the full export sit behind GridTracker. | Home page, "Data last updated today", no calendar date printed |
| Enverus Interconnect and SUGAR | Partly | Interconnect gives developers scenario analysis and risk assessment. Queue insights get no detail. SUGAR, for grid operators and utilities, claims up to a 2x cut in study time, with no stated baseline. | Enverus power and renewables page, undated |
Partly: the page names the feature but gives few details. Other tools are ranked in our best solar interconnection software and best solar software for utility-scale developers guides.
Common mistakes with the interconnection queue
FAQs
How long is the interconnection queue?
Per Berkeley Lab’s Queued Up 2026 edition, the median project built in 2025 took 61 months from request to operation. That compares with 36 months for 2015 builds and 22 for 2008 builds. It covers built projects only.
What share of queued projects get built?
Of requests from 2000 to 2020, 19% by count and 13% by capacity were operating at the end of 2025. Another 9% by count and 10% by capacity were still active.
Is the queue getting shorter?
Yes, by capacity. Active capacity fell 10% in 2025, to about 2,061 GW. Over 600 GW of new requests came in during 2025, including about 50 GW of imputed hybrid storage.
Do rooftop solar systems join the interconnection queue?
No. This data leaves out systems on the local grid and behind the meter. Smaller systems use a utility application. See the interconnection application page.
Can I look up a project in the queue?
Yes. Interconnection.fyi lists 44,281 requests and lets you filter by state, status and year. Its page prints no calendar date for the data, so the ISO or utility has the latest status.
Related terms
- Interconnection application: the form and drawings that ask a utility to approve a connection.
- Substation design: the grid-side equipment layout a large project connects through.
- Power purchase agreement: the contract that sells the power once the project operates.
- Distributed generation: generation at or near the customer, on the local grid.
Next step: set a cautious in-service date from the 61-month median, then compare the best solar software for utility-scale developers or the best solar interconnection software.
Sources
- Berkeley Lab, Queued Up: 2026 Edition (June 2026, data to end of 2025, coverage, totals, completion shares and medians re-checked 30 October 2026). Previous edition: Queued Up: 2025 Edition (December 2025, data to end of 2024).
- FERC, Interconnection final rule explainer (Order No. 2023) (last updated 23 January 2025, dates and requirements re-checked 30 October 2026).
- NBER Working Paper 31946, An Empirical Analysis of the Interconnection Queue (December 2023, checked October 2026).
- Interconnection.fyi (no calendar date printed, checked October 2026).
- Enverus power and renewables (undated, checked October 2026).
Last updated 30 October 2026. Next scheduled review: 30 January 2027.