Key takeaways
- Screening has two kinds of test. Gates remove a site (too small, too steep, too far from a substation). Scores rank what is left.
- Of our 8 example sites, 3 fail a gate and 5 pass. Site E would score highest (73.75 of 100) but its 11.5% slope breaks an example 10% gate.
- Weights decide the order. Site C ranks first among the 5 passing sites on base and equal weights, but fifth on yield-led weights.
- An average hides weak spots. Site D ranks second (69.58) with 35% of its parcel in a flood zone. Add a gate if that is unacceptable.
- Slope units get swapped: 10% is 5.7 degrees, and 10 degrees is 17.6%. Write the unit beside every limit.
To shortlist land in software, see the best solar site selection software.
Site selection software at a glance
It is a shortlisting tool for land. It comes before survey, layout and the grid application.
| Item | Detail |
|---|---|
| What it does | Loads map layers, applies your rules, shows buildable area and shortlists sites. |
| Inputs | Parcels, terrain, flood and protected areas, grid lines and substations, sometimes irradiance. |
| Output | A map, a buildable-area figure per site and a sorted list. Some tools also score. |
| Standard or rule | None. Limits and weights are the user’s choice, and they change by country and project. |
| Not the same as | A feasibility study, which tests one chosen site in depth. |
Why does site selection software matter?
A developer can drop poor land before paying for a survey. A site that fails on slope, flood or grid distance never reaches survey or design.
It is mainly a ground-mount and utility-scale tool. Rooftop installers use a site survey instead. It relies on GIS layers and land parcel data, so its answer is only as good as those layers. After screening, layout optimisation fills the land you kept.
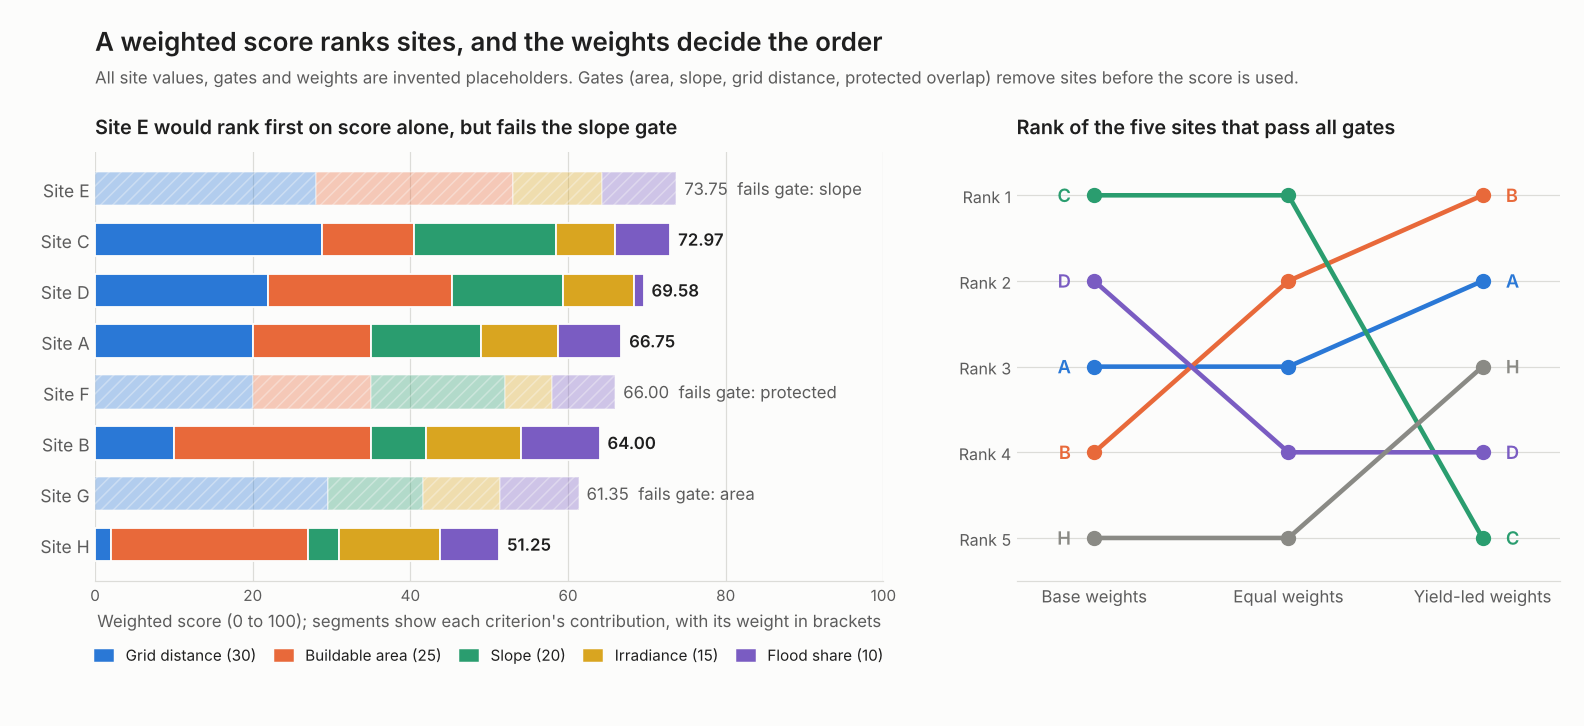
Figure 1. On this example’s sites, the highest raw score belongs to a site that fails a gate, and changing the weights reorders the five that pass.
What criteria does site selection software test?
Five groups of criteria come up again and again: parcel size, slope, grid distance, irradiance and constraints. Limits differ by project, so treat every number as a choice.
| Criterion | What it checks |
|---|---|
| Parcel and buildable area | Size after exclusions |
| Slope and aspect | Gradient and facing direction |
| Grid distance | Distance to a substation or line, and spare capacity |
| Irradiance | Sunlight at the site |
| Constraints | Flood, wetlands, protected land, setbacks |
Company pages describe each criterion this way.
- Parcel and buildable area: PVcase’s Prospect page lets users set a "desired parcel size". Pivvot’s blog says it uses the USDA and NASS Cropland Data Layer "to view and calculate usable acreage". See land parcel data.
- Slope and aspect: Pivvot’s blog says "It’s important to know both percent grade and aspect". See terrain modelling.
- Grid distance: PVcase lets users set an "acceptable distance from substations or power lines". Capacity is a separate question: see the interconnection queue.
- Irradiance: Solargis says its satellite and weather-model data covers any site without on-site measurements. See NSRDB and solar resource data.
- Constraints: PVcase’s FAQ lists "flood zones, waterways, protected areas, existing infrastructure". Pivvot’s blog names FEMA flood data, NWI wetlands and endangered species. See keep-out zones and setbacks.
Published limits vary. The data.gov dataset "Techno-economic screening criteria for utility-scale solar photovoltaic energy installations for Integrated Resource Planning" lists "Steeply sloped areas" at ">10o". It does not say whether that is degrees or percent. It also lists a capacity factor under 20% as an exclusion. Checked again in November 2026, the data.gov page no longer loads, so treat this figure as unconfirmed until you find a live copy. A 2026 paper in ISPRS International Journal of Geo-Information scores slope in percent for PV plants. It says its thresholds "cannot be considered as universal optimal values".
How do gates and scores work together?
Gates remove sites. Scores rank the survivors. The 2026 paper (Ramos-Diez and others, ISPRS International Journal of Geo-Information, April 2026) describes the same split. Restrictions rule land out, and factors grade the rest.
- Choose gates: the limits that make a site unusable, such as minimum buildable area, maximum slope and any protected overlap.
- Apply the gates first. A failed gate removes the site, whatever its other values.
- For each remaining criterion, set a worst value (0 points) and a best value (100 points).
- Score each site on a straight line between those two values, held between 0 and 100.
- Set weights that add to 100, then take the weighted average.
- Test the weights. Re-run with other weights and see which sites stay near the top.
The paper gives every layer equal weight to avoid analyst bias, on a 0 to 3 scale. It scores some layers only as 0 or 3. Equal weights are one choice, not a neutral one.
Worked example: scoring 8 example sites
5 of 8 sites pass four gates. Site C ranks first on base weights with 72.97 points. The calculator below reproduces every figure.
| Input (example placeholders) | Value |
|---|---|
| Gates | Buildable area at least 25 ha. Mean slope at most 10%. Substation within 8 km. No protected-area overlap |
| Bounds (0 points / 100 points) | Irradiance 1,700 / 1,900 kWh per m2 per year. Slope 10% / 0%. Area 25 / 100 ha. Grid 8 / 0.5 km. Flood share 40% / 0% |
| Base weights | Grid 30, area 25, slope 20, irradiance 15, flood share 10 (total 100) |
Site E has the top raw score but fails the slope gate.
| Site | GHI / slope % | Area ha / grid km | Flood % / protected | Gates and score |
|---|---|---|---|---|
| A | 1,830 / 3.0 | 70 / 3.0 | 8 / No | Pass, 66.75 |
| B | 1,860 / 6.5 | 120 / 5.5 | 0 / No | Pass, 64.00 |
| C | 1,800 / 1.0 | 60 / 0.8 | 12 / No | Pass, 72.97 |
| D | 1,820 / 3.0 | 95 / 2.5 | 35 / No | Pass, 69.58 |
| E | 1,850 / 11.5 | 140 / 1.0 | 2 / No | Fail: slope, 73.75 |
| F | 1,780 / 1.5 | 70 / 3.0 | 8 / Yes | Fail: protected, 66.00 |
| G | 1,830 / 4.0 | 22 / 0.6 | 0 / No | Fail: area, 61.35 |
| H | 1,870 / 8.0 | 100 / 7.5 | 10 / No | Pass, 51.25 |
GHI is global horizontal irradiation in kWh per m2 per year, an example value. Failed sites keep a score only to show what the gate removed. The sites show three patterns.
- Gates matter. Site E leads on raw score by 0.78 points over Site C. Without the slope gate it tops the list.
- Averages hide weak spots. Site D has a flood score of 12.5 of 100, yet ranks second. Its area and grid scores carry it.
- Bounds matter. Our five passing sites differ by 3.9% in irradiance (1,800 to 1,870). Score irradiance between the lowest and highest of the five instead of our fixed bounds. Site C’s irradiance score then falls from 50 to 0. Sites A and B swap places. Sites B and D are close to a tie (64.86 and 64.87).
Now change the weights. Equal weights are 20 for each criterion. Yield-led weights are irradiance 40, area 20, grid 15, slope 15 and flood share 10 (example).
| Rank | Base weights | Equal weights | Yield-led weights |
|---|---|---|---|
| 1 | C (72.97) | C (70.53) | B (72.25) |
| 2 | D (69.58) | B (69.67) | A (66.50) |
| 3 | A (66.75) | A (68.33) | H (65.50) |
| 4 | B (64.00) | D (61.83) | D (65.42) |
| 5 | H (51.25) | H (57.33) | C (64.23) |
No site is best under every set. A sound shortlist keeps sites that rank well under several sets. Then test those in depth. In real work, irradiance changes yield, so check it with energy yield simulation.
Site screening score calculator
Pick an example site or enter your own values. Open the settings to change the gates, bounds and weights.
If the calculator does not load, open the site screening calculator on its own page.
How solar software handles site selection
Three of the four tools document parcels or buildable area, and only Solargis documents irradiance. Ratings come only from the company pages listed under the table. Not stated means the company page we cite does not say. Partly means the page covers only some of it.
| Tool | Parcels or buildable area | Slope and grid distance | Irradiance | Ranking or scoring |
|---|---|---|---|---|
| PVcase Prospect | Yes | Slope yes. Grid yes | Not stated | Partly: sort and filter |
| Pivvot | Yes | Slope partly (blog). Grid partly (blog) | Not stated | Partly: cost surface |
| Glint Solar | Yes | Slope yes. Grid yes | Not stated | Yes: rank by acreage |
| Solargis Prospect | Not stated | Not stated | Yes | Partly: compare sites |
Company pages reviewed
- PVcase: the Prospect site selection page (undated, 2026 copyright) and the help page on exclusive and US-only features (updated 13 February 2026). The help page describes filtering and sorting parcels by DC capacity, AC capacity and AC yield. That is sorting, not a score.
- Pivvot: the blog "6 data sources to expedite site selection" (undated) and the platform page (metadata dated 15 October 2026). The platform page lists parcel reports and constraint layers. It also lists a Cost Surface report that can "visualize project suitability and cost implications across multiple site options". It does not mention slope or substations.
- Glint Solar: the platform page (undated), which says "Apply constraints once: substation distance, slope, parcel size, exclusion zones". The Land Screening page (undated) says results can be filtered and ranked by buildable acreage and parcel count.
- Solargis: the Prospect knowledge base (published 18 February 2025, updated 24 September 2026). It describes solar resource data and a Compare page. It does not mention terrain, parcels or grid. Solargis’s site selection page says users can compare sites and pick those with the highest returns.
What to check in a tool
- Data layers and their dates. Ask who supplies each layer and when it was last updated.
- Custom gates. Can you set your own limits and units?
- Scores or only filters. Many tools sort and filter without scoring.
- Export. Look for parcel lists, maps and CAD or GIS files.
- Region coverage. Several pages describe US-only data.
None of the pages reviewed describes a weighted score like ours. The best solar site selection software list compares the tools.
Common mistakes with site selection software
FAQs
What is the difference between site selection software and GIS?
GIS is the general map system. Site selection software applies solar rules to GIS layers and returns a shortlist. See the GIS page for layers.
What slope is too steep for a solar farm?
There is no universal limit. It depends on the racking or tracker, the aspect and the grading budget. The data.gov screening table lists a slope threshold without a clear unit, and the Ramos-Diez paper uses its own percent bands. Set your own limit and state its unit.
How close must a site be to a substation?
The pages we reviewed gave no single distance. Tools let you set an acceptable distance from substations or lines. Distance is only a proxy, because spare capacity and upgrade cost decide the outcome. See the interconnection queue.
Should I use equal weights?
Equal weights are a starting point, as in the Ramos-Diez paper. Test other weights, as in our example, where the first-ranked site changed. Keep the sites that stay near the top.
Does a high score mean the site is viable?
No. A score ranks candidates against your own rules. Viability needs a survey, a grid study, permits and cost. See site plan and AHJ for the approval side.
Related terms
- GIS: the map system that holds the layers.
- Land parcel data: property outlines and county records.
- Terrain modelling: slope and aspect from elevation data.
Next step: with gates and weights set, compare the best solar site selection software, then test the top site with a feasibility study.
Sources
- PVcase: Site selection and site analysis (undated, checked October 2026) and PVcase help: Exclusive and US-only features (updated 13 February 2026).
- Pivvot blog: 6 data sources to expedite site selection (undated) and Pivvot platform (metadata 15 October 2026).
- Glint Solar: PV platform (undated), Land Screening, USA (undated) and PV Tech, 8 September 2026.
- Solargis knowledge base: Introduction to Prospect (published 18 February 2025, updated 24 September 2026) and Solargis: site selection (undated).
- Ramos-Diez and others, ISPRS International Journal of Geo-Information 15, 157 (published 3 April 2026, checked 30 October 2026).
- Techno-economic screening criteria for utility-scale solar photovoltaic energy installations for Integrated Resource Planning, data.gov entry (undated, contacts include CPUC staff, checked 30 October 2026, the page returned a 404 error when rechecked 3 November 2026).
- Worked example: example values, computed by the SolarSoftwares editorial team.
Last updated 3 November 2026. Next scheduled review: 3 February 2027.