Solar interconnection software helps developers study how a new solar plant will connect to the power grid (the process called interconnection). Enverus ranks first, at 59.8/100. All three queue tools here are utility-scale tools, and none of them files a home interconnection application with a utility.
Read this first if you install home or business rooftop systems. We looked for software that fills in and sends a rooftop grid form, then tracks it to PTO (permission to operate). We did not find a product an installer buys for that job alone. Utilities buy the web portals where you file, such as PowerClerk and GridUnity. Installers just use them, so we do not rank them here. Installers track interconnection and PTO as a stage in their project or workflow software. See our solar project management ranking.
This is a thin category: only 3 tools qualify, and we add Sitetracker as a labelled fourth. Our rules ask for at least five ranked products, but we will not pad the list. Three tools are built for grid queues. The fourth, Sitetracker, is a general project tool and a weak match. The main buyers are developers, IPPs (independent power producers) and their lenders. They work in queues run by US regional grid operators, known as ISOs and RTOs.
Quick picks
Rank | Product | Best for | Starting price (checked October 2026) | Pricing model | Free plan / trial | Score /100 |
|---|---|---|---|---|---|---|
1 | Interconnection cost and queue-risk studies for utility-scale developers | Quote only | Subscription via sales | Demo only | 59.8 | |
2 | Map-based injection capacity at every US substation | Quote only (third-party sources) | Not published | Demo only (per third parties) | 55.2 | |
3 | Smaller developers screening parcels, permitting risk and grid capacity together | Quote only (third-party sources) | Enterprise or managed service | Demo only | 51.9 | |
4 | Large developers tracking many sites through deployment | Quote only | Quote via sales | Demo only | 47.1 |
✓ Verified on the company’s own pricing page. ◐ Published by the company outside its pricing page (help centre, store or press release). ? We could not read the company’s pricing page, so the figure is not confirmed. Prices checked October 2026.
Quote only means the company shows no public price. You ask it for a quote.
How the 4 tools scored
- Use-case fit 35%
- User reviews 20%
- Pricing 15%
- Ease of use 10%
- Support 10%
- Momentum 10%
Tool | Score chart | Score |
|---|---|---|
59.8 out of 100 | 59.8 | |
55.2 out of 100 | 55.2 | |
51.9 out of 100 | 51.9 | |
47.1 out of 100 | 47.1 |
Each bar shows the weighted score out of 100. Tools marked (general) are general tools that are not solar-specific.
Sub-scores at a glance (0-10)
Product | Use-case fit | User reviews | Pricing | Ease of use | Support | Momentum | Total /100 |
|---|---|---|---|---|---|---|---|
7.5 | 5.0 | 4.0 | 5.0 | 5.0 | 7.5 | 59.8 | |
7.5 | 5.0 | 4.0 | 5.0 | 5.0 | 3.0 | 55.2 | |
5.8 | 5.0 | 4.0 | 5.0 | 5.0 | 5.5 | 51.9 | |
3.3 | 6.0 | 4.0 | 5.0 | 7.5 | 5.0 | 47.1 |
A 5.0 on reviews, ease, support or momentum is our neutral score. We use it when public evidence is thin. It is not a judgement.
How did we rank these tools?
How the score is weighted
- Use-case fit 35%
- User reviews 20%
- Pricing 15%
- Ease of use 10%
- Support 10%
- Momentum 10%
We scored 7 products from 22 to 24 October 2026 and rank 4. The other 3 sit under "Also considered". This was desk research from company pages, help docs, trade press and public reviews. We did not run studies in any tool.
We could describe Nira Energy and Paces only from third-party sources, so each loses 2 points. We score each product on six criteria.
- Use-case fit (35%): How well it does this page’s job. Here that means grid studies, capacity or queue data, and tools to draft or track applications.
- User reviews (20%): G2 and Capterra ratings, weighted by review count. The three queue tools have no public reviews, so each gets a middle score of 5 out of 10.
- Pricing (15%): Published prices score higher than quote-only. All four are quote only.
- Ease of use, support and momentum (10% each): Review sub-scores and dated product news. With no evidence, each gets the middle score.
Scores are for this page’s job. A tool can score differently on another page. Sitetracker’s match score is below our usual minimum of 4 out of 10, but we rank it, clearly labelled, so the list is not just three.
SurgePV is not part of this ranking. Read the full method: how we score software.
How do utility-scale queue tools differ from rooftop grid forms?
- Utility-scale (what this page ranks): A developer asks to plug a new power plant into the grid. It files with a utility, an ISO (independent system operator) or an RTO (regional transmission organisation). Then it waits for studies that set the cost of grid upgrades. The tools below copy or predict those studies. That helps firms pick points with spare room and avoid upgrade bills that kill projects.
- Home and small business (not ranked): The installer sends an application through the utility’s portal and waits for approval. Then the crew installs, the system passes inspection, and the utility grants PTO. The software need is tracking and paperwork across many utilities. Project and workflow tools cover that.
1. Enverus (Pearl Street Interconnect): best for interconnection cost and queue-risk studies
Best for: Utility-scale developers, M&A (mergers and acquisitions) teams and lenders who weigh grid risk across US ISO queues. Score: 59.8/100.
What it is: Enverus is an energy data firm. It bought Pearl Street Technologies on 13 March 2025. Pearl Street’s SUGAR engine (a grid simulator) now runs two Enverus products. Interconnect is for developers. SUGAR is for the grid operators who run the official studies. Enverus’s own pages call the first one both Interconnect and Connect.
Why we picked it: It scored highest of the queue tools on fit and product activity. Its facts also come from Enverus’s own pages, not third parties.
Key features:
- Custom interconnection studies and risk checks.
- Injection capacity maps.
- Shadow studies (your own run of the official study) and cost-sharing scenarios.
- Queue outlook built with machine learning (software that learns from data) that flags delay and cost risk.
- Pairs with the Enverus PRISM data platform.
Pricing: Quote only, as a subscription through sales or a product tour. Checked October 2026 on the Enverus power and renewables page.
Pros (from our research):
- Grid operators buy the same engine, so your studies use the same method as the official ones.
- Shadow studies and cost sharing help you price upgrade risk before you buy or sell a queue spot.
- It publishes often: Enverus released a 2026 Interconnection Queue Outlook in February 2026.
Cons (from our research):
- No published pricing.
- Utility-scale only. It does nothing for home or C&I (commercial and industrial) jobs.
- No user reviews show how its studies match ISO results in practice.
Reviews: No user reviews found as of October 2026.
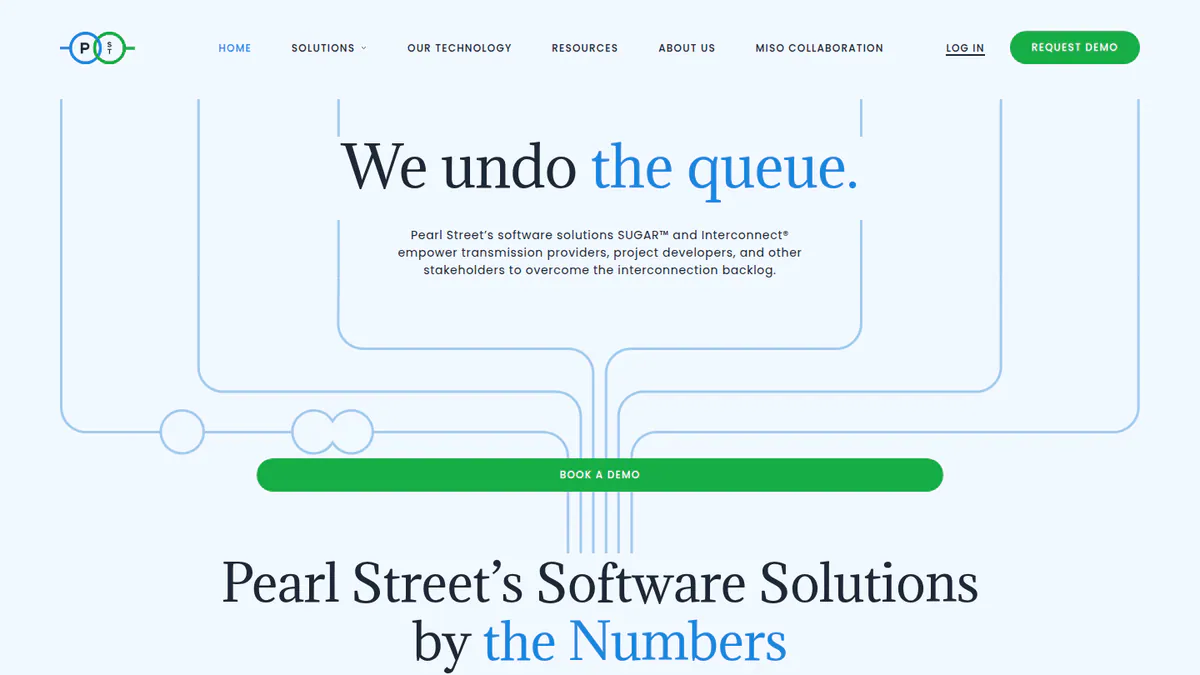
Want to see Enverus (Pearl Street Interconnect) working? Book a demo with the SolarSoftwares team.
Book a demoYour request goes by email to the SolarSoftwares team. A time is set only after we reply. It does not change any score or ranking.
2. Nira Energy: best for map-based injection capacity at every US substation
Best for: Mid-sized and large developers who want to see where to plug in across all US ISOs before they pick a site. Score: 55.2/100.
What it is: Nira Energy, founded in Denver in 2021, maps spare grid room at substations. It runs studies at every point where a plant can plug in. It is a Y Combinator company (Winter 2022 batch). Note: we could not open Nira’s website. This section draws only on its Y Combinator profile, a 2026 Infocast sponsor page, Latitude Media (May 2025) and Simple Thread (October 2023).
Why we picked it: It shows spare capacity at substations across all US ISOs in one map, a fast first screen for site hunting. It lost 2 points because we could only use outside sources.
Key features:
- Injection studies at every point of interconnection.
- Map of spare capacity at substations.
- Capacity and upgrade-cost data across all US ISOs (per the 2026 Infocast page).
- Results update as the queue changes.
- Tools for big loads like data centres, not just power plants.
Pricing: No published pricing found. Third-party sources describe a paid product with demos on request. Checked October 2026, but we could not fetch Nira’s site (niraenergy.com).
Pros (from our research):
- One map shows spare room at substations across US ISOs, so you can drop weak grid points before land work starts.
- Results update as the queue changes, so your screen does not go stale.
- Large developers such as AES and Cypress Creek use it, per third-party coverage.
Cons (from our research):
- Its claims of more than 97% accuracy against ISO studies and 50-100 times faster runs come from press coverage, not user reviews.
- Sources show US ISO markets only.
- No land, owner or environmental layers are documented, so you will likely still need a site tool.
Reviews: No user reviews found as of October 2026.
What we could not confirm: any of these facts on Nira’s own site, or coverage outside the US.
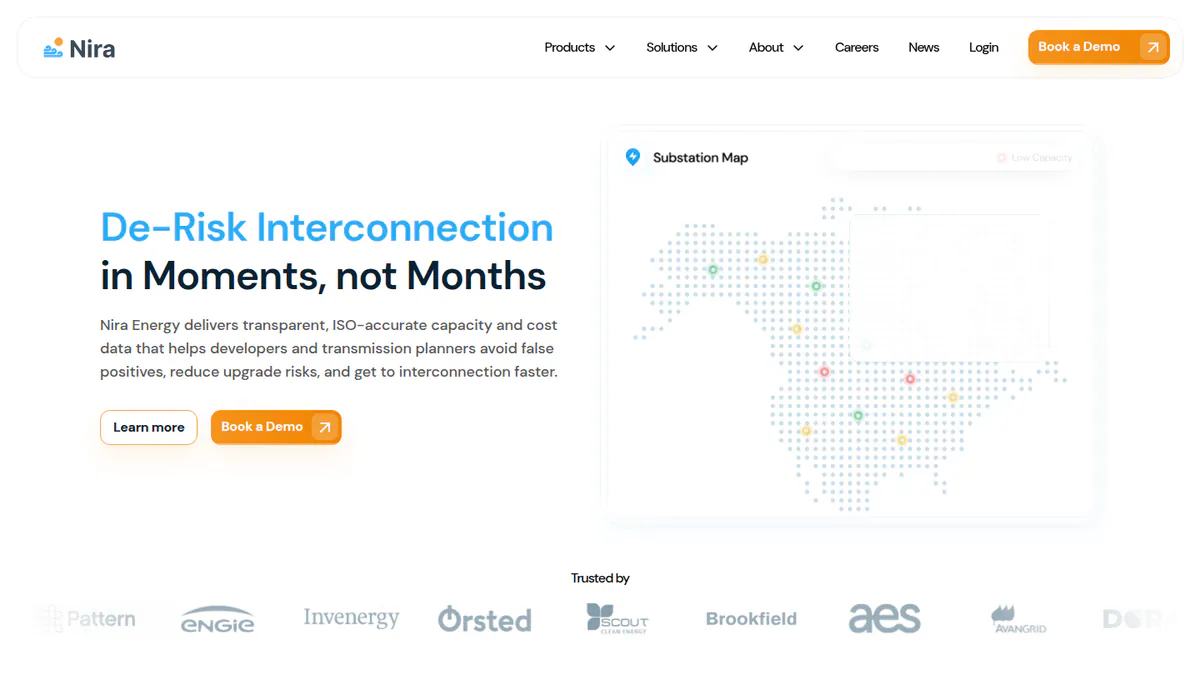
Want to see Nira Energy working? Book a demo with the SolarSoftwares team.
Book a demoYour request goes by email to the SolarSoftwares team. A time is set only after we reply. It does not change any score or ranking.
3. Paces: best for smaller developers screening parcels, permitting risk and grid capacity together
Best for: Small and mid-sized US renewable and community-solar developers who want land, permit and grid checks in one place. Score: 51.9/100.
What it is: Paces is an AI tool. Developers use it to find, rank and check sites across 155M+ US parcels. It puts grid room next to environmental and zoning data. Based in New York, it is a Y Combinator company (Summer 2022 batch), and it now also serves data-centre developers. It raised a USD 11 million Series A in July 2024. Note: Paces’ own site did not show up in our searches, so this section relies on its Y Combinator profile, ESG Dive and DataDrivenAEC (July 2026).
Why we picked it: It is the only ranked tool that pairs grid capacity with land, zoning and permit risk. That suits smaller teams without separate site and grid tools.
Key features:
- Grid capacity and power-flow results.
- Parcel search and ranking across 155M+ US parcels.
- Environmental, zoning and permit risk data (Permitting Predictor).
- AI-drafted due-diligence (site check) reports, plus draft permit and grid forms.
- Risk heatmaps, pipeline tracker and landowner contacts.
Pricing: DataDrivenAEC reports no public self-serve pricing and no free tier. Large-company plans are custom. A done-for-you service tier is priced apart. Checked October 2026, but not confirmed on the company site.
Pros (from our research):
- Grid capacity sits next to land and permit risk, so one screen weeds out weak sites early.
- It drafts interconnection applications, the closest any ranked tool gets to the filing itself.
- A done-for-you service tier helps developers without an in-house team.
Cons (from our research):
- Its grid studies go less deep than the two study tools above.
- No public self-serve pricing and no free tier, per DataDrivenAEC.
- US only, with no user reviews to judge it.
Reviews: No user reviews found as of October 2026 (a G2 page exists with no rating).
What we could not confirm: its features and pricing on Paces’ own site.

Want to see Paces working? Book a demo with the SolarSoftwares team.
Book a demoYour request goes by email to the SolarSoftwares team. A time is set only after we reply. It does not change any score or ranking.
4. Sitetracker (general infrastructure deployment software): best for tracking many sites through deployment
Best for: Large developers, IPPs and utilities that need one general system, not a grid study tool, to track sites, permits and building work. Score: 47.1/100.
What it is: Sitetracker Inc., based in Montclair, New Jersey, makes a tool that large firms use to build and run many sites. It covers site work, permits, building, O&M (operations and maintenance) and assets. Telecoms, utilities, EV charging and renewables firms use it.
Why we picked it: It is the only ranked tool with user reviews, and it tracks a large pipeline of sites in one system. We include it, clearly labelled, so the list is not just three.
Key features:
- Planning that lines up sites, permits and money.
- Build scheduling and cost control.
- GIS Link mapping.
- Lease and contract management.
- Mobile app, reports and an AI assistant called Scout.
Pricing: Quote only, with a live demo. Checked October 2026 on the Sitetracker renewable energy page.
Pros (from user reviews):
- G2 reviewers call it highly customisable and praise its map and tracker features (G2).
- A 2019 Capterra reviewer says templates make it easy to scale deployments (Capterra).
- G2 reviewers praise the support team.
Cons (from reviews and our research):
- A 2019 Capterra reviewer found it slower than other systems.
- G2 reviewers say asset management has room to improve.
- Its renewables page does not mention interconnection tracking or name solar customers. Confirm both in a demo.
Reviews: G2 4.3/5 (31 reviews) and Capterra 5.0/5 (1 review, from 2019), checked October 2026.
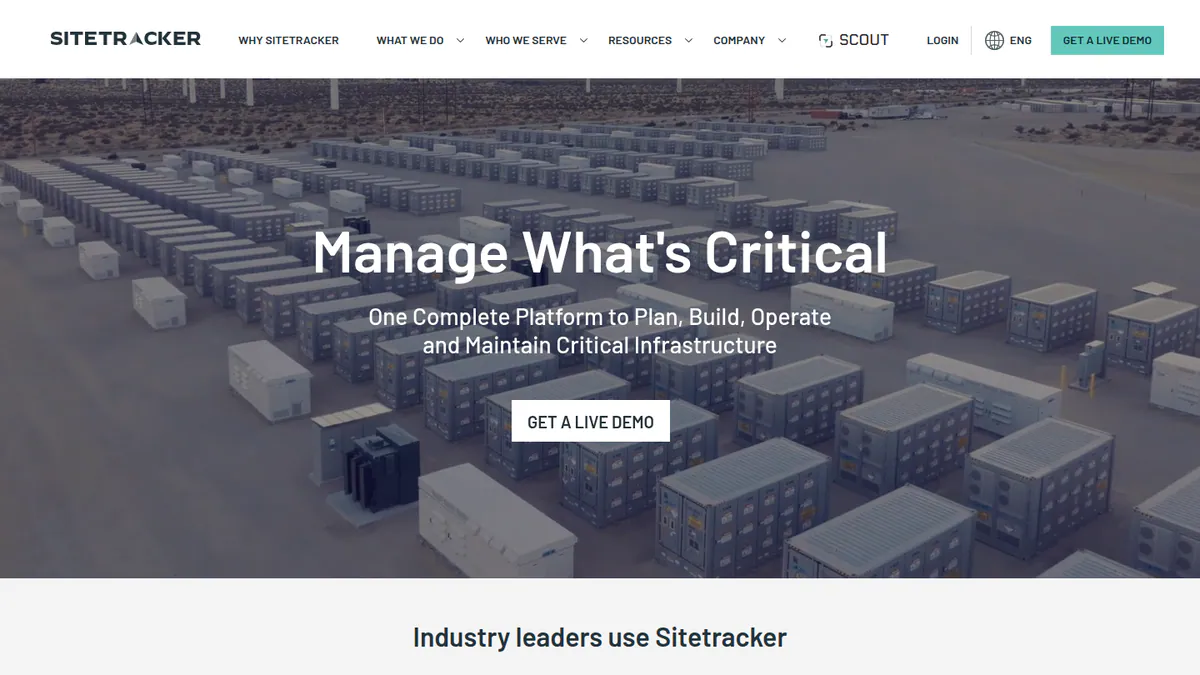
Want to see Sitetracker (general infrastructure deployment software) working? Book a demo with the SolarSoftwares team.
Book a demoYour request goes by email to the SolarSoftwares team. A time is set only after we reply. It does not change any score or ranking.
How do the 4 interconnection tools compare?
Product | Main question it answers | Interconnection studies | Land and permitting data | Drafts applications | Fact source | Price |
|---|---|---|---|---|---|---|
What will this queue position cost and when? | Yes (SUGAR engine) | Not documented (pairs with PRISM) | Not documented | Company | Quote only | |
Where is spare capacity at substations? | Yes, every POI | Not confirmed | Not documented | Third-party | Quote only | |
Which parcels clear land, permit and grid screens? | Capacity and power-flow results | Yes, 155M+ parcels | Yes (AI-drafted) | Third-party | Quote only | |
Where is each site in deployment? | No | GIS mapping | Not documented | Company | Quote only |
Also considered
The first three scored below the minimum score for this job. The last entry is not scored, because utilities buy those platforms.
- Coperniq (scored 38.4/100): A home solar ops tool whose job steps include a PTO stage. It shows no tools for grid forms.
- Scoop Solar (scored 33.5/100): A field service and project hub with steps you can set up. It shows no grid tools.
- SolarNexus (scored 33.0/100): Solar business software with custom steps. It shows no grid tools.
- PowerClerk and GridUnity: Portals that utilities buy to take grid requests. Installers and developers only fill in forms there, so we do not rank them.
How do you choose solar interconnection software?
- Building utility-scale projects and need to price grid upgrade risk or trade queue spots? Pick Enverus.
- To see spare capacity across US substations before land work starts, shortlist Nira Energy. Ask for proof it matches ISO results.
- Smaller developers checking land, permits and grid together should pick Paces. For more land tools, see our solar site selection ranking.
- Already run many sites and mainly need to track them? Look at Sitetracker, but confirm its interconnection tracking in a demo.
- If you install home or rooftop C&I systems, skip this category. Track applications and PTO in a tool from our project management ranking, and permits in our permitting ranking.
- For more developer tools, see the site selection and GIS hub and our guide to software for utility-scale developers.
Want more choices? Browse every tool we checked in our operations and project management category.
Solar interconnection software FAQs
How long does solar interconnection take?
It varies by utility, ISO and project size, and we found no solid figure. For utility-scale projects, queue studies and grid upgrades drive the wait. Enverus publishes a yearly Interconnection Queue Outlook (2026 edition released February 2026). For home systems, the utility’s review and PTO step set the pace.
What is PTO (permission to operate) in solar?
PTO is the utility’s written OK to switch on a grid-tied system after install and a passed check. Until it arrives, the system should not export. Installers track it as the last project stage. In October 2026, Coperniq’s job steps ran from survey through permit, install, inspection and PTO.
How do installers track interconnection applications across many utilities?
Mostly in project or workflow software, with a stage per utility step. Each stage lists the papers needed to close it. None of the queue tools here does this, and Sitetracker serves large site owners. Our solar project management ranking lists tools with interconnection and PTO stages (checked October 2026).
What is PowerClerk and who uses it?
PowerClerk is a web portal where utilities take grid hookup requests. The utility buys it, and installers file through it. Installers do not choose or pay for it, so we do not rank it against installer or developer software (October 2026).
What is an interconnection queue and how can developers de-risk it?
An interconnection queue is the line of plant requests an ISO or utility studies before they join the grid. Developers cut risk by testing spare room and upgrade costs first. Nira Energy claims over 97% accuracy against ISO studies. Enverus offers shadow studies and cost-sharing scenarios (checked October 2026).
Sources
All checked 22 to 24 October 2026.
- Enverus: power and renewables, Pearl Street acquisition release, 2026 Interconnection Queue Outlook
- Nira Energy: Y Combinator profile, Infocast 2026 sponsor page, Latitude Media, May 2025, Simple Thread, October 2023
- Paces: Y Combinator profile, DataDrivenAEC, ESG Dive
- Sitetracker: renewable energy page, G2, Capterra
- Also considered: Coperniq, Scoop Solar, SolarNexus
Last updated 28 October 2026. Next scheduled review: 23 January 2027.