Key takeaways
- Our 1 MWdc example (0.080 USD per kWh rising 2% a year, 0.5% degradation, 25 years) has a project (unlevered) IRR of 9.96%.
- With 60% debt at 6.5%, equity (levered) IRR is 12.50%, which is 2.54 points higher.
- At 0.050 USD per kWh the same debt hurts: project IRR is 4.05% and equity IRR 2.58%, with debt service uncovered (cover 0.21).
- Flows that change sign more than once can have several IRRs. Flows of -1,000, +2,300 and -1,320 give both 10% and 20%.
- In our two-option test (1 MWdc at 1,550 and 2 MWdc at 1,400 kWh per kWdc), IRR and NPV at 6% disagree. They swap at 7.10%.
To see which tools report project and equity IRR, see the best solar financial modeling software.
IRR at a glance
IRR answers one question: what yearly return do these cash flows earn? It does not say how much money the project makes.
| Item | Detail |
|---|---|
| Formula | Find r where the sum of Ct ÷ (1 + r)^t over every year is zero. Ct is year t’s net cash flow. |
| Unit and range | Percent a year. Our example (0.080 USD per kWh rising 2% a year, 0.5% degradation, 60% debt at 6.5%): 9.96% project, 12.50% equity. |
| Where it matters | Commercial and utility proposals, lender and investor screening, PPA price setting. |
| Standard or rule | No single standard. The result depends on the cash flows, the timing and whether tax and debt are included. |
| In software | Financial modules report it. Each tool states its own basis, so read the help page. See the best solar financial modeling software. |
Why does IRR matter for installers?
For commercial buyers, IRR is how a solar proposal gets compared with other uses of capital. Aurora’s help page, as read in October 2026, says IRR and NPV are typically the primary metrics for commercial projects.
It also has limits that your proposal tool may not show. The same page says IRR is not meaningful for zero-down loan deals, because the customer makes no upfront investment. We could not reopen it on 30 October, so check its current wording. For those deals, see payback period and lifetime savings. A buyer’s finance team will ask which cash flows you used, so state them.
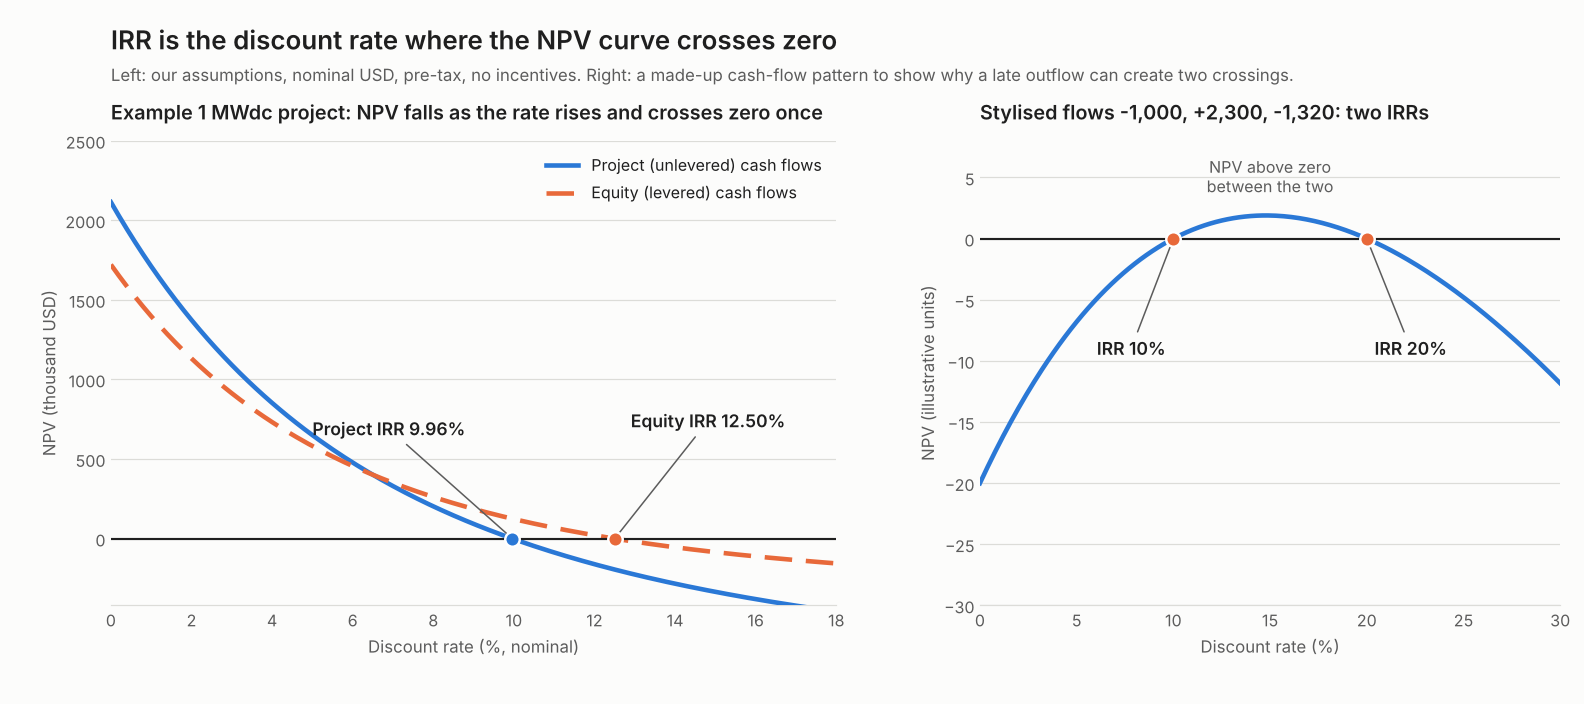
Figure 1. A normal solar project crosses zero once, at its IRR, while a late outflow can make the curve cross twice.
What is the difference between project IRR and equity IRR?
Project IRR uses cash flows before any debt. Equity IRR uses what is left for the owner after debt is drawn and repaid. They are also called unlevered and levered IRR.
Renewables Valuation Institute’s course defines a levered return as the equity return when a project is financed with both debt and equity. It defines an unlevered return as the return when financed solely with equity. Solargis Prospect reports an IRR "for the Project" and an equity IRR as separate results.
| Item | Project (unlevered) IRR | Equity (levered) IRR |
|---|---|---|
| Year 0 flow | Full capex | Capex less the loan |
| Later flows | Revenue less O&M and replacements | The same, less debt service |
| Question answered | Is the asset good, whoever pays? | What does the owner’s cash earn? |
| Our example | 9.96% | 12.50% |
SAM’s IRR page adds that its PPA models use after-tax cash flow from the owner’s view. In two-partner models they report each partner’s IRR. Our example has no tax, so its basis differs from SAM’s.
How do you calculate IRR?
IRR has no closed form for more than a few years. Software searches for the rate where NPV reaches zero. It does so by trial.
- List net cash flows by year: capex as a negative at year 0, then revenue less O&M and any replacement.
- For a trial rate r, divide each year’s flow by (1 + r)^t and add them up. That is the NPV.
- Find two rates where the NPV has opposite signs. A zero lies between them.
- Narrow the gap by bisection (halve it each time), or by Newton steps, until the NPV is close to zero.
- Check the sign pattern. No sign change means no IRR. Several changes mean there may be several.
Excel does the same. Its help says IRR uses an iterative technique, assumes a 10% guess if you give none, and returns #NUM! after 20 tries. It needs at least one positive and one negative value, at regular intervals. XIRR takes dates and uses a 365-day year, with a limit of 100 tries. Our convention here: capex at year 0, all other flows at year end.
Worked example: a 1 MWdc ground-mount project
Our project has a project IRR of 9.96% and an equity IRR of 12.50%, with 60% debt at 6.5%. The calculator below reproduces these figures.
The IRR calculator also opens on its own page, which suits a phone.
| Input (all our assumptions) | Value |
|---|---|
| Size and capex | 1,000 kWdc at 1.10 USD per W = 1,100,000 USD at year 0 |
| Energy | 1,550 kWh per kWdc in year 1 (1,550,000 kWh), falling 0.5% a year. 25 years |
| Price | 0.080 USD per kWh in year 1, rising 2% a year |
| O&M | 14 USD per kWdc in year 1 (14,000 USD), rising 2% a year |
| Inverter replacement | 0.06 USD per W (60,000 USD) in year 13, not escalated |
| Debt | 60% of capex (660,000 USD), 6.5%, 15 years, level payments of 70,193 USD |
| Left out | Tax, depreciation, incentives, reserve accounts, fees, land and insurance |
See degradation rate for the 0.5% input and O&M for cost lines. For a price per kWh from a contract, see power purchase agreements.
| Result | Value |
|---|---|
| Year-1 revenue, O&M and net flow | 124,000, 14,000 and 110,000 USD |
| Year-13 net flow (after replacement) | 70,326 USD |
| Project IRR (one sign change, one root) | 9.96% |
| Equity cash at year 0 | -440,000 USD |
| Equity IRR | 12.50% |
| Lowest debt cover (net flow ÷ debt service) | 1.00 in year 13, against 1.57 in year 1 |
The year-13 cover is thin because the replacement falls inside the loan term. A lender would likely test that, and the model has no reserve. NPV is covered on the NPV page. For a flat price per kWh see LCOE.
One input at a time, with the rest at base, the project IRR moved as follows.
| Input changed | Low value | Project IRR at low | High value | Project IRR at high |
|---|---|---|---|---|
| Price, year 1 (USD per kWh) | 0.070 | 8.15% | 0.090 | 11.68% |
| Price escalation (a year) | 0% | 7.68% | 3% | 11.07% |
| Capex (USD per W) | 1.00 | 11.16% | 1.30 | 8.02% |
| Year-1 yield (kWh per kWdc) | 1,400 | 8.57% | 1,700 | 11.30% |
| Degradation (a year) | 0.3% | 10.19% | 0.8% | 9.62% |
| Inverter replacement (USD per W) | none | 10.15% | 0.12 | 9.77% |
The equity IRR moves more, in both directions.
| Input changed | Low value | Equity IRR at low | High value | Equity IRR at high |
|---|---|---|---|---|
| Price, year 1 (USD per kWh) | 0.070 | 9.28% | 0.090 | 15.73% |
| Price escalation (a year) | 0% | 8.64% | 3% | 14.26% |
| Capex (USD per W) | 1.00 | 14.75% | 1.30 | 9.06% |
| Year-1 yield (kWh per kWdc) | 1,400 | 10.01% | 1,700 | 15.00% |
| Degradation (a year) | 0.3% | 12.87% | 0.8% | 11.94% |
| Inverter replacement (USD per W) | none | 12.82% | 0.12 | 12.18% |
In the weaker cases, debt service exceeds net flow in some years. We treat each shortfall as an extra equity top-up, so equity flows change sign. Even so, one IRR is found. The 0.050 price case in the next section does the same.
For an 8% hurdle rate, the project needs a year-1 price of at least 0.0692 USD per kWh on these other inputs. For a 10% hurdle it needs 0.0802.
Where does IRR mislead?
IRR misleads through repeated sign changes, loose timing, unequal option sizes, the reinvestment reading and debt. Check each one before you quote a single number.
- More than one IRR. Damodaran’s course slides show a project with two IRRs when its flows change sign twice. Wikipedia adds that the number of IRRs can never exceed the number of sign changes, which is Descartes’ rule of signs. We found no second source for that bound. Wikipedia’s example has two, at 0% and 10%. Ours (-1,000, +2,300, -1,320) has 10% and 20%, and NPV is positive between them. A late outflow such as decommissioning or a repower can cause this. Our example’s replacement does not, because year-13 flow stays positive. A replacement larger than that year’s net flow would add a sign change.
- The reinvestment assumption. Damodaran’s slides state that IRR assumes interim cash is reinvested at the IRR itself. Wikipedia says this is disputed in the literature. Modified IRR (MIRR) makes the rates explicit. On our project flows, a 0%, 4% and 8% reinvestment rate give MIRR of 4.38%, 6.42% and 8.73%. The finance rate does not matter here because only year 0 is negative.
- Timing. Year-end flows give 9.96%. Receipts at mid-year give 10.59%. Capex paid six months before year 0, with flows unchanged, gives 9.42%. State which you used.
- Scale and ranking. Option A is our 1 MWdc project. Option B is 2 MWdc at a poorer site (1,400 kWh per kWdc, same unit costs). A has the higher IRR, 9.96% against 8.57%. At a 6% rate B has the higher NPV, 603,095 against 477,892 USD. At 8% A wins, 202,706 against 114,662 USD. The two swap at 7.10%, which is the IRR of the extra cash flows B adds over A.
- Debt. Debt lifts equity IRR only while the project earns more than the debt costs. At 0.050 USD per kWh our project IRR is 4.05% and equity IRR 2.58%, with debt service uncovered (cover 0.21).
For a P90 or P99 view of the energy input, see P50, P90 and P99. IRR is not LCOE or payback: those answer other questions, set out on the LCOE and payback period pages.
How solar software handles IRR
Of the six tools checked in October 2026, five report IRR in their help pages. Only SAM and Solargis Prospect say much about whether it is project or equity.
| Software | Reports IRR? | Basis stated | Source |
|---|---|---|---|
| Aurora Solar | Yes | Annualised rate at which NPV of all cash flows is zero. Not meaningful for zero-down loans. Project or equity, and tax basis: Not stated | Aurora help, updated 15 May 2026 |
| HelioScope | Yes | Lists IRR as a metric and defines it as the rate that sets NPV to zero. Project or equity, and tax: Not stated | HelioScope financial glossary, updated 4 August 2026 |
| SAM | Yes, for PPA models | After-tax cash flow, nominal rate, owner’s view. Per partner in two-partner models. Returns a not-a-number result if no IRR is found or year-0 cost is zero | SAM help, Internal Rate of Return page |
| PVsyst | Yes | Rate that makes NPV of all cash flows zero. Equity: Not stated | PVsyst help, financial results |
| Solargis Prospect | Yes | Separate project IRR and equity IRR. Tax inputs exist (taxes on profit, linear tax depreciation). The page does not say how IRR uses them | Solargis knowledge base, updated 24 September 2026 |
| RatedPower | Partly | Not stated. A company blog (25 March 2025) lists IRR among its financial KPIs | RatedPower blog |
Not stated: the company page we cite does not say. Partly: a company blog lists IRR but no documentation states the basis.
PVsyst’s economic evaluation overview, read separately, lists ROI, payback and NPV but not IRR. The financial results page does name IRR. For the full comparison, read the best solar financial modeling software list. For large ground-mount projects, see the best utility-scale solar design software.
Common mistakes with IRR
FAQs
What is a good IRR for a solar project?
A good IRR is one that beats the owner’s hurdle rate for the risk taken. Compare it with the rate the owner could earn elsewhere, and check NPV at that rate. The tax position also matters. No dated authoritative benchmark is cited here, so none is given.
What is the difference between IRR and NPV?
NPV is a sum of money at a chosen discount rate. IRR is the rate at which that sum is zero. For NPV figures, see the NPV page.
Can a project have more than one IRR?
Yes, when the cash flows change sign more than once. Flows of -1,000, +2,300 and -1,320 have IRRs of 10% and 20%. Our solar example has one sign change and one IRR.
Why does my IRR differ between two tools?
Usually the cash flows differ. One tool may include tax, debt or incentives, and another may not. Timing also matters: year-end and mid-year receipts gave 9.96% and 10.59% on our flows.
Why does the calculator say there is no IRR?
No IRR exists when the flows never change sign, for example all inflows. SAM returns a not-a-number result for the same cases, and when year-0 cost is zero, as with 100% debt. Excel returns #NUM! when it finds no result in its tries.
Related terms
- NPV: discounted sums at a chosen rate.
- Payback period: time to recover the cost.
- LCOE: cost per kWh.
- Debt sizing and DSCR: how much debt a project cash flow can repay.
- Return on investment: net gain divided by cost.
Next step: run your own project and equity cash flows through the best solar financial modeling software, or see the best utility-scale solar design software.
Sources
- Aurora help: Financial analysis overview, updated 15 May 2026 (checked October 2026).
- HelioScope: Financial Modeling Glossary, updated 4 August 2026 (checked October 2026).
- SAM help: Internal Rate of Return, undated (checked October 2026).
- PVsyst help: financial results and economic evaluation overview (checked October 2026).
- Solargis knowledge base: Financial analysis, updated 24 September 2026 (checked October 2026).
- RatedPower blog: financial KPIs, updated 25 March 2025 (checked October 2026).
- Microsoft: IRR function and XIRR function (checked October 2026).
- Wikipedia: Internal rate of return, for the sign-change bound, the reinvestment dispute and MIRR (checked 30 October 2026).
- Damodaran (NYU Stern): Measuring Investment Returns slides, for multiple IRRs and the reinvestment assumption (checked 30 October 2026).
- Renewables Valuation Institute: levered vs unlevered return (checked October 2026).
Last updated 30 October 2026. Next scheduled review: 30 January 2027.