Key takeaways
- FERC staff define DR as "changes in electric usage by demand-side resources from their normal consumption patterns". It is about load, not generation.
- There are two families. Event-based schemes pay for kW cut when called. Price-based schemes use time-based rates.
- Payment rests on a baseline, an estimate of load without the event.
- In our invented example, 130 kW of real action reads as 94.5 kW on a hot day and 160.8 kW on a cool day.
- Each scheme treats batteries and solar differently, so read its own document.
To model a battery for event dispatch, see the best battery energy storage software.
Demand response at a glance: why it matters for installers
DR pays a site to use less grid power. The site cuts when asked, or when prices are high. A battery or flexible load becomes a kW figure that someone else measures.
This matters to installers because a battery or flexible load can earn a payment, but only for the kW the scheme measures. Quotes must match that measure, not the nameplate.
| Item | Detail |
|---|---|
| Unit of value | kW reduced against a baseline, averaged over the event hours. Energy (kWh) decides if the site can hold the kW for the whole event. |
| Two families | Event-based, called by a utility or market operator. Price-based, where a time-based rate changes the price by hour. |
| Rule | No single rule. Each scheme or market sets its baseline, metering and eligibility. This page covers US schemes only. California’s ELRP and DSGS also exist. |
| In software | Design tools model events. Device apps enrol sites. See the software table. |
A quote can promise only what the scheme measures. Rules on solar, grid charging and metering differ. Read the scheme’s own document. For the bill side, see peak shaving and demand charge management.
What is the difference between event-based and price-based demand response?
An operator calls event-based DR and pays against a baseline. Price-based DR is a rate that changes by time, and the customer saves on the bill. FERC counts 10,567,254 retail customers in incentive-based schemes and 18,240,088 in dynamic pricing (EIA 2023 data).
| Family | What triggers it | FERC’s list of programme types |
|---|---|---|
| Event-based (FERC’s "incentive-based") | A call or alert from the operator. | Direct load control, interruptible, demand bidding or buyback, emergency DR, capacity market and ancillary service schemes. |
| Price-based (dynamic pricing, or time-based rates) | A rate schedule. | Time-of-use, real-time, variable peak, critical peak pricing and critical peak rebate. |
The line is blurry. FERC lists critical peak pricing and critical peak rebate as dynamic pricing, yet both act on event days. It cites a working paper (13 March 2025). It says event-based rates "lead to greater peak demand reductions" than time-of-use. For rate-driven battery use, see time-of-use optimisation and energy arbitrage.
How do solar, batteries and C&I sites take part?
A site takes part by cutting what the utility meter sees during an event. A battery discharges. A flexible load sheds. Scheme rules decide what counts.
| Scheme, market and date | What the page says |
|---|---|
| ConnectedSolutions C&I, Massachusetts, offering materials 14 April 2025 | Batteries must be behind the meter (details below the table). |
| CAISO DR FAQ, last updated 23 February 2016 | A meter with storage behind it can take part. The FAQ says "PDR and RDRR only allow for load curtailment, not load consumption or the export of energy to the grid". PDR is a proxy demand resource. |
The offering materials add three points.
- Eligibility: "Front-of-the-meter assets such as power plants or solar-plus-storage farms are not eligible."
- Fossil fuel generation: it cannot contribute to performance.
- Curtailing solar or combined heat and power: this may not raise event performance.
CAISO’s 2026 Demand and Distributed Energy Market Integration proposal would let an aggregation export within its own load zone, short of full net export. The ISO had not adopted the change by November 2026. Check the current CAISO tariff before relying on the no-export rule above.
A 3-hour event needs kWh as well as kW. See battery storage design, solar plus storage and behind-the-meter systems.
How is the load reduction measured against a baseline?
Reduction is the baseline minus the load metered during the event. The baseline is a guess at what the site would have used without the event. Nobody can meter it.
- CAISO FAQ, 23 February 2016: Default: "using the last 10 nonevent days with a look back window of 45 days". Alternatives need ISO approval.
- ConnectedSolutions C&I, Massachusetts, 14 April 2025: A "last 10-of-10 baseline method" over similar days. Days must be the same day type, not a holiday, with no other event called. Targeted Dispatch adds a same-day adjustment for non-battery resources. It starts from the hour 2 hours before the event and "can only be positive". Daily Dispatch has none. Batteries in Daily Dispatch get "without either a baseline or a same-day adjustment". The document states no battery rule for Targeted Dispatch beyond "no baseline adjustment for batteries".
- MISO, in the FERC report, December 2025: A change accepted 18 July 2025 applies to resources with too few non-event days. It uses "the five lowest average load days over the prior 45-day period". Its stated aim was to reduce "inaccurate or inflated baselines".
- PG&E pilots 2018 to 2020, ACEEE 2022 paper: Adjusted 10-in-10 baselines had NMAE of 0.0322 to 0.0514 in one pilot (SSP II). Another pilot (XSP) had 0.2586 to 0.4842. For SSP II the authors found "no compelling evidence" the baseline is inadequate.
NMAE is a normalised absolute error. The gap shows that baseline error depends on the load. The paper adds that sites with on-site generation can export net power. If that gives a negative adjustment ratio, the scheme applies none.
In the Massachusetts document, a negative event result lowers the season’s average. Pay is the rate times that average.
Worked example: the same 130 kW read three ways
All numbers are example. A C&I site has a 3-hour event, 16:00 to 19:00. It cuts 130 kW each event hour. That is 100 kW of battery discharge and 30 kW of load shed. The method is generic, not the Massachusetts rule for batteries. A hot or cool day scales the site’s load by a factor.
The baseline is the mean of 10 similar non-event days. It is 475.7 kW over the event window and 462.3 kW in the 14:00 hour. The adjustment is event-day 14:00 load minus 462.3, never below 0. Performance is baseline plus adjustment minus event load.
| Item (example) | Hot day, factor 1.08 | Cool day, factor 0.94 |
|---|---|---|
| Load in the 14:00 hour (kW) | 496.8 | 432.4 |
| Event-window load with no action, unmeterable (kW) | 511.2 | 444.9 |
| Metered event-window load (kW) | 381.2 | 314.9 |
| Baseline (kW) | 475.7 | 475.7 |
| Same-day adjustment (kW) | 34.5 | 0.0 |
| Reduction, baseline only (kW) | 94.5 | 160.8 |
| Reduction, with adjustment (kW) | 129.0 | 160.8 |
| Real action (kW) | 130.0 | 130.0 |
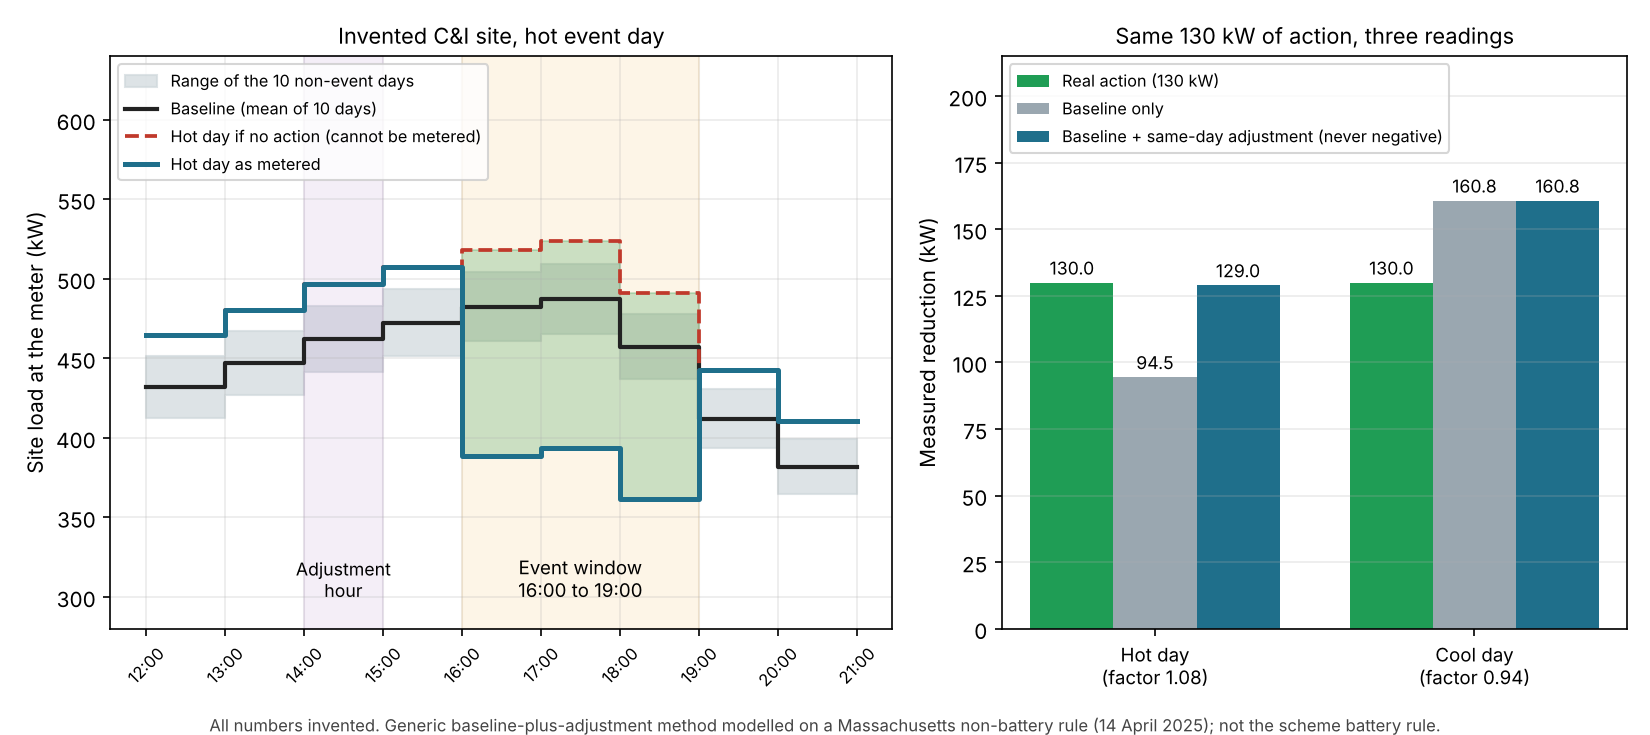
Figure 1. On example numbers, a baseline alone reads 130 kW of action as 94.5 kW on a hot day and 160.8 kW on a cool day, and a never-negative adjustment fixes only the hot day.
On the hot day the baseline-only reading is 35.5 kW short. The adjustment recovers all but 1.0 kW of it. On the cool day the adjustment is zero, so the reading stays 30.8 kW high. The example skips the Massachusetts cap. That cap keeps performance below the maximum load of the last 10 similar days.
Next, one season of 8 example events. Their weather factors are 1.08, 1.00, 0.94, 1.04, 1.00, 1.10, 0.92 and 1.02. Action is 130 kW except event 4, when the battery is offline. The 40 USD per kW-season rate is example. It is not a scheme rate.
The table gives season averages over the 8 events, paid at 40 USD per kW.
| Reading (example) | Season average (kW) | Pay (USD) |
|---|---|---|
| Real action | 113.75 | 4,550 |
| Baseline only | 110.20 | 4,408 |
| With adjustment | 122.85 | 4,914 |
Event 4 reads -0.5 kW with adjustment. That drags the average down. The adjusted average is still 8.0% above the real average. Cool days over-read, and the method corrects only hot days. That gap comes from this example’s factors, and real error needs real meter data.
Check an event against your own baseline
Enter 3 to 10 similar non-event days, then the event-day loads. The calculator opens with the hot day above. Rates are example.
If the calculator will not load, open the demand response baseline calculator on its own page.
What does a demand response aggregator do?
An aggregator enrols sites in a scheme and passes on the payment. Each market names the role differently.
| Market or scheme | Name and role as printed |
|---|---|
| PJM, Demand Response page (no publication date, items on the page run to 16 October 2026) | "These customers receive payments from PJM members called Curtailment Service Providers." |
| CAISO FAQ, 23 February 2016 | "The CAISO prefers and uses the term Demand Response Provider (DRP)." The DRP executes the Proxy Demand Resource Agreement. |
| ConnectedSolutions C&I, 14 April 2025 | "Most customers enroll" through an approved Curtailment Service Provider, which "typically operate through a revenue-sharing model". Customers are not required to use one and may enrol as a Direct Participant. |
In DR, "curtailment" means a load cut. Cutting generation is a separate idea. See the curtailment page.
How is demand response different from a VPP, a DER and curtailment?
DR is a service: cutting load on request. A VPP, a DER and curtailment are different things.
| Term | What it is | Detail page |
|---|---|---|
| Demand response | Load cut on request, paid against a baseline or saved through a rate. | This page |
| Virtual power plant | Software that groups devices and can offer DR among other services. | Virtual power plant |
| Distributed energy resource | A device class. Definitions differ by source. | DER |
| Generation curtailment | Output cut below what a plant could produce. | Curtailment |
| Peak shaving | A site cutting its own highest kW to cut a demand charge. No event. | Peak shaving |
How solar software handles demand response
Two of four company pages read in October 2026 say the tool models or dispatches demand response. "Yes" means the page says so.
| Software | Handles demand response? | Page read |
|---|---|---|
| Energy Toolbase | Yes | Energy Toolbase DR page, no date. DSGS page, modified 10 June 2026 in page metadata. |
| HOMER Grid | Yes (modelling) | HOMER Grid 1.10 manual, UL copyright 2022. |
| FranklinWH | Not stated | SmartHome Battery Program guidance, 30 April 2026. |
| Enphase | Partly | Enphase press release, 6 February 2025. |
Not stated: the company page we cite does not use the words "demand response". Partly: the page names it for some programmes only.
What each company page says:
- Energy Toolbase: Lets users "model energy storage performance, simulate participation in multiple programs, and estimate potential revenue". The DSGS page says ETB Controller "can receive day-ahead notifications, optimize and dispatch energy storage assets".
- HOMER Grid: "HOMER Grid allows you to model demand response events." Inputs include an incentive per kW and event days. Grid purchases during the event are subtracted from the baseline. The page does not describe penalty modelling.
- FranklinWH: The guidance does not use the words "demand response". It describes a "VPP event", a notice about 24 hours ahead and a 20% state of charge default. "By default, participation for each VPP event is opt-in."
- Enphase: A press release, not documentation, says IQ Battery 5P batteries support three programmes. It uses "demand response event" for Puerto Rico and Nova Scotia only. We cite no help page.
The virtual power plant page rates the same documents for VPP enrolment. Our ranking of the best battery energy storage software covers storage control. The best VPP software for solar installers list covers VPP tools.
Common mistakes with demand response
FAQs
Is demand response the same as a virtual power plant?
No. DR is a service that cuts load on request. A VPP is software that groups devices. It may offer DR and other services.
Can a battery export during a demand response event?
Only where the scheme allows it. For PDR, the CAISO FAQ (23 February 2016) allows load curtailment only, with no export. CAISO’s 2026 draft final proposal would allow some aggregation export, but it was not yet adopted as of November 2026. Check CAISO’s current tariff before relying on either rule. The Massachusetts C&I document (14 April 2025) allows export. Exporting sites have their incentive "capped at 150%" of the site’s annual peak load, which is the document’s basis for the cap. They are exempt from the maximum-load limit.
Do I need an aggregator?
Not always. The Massachusetts C&I document says most customers enrol through a Curtailment Service Provider. Customers may enrol as a Direct Participant. PJM’s page says CSPs pass payments to customers.
What is a demand response baseline?
A baseline estimates the site’s load without the event, using similar non-event days. Reduction is the baseline minus the metered event load. Its method changes what a site is paid.
Related terms
- Virtual power plant: groups of devices dispatched as one resource.
- Distributed energy resource: the device class that includes batteries and controllable loads.
- Curtailment: output cut below what a plant could produce.
Next step: once a site has a scheme, shortlist dispatch tools in the best battery energy storage software. For enrolment, see the best VPP software for solar installers.
Sources
- FERC staff, 2025 Assessment of Demand Response and Advanced Metering. December 2025. Not the Commission’s view.
- CAISO, Demand Response and Proxy Demand Resources FAQ. Last updated 23 February 2016 (checked November 2026, still the current public FAQ).
- CAISO, Demand and Distributed Energy Market Integration, Track 1 draft final proposal. Posted 8 July 2026. Not yet adopted (checked November 2026).
- PJM, Demand Response. No publication date. Items on the page run to 16 October 2026.
- Massachusetts ConnectedSolutions C&I offering materials. Dated 14 April 2025.
- ACEEE 2022 Summer Study paper on DR baselines (Barquest and others).
- Energy Toolbase, Demand Response (no date) and DSGS page (modified 10 June 2026).
- HOMER Grid manual, Demand Response. Version 1.10. UL copyright 2022.
- FranklinWH SmartHome Battery enrolment guidance. 30 April 2026.
- Enphase Energy, grid services programmes press release. 6 February 2025.
Last updated 3 November 2026. Next scheduled review: 3 February 2027.