Key takeaways
- Rain cleans only above a threshold. pvlib’s Kimber model defaults to 6 mm in a day, plus a 14-day damp-ground grace period.
- pvlib tabulates Kimber’s measured rates. They run from 0 to 0.30% of energy per day across California and desert sites.
- Models disagree on the same simulated rain: HSU read 8.8% on day 159, Kimber at 0.15% per day 21.3%. Treat both as placeholders until you have site data.
- On placeholder costs, one wash on day 75 lost 560 USD at 0.15% per day and gained 987 USD at 0.30%. The wash first paid at 0.184% per day.
- PVsyst, SAM and Aurora take monthly or annual soiling inputs. pvlib adds time-series models that use rainfall. HSU also uses particulate data.
To compare simulation tools that take monthly soiling inputs, such as PVsyst, SAM and Aurora, see the best solar simulation software.
Soiling at a glance
Soiling is a loss line in a yield model and a cleaning choice in operations. You enter it as a percentage, or model it from rain and dust data.
| Item | Detail |
|---|---|
| Formula | Soiling loss = 1 minus soiling ratio. IEA PVPS Task 13 quotes the IEC 61724 definition of the ratio: soiled array power over clean array power. |
| Unit and range | Percent of energy (or irradiance), or a rate in % per day or % per month. See the sourced rates below. The range between sites is wide. |
| Where it matters | Yield estimates, cleaning schedules, performance ratio and fault-finding. |
| In software | A monthly or annual input in design tools. Time-series models in pvlib. |
Why soiling matters for installers
Soiling is one of the few losses you can act on after commissioning. A wash costs money. The question is whether the energy you win back is worth more.
A flat annual figure can hide a dry season with a much larger loss. That shifts the energy yield simulation result. The full stack is on the system losses page. Soiling also lowers performance ratio.
In operations it is a slow loss. Our alerts and alarms page tests one simulated case. O&M covers washing contracts.
What drives soiling loss?
Dust supply, rain, humidity, tilt and the type of deposit decide how fast loss builds. Rain removes some deposits but not all.
- Dust: IEA PVPS Task 13 names silt-sized particles (about 2 to 63 microns) as the main contributors in arid and semi-arid areas. It also lists humidity, dew, wind, soil type and farming as factors.
- Pollen: the same report lists it among natural sources of contaminants. It gives no rate for it in the report text.
- Bird droppings: PVsyst’s help says rain does not usually remove them. It says their impact is reported as relatively small, under 2%. No second source is cited for that figure.
- Snow: IEA PVPS Task 13 treats snow as a separate shading issue. PVsyst lets you apply partial or complete attenuation in chosen months. pvlib has a separate snow-coverage model.
- Rain: it washes off soiling, but rain is scarce in arid regions. PVsyst says rain does not remove moss and lichen along frames.
- Tilt: IEA PVPS Task 13 says losses typically fall as tilt rises, at least where wind does not remove dust. See tilt angle. HSU scales deposited mass by the cosine of tilt. In the example run the day-159 loss fell from 9.2% at 0 degrees to 5.2% at 60 degrees.
What soiling rates have been published?
Published figures range from under 1% a year in wet residential areas to more than 20% in long dry spells. They use different units, sites and methods. Do not mix them.
| Source and date | What it reports | Limits |
|---|---|---|
| Kimber et al., 2006, as tabulated in pvlib docs | Daily loss rates of 0 to 0.30% per day. Desert: 0.30% in rural, suburban and urban settings. Central Valley: 0.11% to 0.20%. Northern California: 0.10% to 0.16%. Southern California: 0% to 0.19%. | Measured by Kimber et al.. The figures come from the pvlib table, not the paper. |
| IEA PVPS Task 13, December 2022, Table 1 | Monthly rates up to 2.0% per month for natural desert and up to 11.5% for dry agricultural areas. The table cites two US locations. | The report text shows no site names or years for the table. |
| IEA PVPS Task 13, December 2022 | Malaga, Spain: mean daily production loss about 4.4%, above 20% in long dry periods of dust build-up. | One site. The report text does not give the year here. |
| Ilse et al., Joule, 2019 | At least 3-4% of solar production lost even with optimised cleaning. IEA gives the same 3-4% for 2018, so count it once. | Worldwide estimate, not a site rate. Its scope (utility-scale or all) is not stated in the abstract. |
| PVsyst help (undated, checked October 2026) | Under 1% in moderately rainy residential areas. Several percent in industrial zones. | Guidance, not a dataset. |
| Clean Power Research, 2024 | Harad, Saudi Arabia: HSU 31.0% annual energy loss against Kimber 21.6%. | A modelled comparison on SolarAnywhere data, not a measured loss. The page does not give the Kimber rate or the dust and rain inputs. |
Kimber’s desert rate of 0.30% per day would be about 9% in a dry 30-day month. That is far above IEA’s natural-desert range (up to 2.0% a month). It is inside its dry-agricultural range (up to 11.5%). The sources cover different sites, years and methods. Treat both as site-specific.
How do software tools model soiling?
Most design tools take a monthly or annual percentage. Time-series models turn rainfall into an hourly or daily loss. HSU also uses dust data.
The Kimber model in pvlib adds loss at a fixed daily rate. Rain above a threshold cleans the array. The model has a grace period after rain, a cap, and manual wash dates. Defaults are a 0.15% daily rate, a 6 mm threshold, a 14-day grace period and a 30% cap.
The HSU model (Humboldt State University fixed-velocity model) takes rainfall, a cleaning threshold, tilt, PM2.5 and PM10. Its loss follows 1 minus 0.3437 times erf(0.17 times ω to the power 0.8473), where ω is the accumulated mass. pvlib says the loss cannot exceed about 34.37%. It says the model was validated to 10 g/m2.
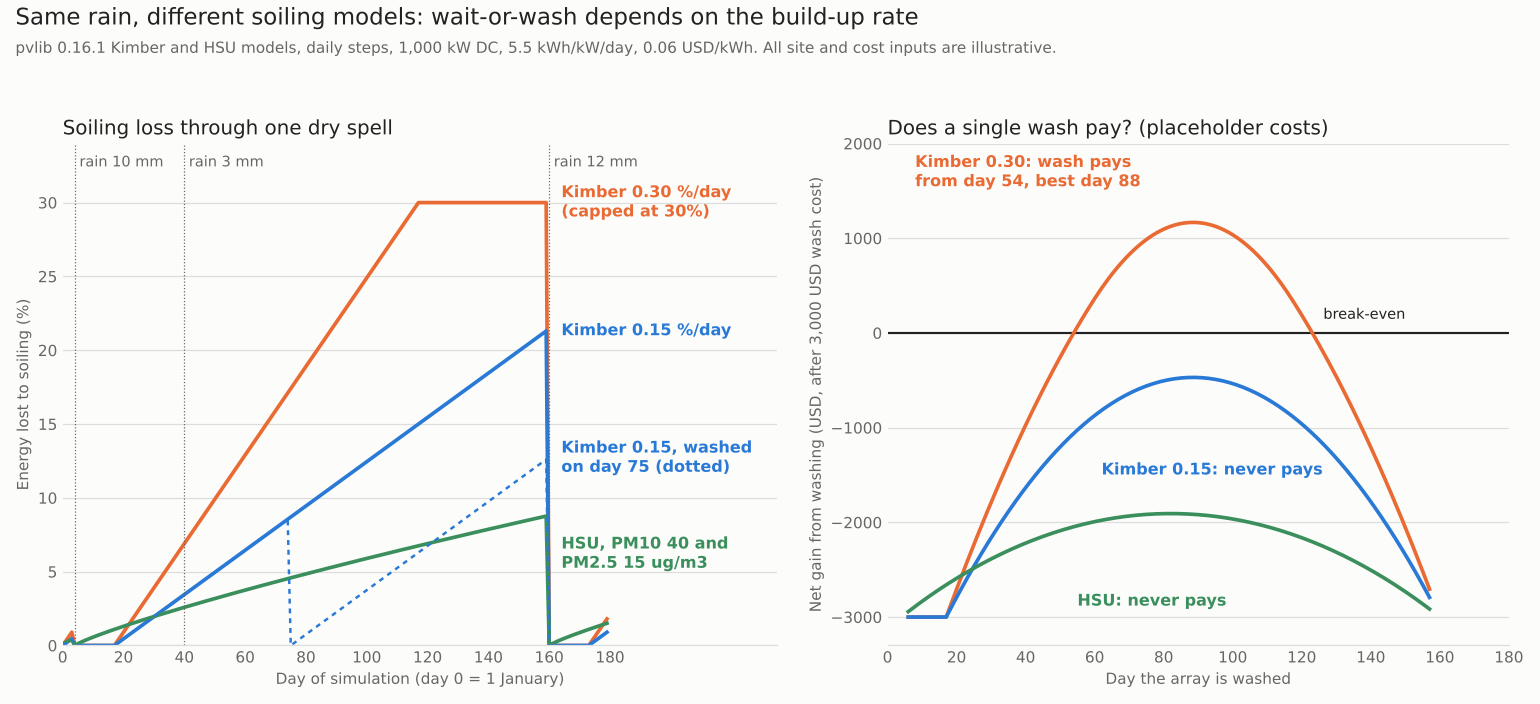
Figure 1. On identical simulated rain, HSU and Kimber build loss at different speeds. One wash paid only at the 0.30% rate (placeholder costs).
Worked example: wait or wash through a dry spell
The example runs pvlib 0.16.1 over 180 daily steps with invented rain. It fell as 10 mm on day 4, 3 mm on day 40 and 12 mm on day 160. Inputs below are illustrative, not site data or quotes.
| Input | Value |
|---|---|
| Array and output | 1,000 kW DC. 5.5 kWh per kW per day clean, so 5,500 kWh a day |
| Energy value (placeholder) | 0.06 USD per kWh, so 330 USD for one clean day |
| Cost of one wash (placeholder) | 3,000 USD |
| Kimber | Rates 0.15 and 0.30% per day. 6 mm threshold, 14-day grace, 30% cap (pvlib defaults except the rate) |
| HSU (placeholder dust) | PM10 40 and PM2.5 15 micrograms per m3. 20 degree tilt. 6 mm threshold to match Kimber |
| Result (days 0 to 179) | Kimber 0.15 | Kimber 0.30 | HSU |
|---|---|---|---|
| Loss on day 159, no wash | 21.3% | 30.0% (cap) | 8.8% |
| Mean loss over 180 days | 8.5% | 15.5% | 4.2% |
| Energy value lost, no wash | 5,039 USD | 9,184 USD | 2,518 USD |
| Value recovered by washing on day 75 | 2,440 USD | 3,987 USD | 1,084 USD |
| Net after the 3,000 USD wash | -560 USD | 987 USD | -1,916 USD |
Rain threshold. The 3 mm shower stayed below the 6 mm threshold, so it cleaned nothing. With HSU set to 1 mm it cleaned the array. Loss on day 41 was 0.12% against 2.65%. The threshold can change the result.
Timing. In Kimber the gain from a wash is the loss you avoid on every remaining dry day. With rain due on day 160, the gain peaks on day 88. That is about midway between the end of the grace period and the rain. For the 0.30% rate it pays from day 54 to day 123.
Inputs. The models were not tuned to one site. The 0.15% rate and the dust inputs are placeholders. The gap between rows shows the inputs, not which model is right.
To plan washes across many sites, see the best solar asset management software.
Wait-or-wash calculator
The calculator uses Kimber’s straight-line build-up with a cap. Its defaults repeat the two Kimber columns above. It also solves for the lowest rate at which the wash pays.
If the calculator does not load, open the wait-or-wash calculator on its own page.
How solar software handles soiling
All five tools below handle soiling loss, from monthly percentages to time-series models built on rainfall. Ratings come from company pages read in October 2026.
| Software | Does it handle soiling loss? | Method |
|---|---|---|
| PVsyst | Yes | Monthly factors, modelled as an irradiance loss |
| SAM | Yes | Monthly percentages |
| Aurora Solar | Yes | Annual or monthly input |
| HelioScope | Yes | Single loss factor |
| pvlib python | Yes | Time-series models |
- PVsyst: Soiling loss page lets you set values per month and a partial snow attenuation in chosen months. The page describes no rain or dust model. PVsyst help, October 2026.
- SAM: Losses page: a monthly loss reduces plane-of-array irradiance at every time step in that month. The page gives no default. Shown through its samrepo.nlr.gov mirror, October 2026.
- Aurora Solar: System losses article: soiling is set in performance simulation settings and applied to each module’s incident irradiance. Article marked updated 29 June 2026. Defaults are on the energy yield simulation page.
- HelioScope: Loss factor defined in the Condition Set. The page says it is also used for snow. The page does not say whether monthly values are possible. Help centre, October 2026.
- pvlib python: pvlib.soiling has kimber and hsu. Pvlib.snow has a snow-coverage model. Open-source library. You write the code. pvlib docs, October 2026.
To pick a design tool that handles soiling, see the best solar simulation software.
Common mistakes with soiling
FAQs
What is the soiling ratio?
It is soiled array power divided by clean array power. IEA PVPS Task 13 quotes the IEC 61724 definition. Soiling loss is one minus that ratio. A ratio of 0.95 means a 5% loss.
Does rain clean solar panels?
Often, but not always. pvlib’s Kimber model needs 6 mm in a day by default to reset the array. PVsyst says rain does not usually remove moss, lichen and bird droppings.
Are bird droppings a big loss?
Usually not. PVsyst’s help calls their impact relatively small, under 2%. It says rain usually does not remove them. No second source is cited, so treat the figure as a guide.
How much energy do dirty solar panels lose?
IEA PVPS Task 13 puts worldwide soiling loss at least 3-4% of PV energy in 2018. Site rates vary a lot. Kimber’s tabulated rates run from 0 to 0.30% of energy per day (California and desert sites, via pvlib). Long dry spells can push local loss far higher.
Which model should I use, Kimber or HSU?
Use the one whose inputs you can supply. Kimber needs rainfall and a rate you must supply. HSU needs rainfall, tilt and particulate data. A 2024 Clean Power Research comparison at Harad, Saudi Arabia, gave HSU 31.0% and Kimber 21.6% annual energy loss. Our example has HSU lower. Inputs differ in each case, so neither result ranks the models.
Related terms
- Weather and solar resource data: the sunlight and rainfall inputs a soiling model needs.
- System losses (loss diagram): where soiling sits among the other losses.
- Tilt angle: the module slope that changes how dust settles and sheds.
Next step: price your own wash in the calculator, then compare the best solar simulation software or the best solar asset management software.
Sources
- pvlib.soiling.kimber and pvlib.soiling.hsu documentation, version 0.16.1 (checked October 2026).
- IEA PVPS Task 13, Soiling Losses: Impact on the Performance of Photovoltaic Power Plants, T13-21:2022 (December 2022, checked October 2026).
- Ilse et al., Techno-Economic Assessment of Soiling Losses and Mitigation Strategies for Solar Power Generation, Joule 3(10), 2019 (abstract, checked October 2026).
- PVsyst help: soiling loss (checked October 2026).
- SAM help: PV losses (checked October 2026).
- Aurora help: System Losses and HelioScope help: loss factors (checked October 2026).
- Clean Power Research: soiling and snow loss models using SolarAnywhere data (2024, no named authors, checked October 2026, Harad figures re-read 30 October 2026).
Last updated 30 October 2026. Next scheduled review: 30 January 2027.