Key takeaways
- A GIS holds vector layers (points, lines, polygons) and raster layers (grids). Solar siting stacks parcels, zoning, land cover, slope, flood, protected areas, grid and irradiance.
- On our synthetic 76.31 ha site at 33°N, square degrees times 111,320 squared overstated the area by 19.6%. Web Mercator overstated it by 42.6%. UTM zone 14N was 0.06% low.
- A 15 m setback turned into degrees with one factor reached 12.6 m east-west and 14.9 m north-south (synthetic site, placeholder setback).
- The synthetic constraint polygon overlapped 14.55 ha (19.1% of the site). Buildable area after the placeholder 15 m setback was 57.07 ha.
- The degree buffer alone gave 57.39 ha (+0.56%). Adding degree-based area gave 68.62 ha (+20.24%), so the area unit, not the buffer, caused almost all of the error.
To screen sites on prebuilt GIS layers in software, see the best solar site selection software.
GIS at a glance
A GIS stores places as layers and lets you measure, overlay and map them. For solar it answers where you can build and how much land you have.
| Item | Detail |
|---|---|
| Data types | Vector (points, lines, polygons with attributes) and raster (grids of cells) |
| The setting that breaks results | Coordinate reference system (CRS): degrees or metres, and which datum |
| Common formats | Shapefile, GeoJSON, KML and KMZ, GeoTIFF |
| Standard or rule | No single standard. RFC 7946 defines GeoJSON. See the formats table |
| In software | Desktop GIS (QGIS, ArcGIS) and siting platforms built on GIS layers |
Why GIS matters for installers and developers
GIS decides which land you can use before anyone visits it. A site that fails on flood, protected status or grid distance is dropped early. That saves survey cost.
Errors also travel. Area sets megawatts per hectare, earthworks cost and permit forms. A wrong unit changes all three. Setbacks are a distance rule, so they need metres: see setbacks and fire setbacks. For ownership data see land parcel data.
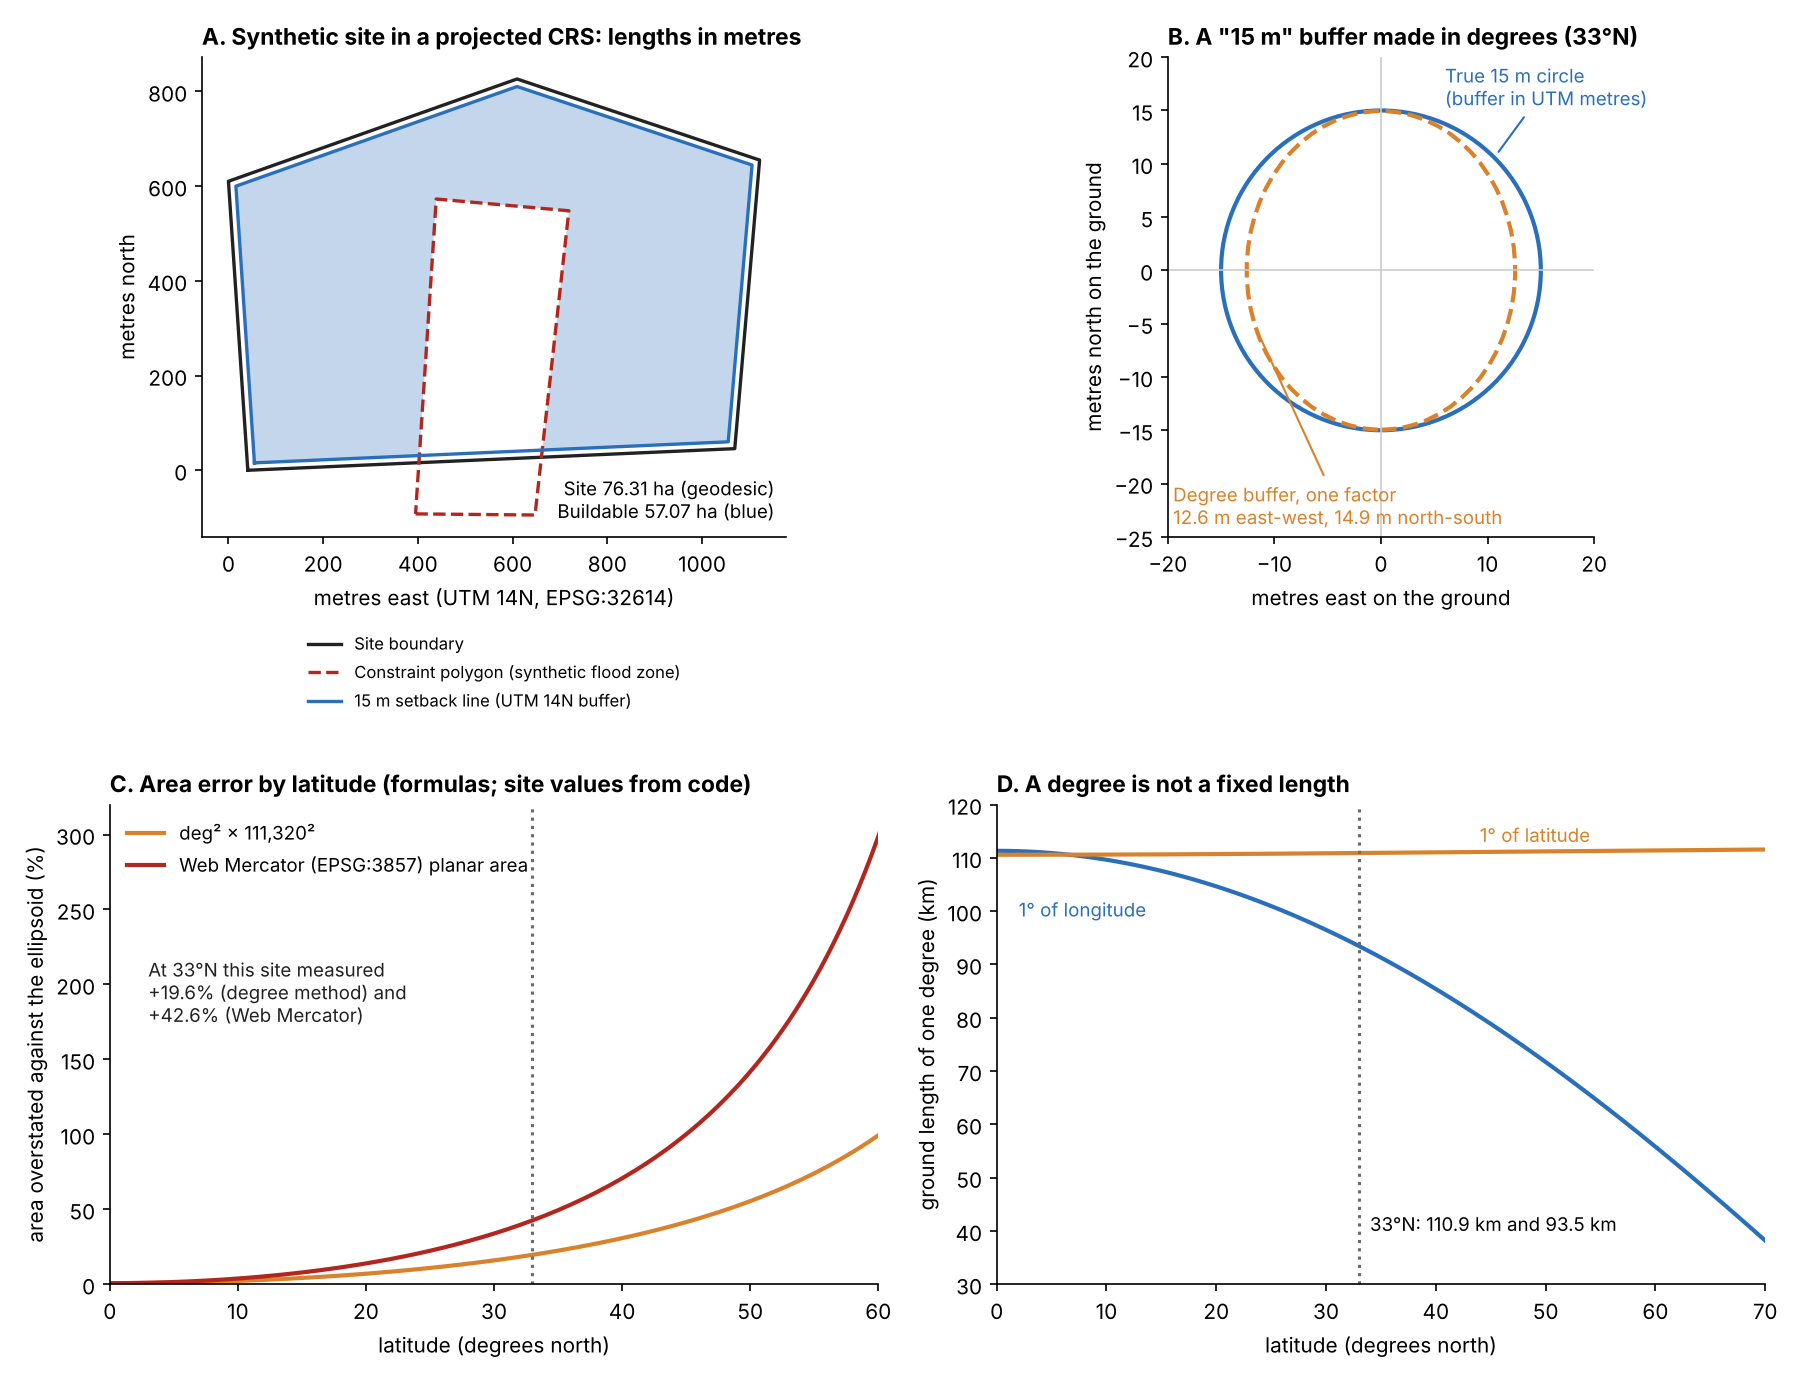
Figure 1. On our synthetic 33°N site (placeholder 15 m setback), degree-based buffers and areas are wrong. The error grows with latitude. A local projected CRS in metres kept the area error under 0.1% here.
Which GIS layers do solar teams use?
Teams use eight layers: parcels, zoning, land cover, slope and aspect, flood, protected areas, grid and irradiance. The company and agency pages cited name most of them. The table pairs each layer with its usual form and what a source says.
| Layer | Usual form | What the source says |
|---|---|---|
| Parcels | Vector polygons | PVcase (post of 9 December 2024) lists "property boundaries, addresses, land ownership and contact information, land use classifications, and zoning restrictions". |
| Zoning | Vector polygons | The same PVcase post groups zoning restrictions under parcel data. Rules differ by place, so confirm with the AHJ. |
| Land cover | Raster | Pivvot’s post (undated) names a USDA crop classification layer used to calculate usable acreage. |
| Slope and aspect | Raster, from a DEM | Solargis (updated 25 September 2026) calculates slope and azimuth from elevation, using a 3 arc-second (nominally 90 m) DEM. See terrain modelling. |
| Flood | Vector polygons | FEMA calls the NFHL a "geospatial database that contains current effective flood hazard data" and notes areas not covered by it. PVcase calls FEMA maps outdated. That is its view. |
| Protected areas | Vector polygons | USGS PAD-US 4 was released on 24 April 2024 as a geodatabase. USGS does not recommend comparing trends between versions without consulting it. |
| Grid lines and substations | Vector lines and points | Pivvot names "Transmission Lines & Substations". PVcase says capacity data shows if substations can absorb new output. See interconnection queue. |
| Irradiance | Raster | Not sourced here. See weather and solar resource data and solar irradiance. |
"Usual form" is common GIS practice, not a claim by each source. Treat every layer as dated. Check its vintage and coverage before you rely on it. If you want layers prebuilt, PVcase Prospect, Pivvot and Solargis Prospect bundle them. QGIS and ArcGIS are general GIS tools, not siting platforms.
In use, GIS feeds siting, layout and permitting. A mistake in the first CRS reaches the permit drawing.
- Siting: parcels, flood, protected areas and grid distance shortlist land. See site selection software and the interconnection queue.
- Survey: lidar, an orthomosaic and terrain models replace coarse open data. See site survey.
- Layout: keep-out zones are polygons, and layout optimisation fills what remains.
- Permitting: the site plan shows boundaries and setbacks, drawn from the same layers.
Vector or raster, and which file format?
Vector stores shapes with attributes. Raster stores a grid with one value per cell. Parcels and flood zones are vector. Terrain and imagery are raster.
| Format | Type | What the source says, and our test |
|---|---|---|
| Shapefile | Vector | Library of Congress (description updated 29 May 2020): .shp, .shx and .dbf are required. .prj holds the CRS and is optional. Any component is limited to 2 GB and field names to 10 characters. Our test cut parcel_owner_name to parcel_own. |
| GeoJSON | Vector | RFC 7946 (August 2016): coordinates are WGS 84 in decimal degrees, longitude first. Other CRSs only by prior arrangement. In our GDAL 3.12.4 test, a Web Mercator file kept metres and added a crs member until we set RFC7946=YES. |
| KML and KMZ | Vector, for display | Library of Congress (description dated 4 August 2022): longitude and latitude are decimal degrees on WGS 84. KMZ is the zipped form. |
| GeoTIFF | Raster | GDAL: georeferencing is a tiepoint and pixel size, a matrix or control points. Cloud Optimized GeoTIFF has its own driver. BigTIFF handles files over 4 GB. |
What goes wrong with coordinate reference systems?
Most errors come from four things: units, projection, datum and axis order. Measure in a projected CRS in metres and store in WGS 84.
- Degrees are not metres. A geographic CRS such as EPSG:4326 uses degrees. In our test shapely treated degrees as flat units. buffer(-15) on the lon/lat polygon returned an empty polygon.
- Web Mercator is for display. pyproj names EPSG:3857 "WGS 84 / Pseudo-Mercator". Planar area in it was high here (see the example).
- Datums differ. A NAD27 to WGS 84 shift depends on the transformation and grid files your tool uses, so the same point can move by different amounts. NAD83 to WGS 84 can default to no change. The EPSG registry lists a zero-shift option with an accuracy of 2 to 4 m.
- Axis order differs. EPSG:4326 lists latitude first. Feeding longitude, latitude to a transformer without always_xy returned infinity for our site. Other inputs can return finite but wrong coordinates, so check the order before you transform.
QGIS’s manual says layers are automatically transformed to the project CRS. It also says setting a layer’s CRS does not alter its data source. So a map can look right while the data are mislabelled.
Worked example: area, setback and overlap
We made a five-point site at 33°N in EPSG:4326 (longitude, latitude). The reference is its ellipsoidal area on WGS 84 from pyproj Geod, which treats edges as geodesics. That area is 76.31 ha. The coordinates are in the test details at the end of this section.
| Area method | Result | Against reference |
|---|---|---|
| EPSG:4326 raw | 0.0000736 square degrees | No metre unit |
| Square degrees × 111,320² | 91.24 ha | +19.57% |
| Square degrees × 111,320 × (111,320 × cos of centroid latitude) | 76.52 ha | +0.28% |
| EPSG:3857 planar | 108.79 ha | +42.57% |
| EPSG:32614 (UTM 14N) planar | 76.26 ha | -0.06% |
| EPSG:5070 (NAD83 / Conus Albers, equal area) | 76.31 ha | -0.0001% |
The UTM result is low because its linear grid scale at the centroid is 0.99971 (area scale 0.99942). UTM 14N covers 102°W to 96°W per the EPSG data in pyproj. EPSG:5070 uses NAD83, not WGS 84. In our test, PROJ’s default treated the two datums as the same. So no datum shift entered that result.
The setback is an inward 15 m buffer. The metre buffer in UTM gave 71.23 ha of usable land (areas measured on the ellipsoid). Converting 15 m to 0.000135 degrees and buffering in EPSG:4326 gave 71.55 ha (+0.45%). A point test shows why: that degree buffer reached 12.59 m east-west and 14.94 m north-south. A true 15 m UTM circle measured 15.004 m on the ground, because of the linear scale.
The synthetic constraint polygon is 17.48 ha and stands in for a flood zone. It overlapped the site by 14.55 ha, found by intersecting in UTM. The table compares ways of measuring that overlap.
| Overlap method | Result | Against reference |
|---|---|---|
| Intersect in UTM | 14.55 ha | Reference |
| Intersect in lon/lat, measure on the ellipsoid | 14.548 ha | Matches |
| Square degrees × 111,320² | 17.39 ha | +19.57% |
| EPSG:3857 planar | 20.74 ha | +42.57% |
So storing degrees was fine, but measuring in them was not.
With the placeholder 15 m setback, the land left after removing the overlap depends on the method too.
| Setback and area method | Land left | Against reference |
|---|---|---|
| Metre buffer in UTM | 57.07 ha | Reference |
| Degree buffer, area measured on the ellipsoid | 57.39 ha | +0.56% |
| Degree buffer and square-degree area | 68.62 ha | +20.24% |
About 19.6 of those 20 points come from the area unit, not the buffer.
Test details. Site coordinates (longitude, latitude): (-100.0050, 32.9970), (-99.9940, 32.9975), (-99.9935, 33.0030), (-99.9990, 33.0045), (-100.0055, 33.0025). We ran the tests in Python with shapely, pyproj, geopandas and GDAL 3.12.4.
How far off is a degree-based measurement at my latitude?
At 33°N one degree of longitude is about 93 km and one of latitude about 111 km, so a degree-based length or area is wrong. Part 1 gives the ground length of a degree at your latitude. It also converts degrees and metres. Part 2 shows what Web Mercator and the degree method do to an area. Results are for a small site.
How solar software handles GIS
Only QGIS and ArcGIS document CRS or unit handling on the pages read. The three siting platforms name layers but not how they measure distance or area.
| Software | Layers or functions the page names | CRS or unit handling documented? | Page read |
|---|---|---|---|
| QGIS | Desktop GIS. Transforms layers to the project CRS automatically | Yes: project and layer CRS, default datum transformation | QGIS 3.44 manual, last updated 30 October 2026 |
| ArcGIS (Esri) | Buffer tool with planar and geodesic options | Yes (see the ArcGIS note below the table) | Esri Buffer tool page, undated |
| PVcase Prospect | "More than 250" US nationwide layers. Grid infrastructure, parcels, topo and slope, flood zones, wetlands | Not stated | PVcase help, updated 2 December 2025. US-only features page, 13 February 2026 |
| Pivvot | Parcels, transmission lines and substations, slope, hydrology, endangered species, land cover | Not stated | Pivvot blog post, undated (checked October 2026) |
| Solargis Prospect | Elevation, slope and azimuth map layers (3 arc-second DEM) | Not stated | Solargis knowledge base, updated 25 September 2026 |
ArcGIS note: planar is the default, with an automatic option that picks the method from the input CRS. A distance with no unit uses the input’s linear units (degrees for EPSG:4326). With a geographic input and a linear-unit distance, geodesic buffers are created. A geodesic option works for any input CRS.
Not stated means the pages read do not mention it. To compare platforms with prebuilt layers, see the best solar site selection software.
Common mistakes with GIS
FAQs
Which CRS should I use to measure a solar site?
Use a projected CRS in metres that covers the site, such as the UTM zone or a national grid. For a very large site or a strict area rule, use an equal-area CRS or an ellipsoidal calculation. Say which CRS you used on the drawing.
Can I buffer a setback in EPSG:4326?
Only if your tool buffers geodesically. In our test shapely did not: it used degrees as flat units. Reproject to metres, buffer, then convert back if needed.
What is the difference between EPSG:4326 and EPSG:3857?
EPSG:4326 is WGS 84 latitude and longitude in degrees. EPSG:3857 is a projected web-map CRS in metres that stretches areas away from the equator. In our synthetic test it overstated area at 33°N (see the example).
Shapefile or GeoJSON for sharing site boundaries?
GeoJSON is a single file with a defined CRS and no field-name limit. A shapefile is a set of files and is still widely accepted. Send the .prj with it.
Related terms
- Land parcel data: ownership and boundary records.
- Topography and terrain modelling: slope and aspect from elevation grids.
- Keep-out zone: areas where no equipment may go.
Next step: compare how platforms bundle parcel, flood, slope and grid layers in the best solar site selection software.
Sources
- Concepts and formats. USGS, What is a GIS? (updated 29 January 2025). IETF RFC 7946, The GeoJSON Format (August 2016). Library of Congress, Esri Shapefile. Library of Congress, KML and KMZ. GDAL, GeoTIFF driver.
- Layers. PVcase, quality GIS data for site selection (9 December 2024). Pivvot, 6 data sources. Solargis, terrain models. FEMA, National Flood Hazard Layer. USGS, PAD-US 4.
- Software. QGIS 3.44, working with projections (updated 30 October 2026). EPSG registry, NAD83 to WGS 84 (1). Esri, Buffer tool. PVcase Prospect nationwide layers. PVcase Prospect US-only features.
- Model. All site numbers are synthetic.
Last updated 30 October 2026. Next scheduled review: 30 January 2027.