Key takeaways
- Worked example (invented 13.2 mm sensor camera): a 2 cm GSD needs a flight height of about 73 m.
- With 75% front and 60% side overlap, each ground point shows up in about 10 photos.
- Example: the more two neighbouring photos overlap, the worse their best-case height error. It grows from 2.0 × GSD at 75% overlap to 5.0 × GSD at 90%.
- Pix4D says absolute accuracy cannot be higher than the accuracy of image geolocation or ground control. Test it with independent checkpoints.
- Six example checkpoints give a 3.7 cm RMSE. That is too few to prove accuracy. ASPRS raised its minimum to 30 checkpoints in 2024.
To turn drone photos into a site model in software, see the best solar site survey apps.
Drone site survey at a glance
A drone survey makes measurable 3D data from ordinary photos. Quality depends on overlap, pixel size and ground control.
| Item | Detail |
|---|---|
| Flight height | GSD × focal length ÷ pixel pitch |
| Photo base | Footprint × (1 − overlap) |
| Ideal depth error | Pixel error × GSD × (height ÷ base), our derivation from USACE Eq. 10-14 |
| Unit and typical range | Height in m, GSD in cm per pixel, accuracy as RMSE in cm. Pix4D, relative accuracy of a precisely georeferenced project: 1-2 × GSD horizontally and 1-3 × GSD vertically |
| Where it matters | Site plan, terrain, obstruction heights, earthworks and as-built records |
| Standard | No standard for solar drone surveys was found. ASPRS Positional Accuracy Standards, Edition 2, Version 2 (2024), sets how accuracy is tested and reported |
| In software | Photogrammetry tools process the photos. Design tools may import or build a model |
Why does a drone site survey matter for installers?
It gives measured heights and ground shape for a site you may not walk.
DroneDeploy’s renewable energy page says teams can "use up-to-date terrain and layout maps to plan access roads, arrays and cable routes". A 3D solar model built from wrong heights gives wrong shade. Ground rise changes row pitch in terrain modelling. For the wider process, see site survey and remote site assessment.
See orthomosaic for the finished map, LiDAR for laser surveys and drone inspection for thermal flights.
How do overlapping photos become a surface model?
Software finds the same points in many photos. It solves where each camera was. Then it measures depth by intersecting rays. Dense matching works on points seen in at least 3 photos. The steps follow the GIS&T Body of Knowledge entry on structure from motion (SfM).
- Detect features. The software finds keypoints in every photo. The entry names SIFT as the most widely used method.
- Match keypoints. It looks for the same point in several photos.
- Run a bundle adjustment. This solves camera positions, lens settings and keypoint 3D positions together. The result is a sparse point cloud in an arbitrary coordinate system.
- Georeference. Ground control points (GCPs) fix the model to real coordinates. So do camera positions from an onboard GNSS receiver.
- Densify. Multi-view stereo builds a dense point cloud. The entry says it covers each object point that "appears in at least three overlapping images".
PIX4Dmatic’s Quick Start lists the outputs in order: dense point cloud, optional mesh, digital surface model (DSM), orthomosaic. A DSM is a height map of the surface the camera sees, including tree tops and roofs.
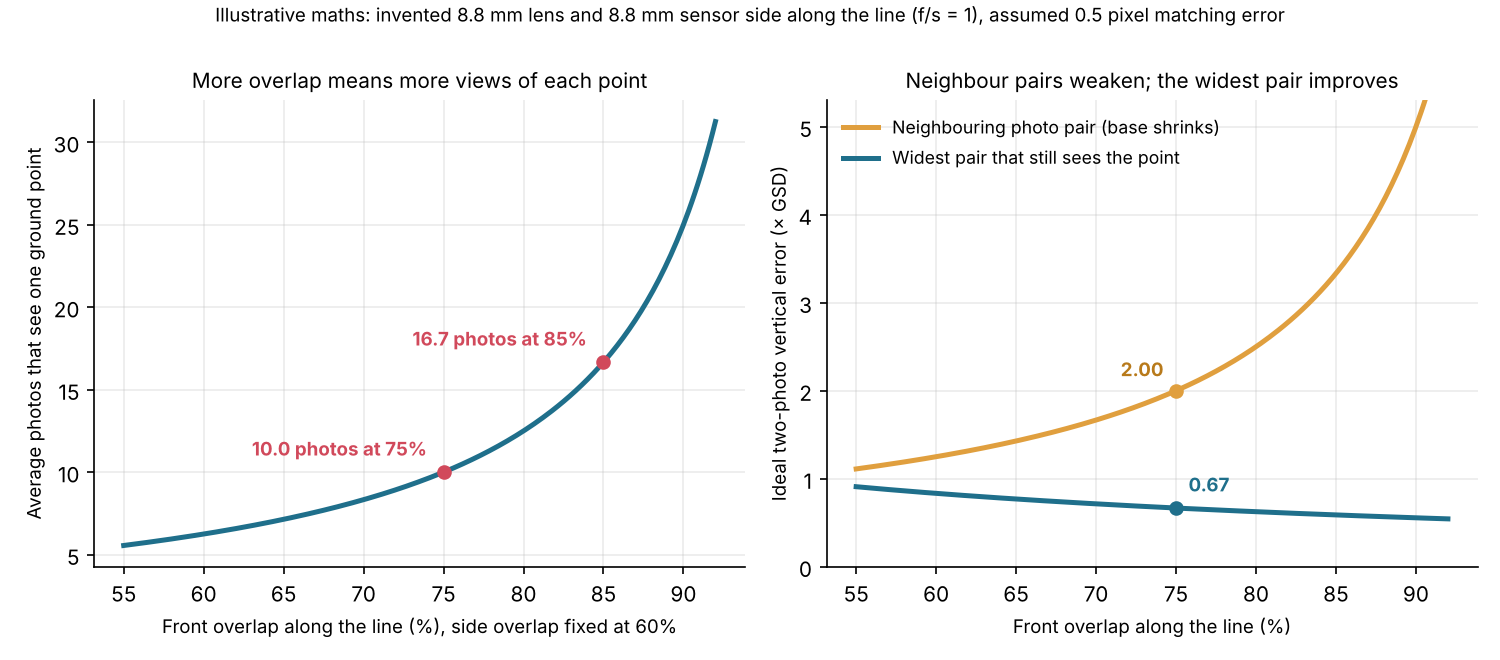
Figure 1. In our example, 75% front overlap puts each point in about 10 photos. The best two-photo depth error is 2.0 × GSD for neighbours and 0.67 × GSD for the widest pair.
How do you work out flight height and photo spacing?
Start from the GSD the job needs. Then solve for height. Pix4D says the required GSD "will define the distance (flight height) at which the images have to be taken".
- Pixel pitch = sensor width ÷ image width in pixels.
- Flight height = GSD × focal length ÷ pixel pitch.
- Footprint = image pixels × GSD, along and across the line.
- Photo base = along-line footprint × (1 − front overlap). Line spacing = across footprint × (1 − side overlap). USACE EM 1110-1-1000 prints these as B = G(1 − E/100) and W = G(1 − S/100).
- Trigger interval = base ÷ speed.
- Motion blur in pixels = speed × exposure time ÷ GSD.
The orthomosaic page works forward from a height to a GSD and photo count. This page works backwards from a target GSD. Every input below is example unless a source is named.
| Item | Value and basis |
|---|---|
| Camera | Example 1-inch-class example: sensor 13.2 × 8.8 mm, lens 8.8 mm, 5472 × 3648 pixels. Long side across the lines |
| Target GSD | 2.0 cm per pixel (example) |
| Overlap | 75% front, 60% side (Pix4D general-case minimum, used as the plan) |
| Speed and shutter | 8 m/s and 1/1000 s (example) |
| Pixel pitch | 13.2 mm ÷ 5472 = 2.41 µm |
| Flight height | 0.02 m × 8.8 mm ÷ 2.41 µm = 73.0 m |
| Footprint | 109.4 m across by 73.0 m along |
| Photo base and line spacing | 73.0 × 0.25 = 18.2 m. 109.4 × 0.40 = 43.8 m |
| Trigger interval | 18.2 ÷ 8 = 2.28 s |
| Motion blur | 8 m/s × 1/1000 s = 8 mm = 0.40 pixel |
The drone inspection page covers US height limits.
Why does overlap matter, and how much do you need?
Overlap does two jobs. It puts each point in several photos so software can match it. It also sets the base that fixes depth.
| Source | Overlap guidance |
|---|---|
| Pix4D, Image acquisition (no date printed, © 2026) | At least 75% frontal and 60% side for a general grid. 80% both ways for flat agricultural fields. 85% for forest and dense vegetation |
| Aurora Solar help, Drone Mapping (stamped 1 October 2026) | "Keep 60-80% overlap between shots", circling a roof at about 30 m. |
| USACE EM 1110-1-1000, chapter 10 (31 March 1993) | For film aerial mapping, end lap typically 60% (minimum 55%) and side lap typically 30% (minimum 20%). Two-photo stereo, not modern SfM |
The companies differ because a site grid and a roof orbit are different jobs.
The USACE chapter prints parallax height as h = H − fB/p (Eq. 10-14). It warns that "small errors in parallax will cause large errors in the vertical distance". Our derivation from that equation gives sigma_Z = H² sigma_p / (f B). At ground level it becomes: ideal depth error = k × GSD × H/B. Here k is the assumed error in the measured parallax, in pixels. B is the base between the two photos.
| Front overlap (side 60%) | Photos per point | Neighbour pair: depth error | Widest pair: depth error |
|---|---|---|---|
| 60% | 6.3 | 1.25 × GSD | 0.83 × GSD |
| 75% | 10.0 | 2.00 × GSD | 0.67 × GSD |
| 85% | 16.7 | 3.33 × GSD | 0.59 × GSD |
| 90% | 25.0 | 5.00 × GSD | 0.56 × GSD |
Basis: an example camera. The lens is 8.8 mm and the sensor side is 8.8 mm along the line. We assumed k = 0.5 pixel. Photos per point = 1 ÷ ((1 − front) × (1 − side)), an average over the site.
The widest pair has a base of about front overlap × footprint. Its numbers assume matching error does not grow with baseline. It does, so treat them as best case for two photos. Real software matches each point in many photos, so they are not software results.
Ground rise also erodes overlap. The orthomosaic page works that example. Pix4D’s 1-3 × GSD vertical figure (relative accuracy) is the better planning number.
What decides accuracy: ground control and checkpoints?
Photos give a relative model. Control fixes where it sits on Earth. Checkpoints test it.
- Relative and absolute: Pix4D gives a relative error (between points inside the model) of 1-3 × GSD. The horizontal and vertical figures in the glance table are also relative errors, for a precisely georeferenced project. Pix4D also says absolute accuracy "cannot be higher than the accuracy of image geolocation, or GCPs’ accuracy".
- GCP layout: DroneDeploy (help updated 24 March 2026) says to spread GCPs across the whole area. Do not cluster them. If elevation changes a lot, add points at the highest and lowest spots. The orthomosaic page lists GCP counts.
- Checkpoints: these are surveyed points the software does not use. DroneDeploy says they give an unbiased check. A LIDAR Magazine overview of the ASPRS standard says checkpoints should be independent of the control. It calls reuse of control a biased test.
- How many: ASPRS Edition 2, Version 2 (adopted 24 June 2024) raised the minimum for product accuracy assessment. It went from 20 to 30 checkpoints. The LIDAR Magazine overview adds that small jobs may use fewer checkpoints, and the report should say the count was reduced.
RMSE is the square root of the mean of the squared residuals. Residual = product height minus surveyed height. This example’s six checkpoints give residuals of 3.1, 5.2, −1.8, 4.4, 2.7 and 3.9 cm.
| Statistic | Value (example residuals, cm) |
|---|---|
| RMSE | 3.69 |
| Mean (bias) | +2.92 |
| Standard deviation | 2.48 |
| Largest residual | 5.20 |
Most of the 3.7 cm is a one-sided offset, our reading, not random noise. Report the mean as well as the RMSE, as the ASPRS overview advises. Six points are well short of 30, so this proves little.
Drone survey planner calculator
Enter your camera, target GSD, overlaps, speed and shutter. It returns flight height, spacing, trigger interval, blur, photos per point and ideal depth error. Paste checkpoint residuals to get RMSE and bias. It is not a flight plan and knows no local height limits.
How solar software handles drone photogrammetry
Pix4D and DroneDeploy document control points and checkpoints. The Aurora Solar and Scanifly pages do not.
| Software | Builds a model from drone photos? | Control points and checkpoints? |
|---|---|---|
| Pix4D | Yes | Yes |
| DroneDeploy | Partly | Yes |
| Aurora Solar | Yes, roof scale. Page says not survey-grade | Not stated |
| Scanifly | Partly | Not stated |
Partly: the page covers some of the job. Not stated: the company page we cite does not say. Roof scale: a model of one roof, not a whole site.
Pix4D
- Control points and checkpoints: GCPs and checkpoints can be marked. A Quality Report is an export
- What the page read says: PIX4Dmatic: calibration, dense point cloud, optional mesh, DSM, then orthomosaic. Adding GCPs and checkpoints is "optional but recommended"
- Source and date: Quick Start Guide, no date printed, © 2026. Read October 2026
DroneDeploy
- Control points and checkpoints: help covers GCPs and checkpoints
- What the page read says: Solutions page names "orthos and 3D models for design and as-builts" and "automated GCP handling". It does not describe how the model is built
- Source and date: Help updated 24 March 2026. Solutions page no date, © 2026. Read October 2026
Aurora Solar
- What the page read says: "Aurora builds a custom LIDAR source, a 3D mesh, and a scaled top-down map image from your images."
- Limits: it says to treat the mesh as "a strong visual reference, not a survey-grade measurement". Build, Grow and Scale plans only
- Source and date: Drone Mapping help, stamped 1 October 2026. Read October 2026
Scanifly
- What the page read says: A company blog says photogrammetry combines overlapping photos into a 3D model. The product page says DroneDesign creates a "photorealistic 3D model". The blog does not mention GCPs or RTK
- Source and date: Blog published 21 April 2026, modified 23 April 2026. Product page modified 24 June 2026. Read October 2026
Our orthomosaic page rates some of the same tools differently, because it asks another question. Apps that build site models from photos are ranked in the best solar site survey apps list. Thermal fault-finding tools are in the best solar drone inspection software list.
Common mistakes with drone site surveys
FAQs
How accurate is drone photogrammetry?
Pix4D says relative accuracy is 1-2 × GSD horizontally and 1-3 × GSD vertically once a project is precisely georeferenced. At an example 2 cm GSD, that is 2-6 cm vertically. Absolute accuracy cannot beat the geolocation or the control. Test it with checkpoints.
How much overlap does a solar site need?
Pix4D gives at least 75% frontal and 60% side for general cases. It gives at least 85% for forest and dense vegetation. Aurora gives 60-80% for a roof orbit. More overlap means more photos per point and more processing.
Is photogrammetry better than LiDAR?
Not always. Photogrammetry matches points seen in several photos, so it needs visible surface texture and good light. LiDAR times laser pulses instead. We found no source comparing their accuracy on solar sites. See LiDAR for point density and its limits.
Is a drone survey the same as a drone inspection?
No. A survey turns overlapping photos into a measurable model for design. An inspection uses thermal images to find faults on built arrays. See drone inspection for that side.
Is an RTK drone enough without ground control points?
Often, if your equipment is reliable: Wingtra says that with RTK or PPK you "may not need any" GCPs. Pix4D lists RTK or PPK drones or GCPs as routes to centimetre-grade accuracy. Either way, keep independent checkpoints.
Do I need ground control points?
Yes, unless the drone has RTK or PPK. Wingtra describes standalone GPS-grade accuracy as "a few meters", and GCPs are meant to beat that. Spread GCPs across the whole area.
Related terms
- Orthomosaic: the stitched, to-scale image map.
- LiDAR: a laser survey.
- Aerial imagery: top-down images.
- Site survey: the check before design.
- 3D solar modelling: a scaled site copy for shade.
Next step: run your flight height and checkpoint RMSE in the planner above, then compare apps that build the model in the best solar site survey apps.
Sources
All pages checked October 2026.
- Pashaei and Starek, Structure-from-Motion Photogrammetry, GIS&T Body of Knowledge (1st Quarter 2024 edition, DOI 10.22224/gistbok/2024.1.2).
- US Army Corps of Engineers, EM 1110-1-1000, chapter 10, Principles of Photogrammetry (31 March 1993). Equations are taken from a text extract of the PDF.
- Pix4D, Image acquisition, What is the relative and absolute accuracy of drone mapping? and Quick Start Guide PIX4Dmatic (no dates printed, copyright 2026).
- DroneDeploy, Best Practices for GCPs and Checkpoints (updated 24 March 2026) and DroneDeploy, renewable energy (no date printed).
- Aurora Solar help, Drone Mapping (stamped 1 October 2026).
- Scanifly, What is photogrammetry (published 21 April 2026, modified 23 April 2026) and Scanifly PV design (modified 24 June 2026).
- ASPRS, Edition 2, Version 2 announcement (28 June 2024, re-read 30 October 2026).
- Wingtra, Ground control points guide (checked 30 October 2026).
- LIDAR Magazine, Overview of the ASPRS Positional Accuracy Standards (no article date printed).
Last updated 30 October 2026. Next scheduled review: 30 January 2027.