Key takeaways
- The handbook plans 1 hectare of island and 1.7 hectares of water per MWp. An invented 5 MWp plant needs 8.5 hectares, 2.1% of an example 400-hectare reservoir.
- Water, not soil, drives siting. Depth, water-level change and bed conditions shape the mooring, and some places allow only bank anchoring.
- No single cooling gain holds. The handbook estimates about 1%, a model gives 0.5 to 3%, and two Norwegian strings differed by 5 to 6%.
- Wind decides the sign. In example calm air, three of the seven air-cooled coefficient sets run hotter than the land default.
- Of three tools read, PV*SOL sets floating PV cells 20 K above ambient at 1,000 W/m² (22 K for free-standing mounts). Solargis lists support without detail, and pvlib needs your coefficients.
To model cell temperature and yield for a floating plant, see the best solar simulation software. For plant layout and siting at scale, see the best utility-scale solar design software.
Floating solar at a glance
Floating solar is a ground-mount plant moved onto water. The modules are alike. The site, the mooring and the cooling claims are not.
| Item | Detail |
|---|---|
| What it is | PV on floats or a floating membrane, moored to the bed or the bank. Inverters can sit on a float or on land. |
| Area | Handbook ratio: about 1 hectare of floating island and 1.7 hectares of water area per MWp, with anchoring. |
| Typical design limits | The handbook says most plants use a tilt of 15 degrees or less. It says sites are best at 15 m depth or less, with minimum water-level variation. |
| Standard or rule | No single standard covers the term. A company article cites DNVGL-RP-0584 and Bureau Veritas NR493 for mooring design. Permit rules are national or local. |
| In software | Temperature and yield models can take floating inputs. See the software table for what each tool states. |
Why does floating solar matter for installers and developers?
It opens sites where land is scarce or contested. The 2019 World Bank market report points to dense countries where land uses compete. It calls pairing with hydropower plants of particular interest.
It also changes the design inputs, not just the site. Tilt, wind and wave loads, water-level range, access and permits all differ from those of a solar farm on land. Cooling claims are the least settled input. Test them before they reach a yield model.
How does siting a floating plant differ from siting on land?
A ground survey becomes a water survey. Bathymetry (water depth), water-level range, wave exposure and water surface ownership replace slope, soil bearing and parcel lines.
| Factor | Floating plant | Source |
|---|---|---|
| Area | 1 hectare island and 1.7 hectares of water per MWp. See solar farm for land per MWdc. | Handbook, 2019 |
| Bed and bathymetry | Bathymetry helps pick the island position. Some locations allow only bank anchoring. | Handbook. Ciel and Terre, 10 September 2025 |
| Water-level change | Mooring must allow for it. Designs cover the lowest, highest and middle levels. | Handbook. PV Tech, February 2019 |
| Loads | Wind and waves. Waves matter little on small shallow water and a lot on large deep reservoirs. Compare structural loads on land. | PV Tech, February 2019 |
| Tilt | The handbook says most plants use "tilt angles not greater than 15 degrees". See tilt angle. | Handbook |
| Access and O&M | Layouts must allow safe installation and maintenance. Small near-shore plants can keep inverters on land. | PV Tech, February 2019 |
| Permits and record | Permitting can take "from a few months to several years in some extreme cases". Water surface ownership is often unclear. | Handbook, 2019 |
- Bed and bathymetry: a company article lists bed soil, bathymetry and water level as anchoring inputs. It names bottom, bank and hybrid methods.
- Water-level change: the handbook says "Greater depths and water-level variations will require more complex and costly anchoring and mooring solutions." Line angles change with level.
- Loads: on inland water, peak wave and wind loads can hit together.
- Permits and record: natural lakes are generally harder than artificial ponds. Most projects had only several years of operating data.
The handbook and the PV Tech article date from 2019 and February 2019. Check current local rules and newer field data. A floating solar company wrote the Ciel and Terre article.
Does floating solar run cooler, and what do the studies show?
Cooling is sometimes real, but the amount depends on the float type, the wind and the comparison. The five sources below measure different things. Do not average their figures.
| Source | What was measured or modelled | Limits |
|---|---|---|
| World Bank handbook, 2019 (Box 3.2) | Singapore Tengeh testbed, as cited from Liu et al. 2018. | One testbed and one climate. The 1% is a calculated sensitivity. |
| Kjeldstad et al., Solar Energy 2021 | Norway pilot, 6.48 kW: a string resting on a membrane against a string raised 32 mm. April to September 2019. | Both strings float, so there is no land comparison. Module temperature data cover May and June only. Wind was 0 to 1 m/s. |
| Dörenkämper et al., Energies 2024 | Three Dutch floating systems (about 50 kWp, 50 kWp, 2.1 MWp), each studied for 9 to 12 months. | In the modelled system the water did not touch the modules. Data are restricted. |
| Nysted et al., EPJ Photovoltaics 2024 | Sri Lanka pilot, about one year, with a CFD model. | One site. It does not compare yield with land. |
| Chowdhury et al., EPJ Photovoltaics 2023 | Review of reported gains, plus finite-element modelling. | The authors call the cooling poorly quantified. |
Results as printed in each source:
- World Bank handbook: measured against an adjacent rooftop, air above the water was 1 to 3 °C lower. Handbook estimate, not a measurement: raising U from 30 to 35 W/m²K lowers module temperature 2 to 3 °C. That adds about 1% energy. Table 3.1 also lists a 5 to 10% higher initial performance ratio, sourced "Authors’ compilation".
- Kjeldstad et al.: the water-contact string yielded more every month. The abstract says 5 to 6%. The conclusion says 5 to 7% (May to July).
- Dörenkämper et al.: heat-loss coefficients Uc 22.8 to 27.2 W/m²K and Uv 2.7 to 5.1 W/m²K per m/s. Water temperature added little: water sat near air temperature.
- Nysted et al.: measured Uc 22.6 W/m²K and Uv 4.9 W/m²K per m/s. The abstract says cooling is not universal. Air-cooled floating PV is not always better than open-rack ground PV.
- Chowdhury et al.: reported yield gains "from 0.11% to 31.29%". Their model gives 0.5 to 3%, with wind convection as the main cooling.
The coefficients matter because a land default has no wind term. The ambient and cell temperature page covers the models. The temperature coefficient page covers the per-degree loss.
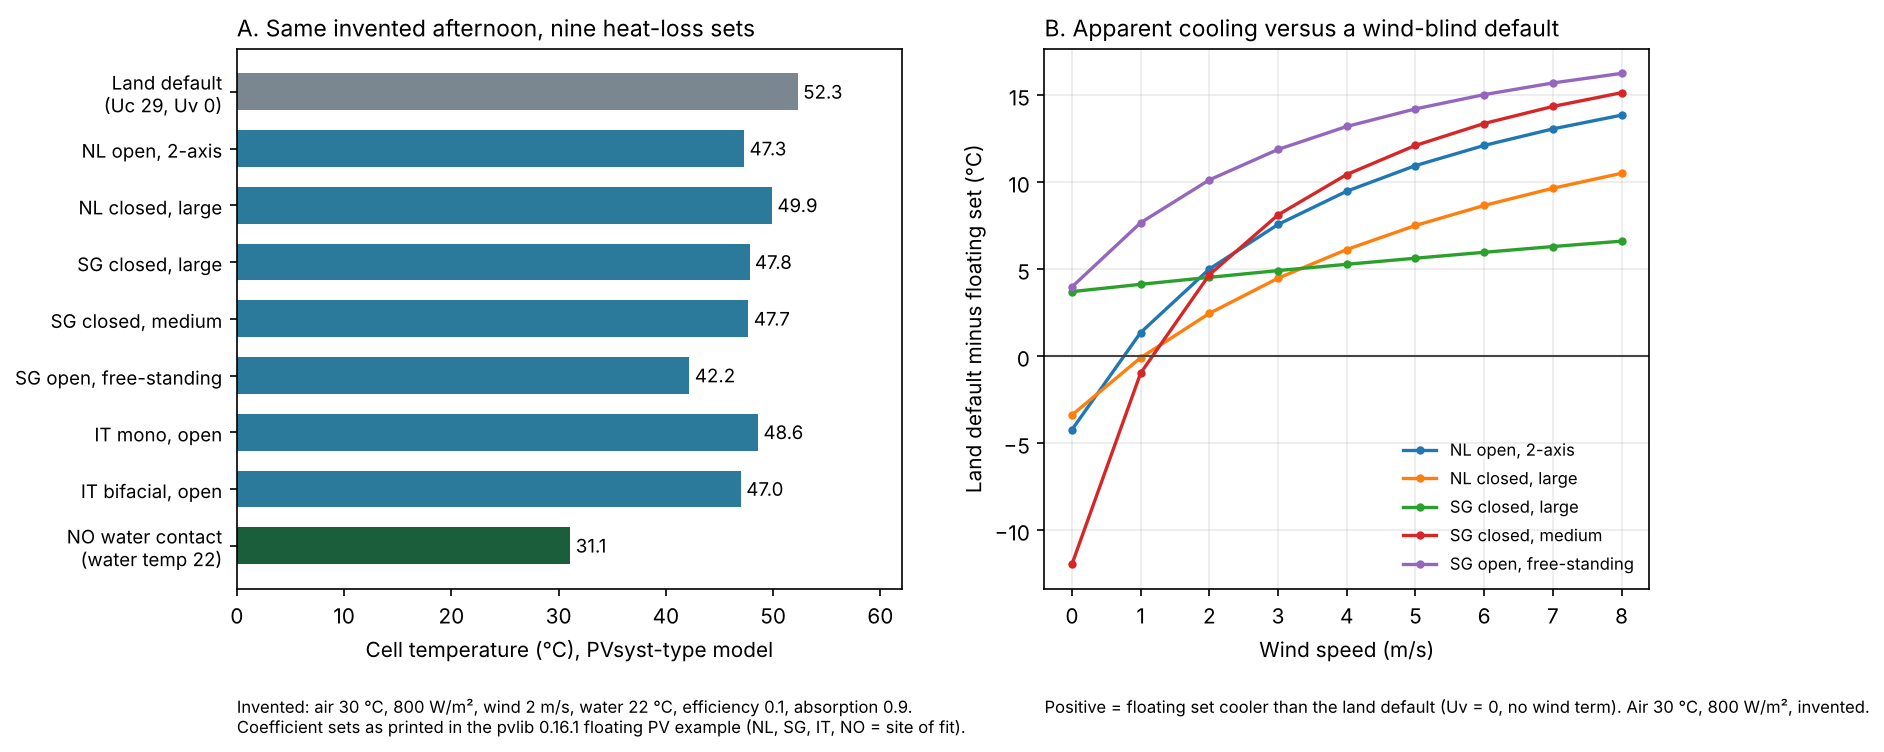
Figure 1. Under example weather, published floating coefficient sets give cell temperatures from 31.1 to 49.9 °C against 52.3 °C for the land default. Against a wind-blind default, the apparent cooling flips sign at calm for three of seven air-cooled sets.
Worked example: water area and cell temperature for an example plant
All site inputs are example. Table 1 applies the handbook ratios. Table 2 uses the coefficient sets in the pvlib 0.16.1 floating PV example. It uses a PVsyst-type model.
Table 1. Water area for an example 5 MWp plant on an example 400-hectare reservoir.
| Item | Calculation | Result |
|---|---|---|
| Floating island | 5 MWp × 1 ha | 5.0 ha (12.4 acres) |
| Water area with anchoring | 5 MWp × 1.7 ha | 8.5 ha (21.0 acres) |
| Share of the water body | 8.5 ÷ 400 | 2.1% |
Table 2 shows three of the seven air-cooled coefficient sets, plus the water-contact set. It uses example weather. Air is 30 °C, sun is 800 W/m², wind is 2 m/s and water is 22 °C. Efficiency is 0.1 and absorption is 0.9 (pvlib defaults). The example power coefficient is -0.35 %/°C. The land default is Uc 29 and Uv 0.
Table 2. Cell temperature and model output change against the land default (example weather and coefficient).
| Set (site of fit) | Cell (°C) | Cooler than default (°C) | Output change | Cooler at 0 m/s (°C) |
|---|---|---|---|---|
| Land default | 52.3 | 0.0 | 0.0% | 0.0 |
| Netherlands, open, 2-axis tracking | 47.3 | 5.0 | +1.8% | -4.2 |
| Singapore, closed, medium footprint | 47.7 | 4.7 | +1.6% | -11.9 |
| Singapore, open, free-standing | 42.2 | 10.1 | +3.5% | 4.0 |
| Norway, in contact with water (water as ambient) | 31.1 | 21.2 | +7.4% | 21.2 |
Across all seven air-cooled sets the output change runs from +0.9% to +3.5%, and three of the seven run hotter than the default at 0 m/s. The water-contact set gives +7.4% because the example water is 8 °C cooler than the air. These are model differences against a default, not measured yield gains. The pvlib page notes that the sets come from specific climates. Its example covers one day.
Check your own plant
Enter a size in MWp. Use the handbook ratios or your own. You can add a water body area. The second part takes a heat-loss set, weather and a power coefficient. It starts with the table values.
If the calculator does not load, open the floating solar calculator on its own page.
How solar software handles floating solar
None of the three tools documents mooring, float layout or bathymetry. PV*SOL names a floating temperature offset, Solargis lists floating support without detail, and pvlib needs your own coefficients. The pages were checked in October 2026. None shows a date.
| Software | Floating PV in temperature or yield? | Mooring, float layout, bathymetry |
|---|---|---|
| PV*SOL | Yes | Not stated |
| pvlib python | Partly | Not stated |
| Solargis Prospect | Partly | Not stated |
Not stated: the page read does not mention it. Partly: the tool lists or supports floating use without full detail. What each page says:
- PV*SOL: The help page "Module temperature" lists "mounted – Floating PV" with a 20 K heating offset. It lists 22 K for "mounted – free area", at 1,000 W/m². It does not mention water temperature or wind. A staff forum reply (5 November 2021, not documentation) says albedo does not change by itself.
- pvlib python: The gallery example "Temperature modeling for floating PV" (version 0.16.1) applies
pvsyst_cellwith literature coefficient sets. Eight give both Uc and Uv, and five also have Uc-only variants. It names no floating mount type. You supply the coefficients. - Solargis Prospect: The pricing page lists "Support for 1-axis tracker and floating solar" in the Professional plan. It does not say what it models. The product page read does not name floating PV.
A "Yes" means the company page names the function. Use these tools for cell-temperature and yield modelling, as listed in the best solar simulation software. For the land comparison, see utility-scale layout optimisation.
Common mistakes with floating solar
FAQs
Is floating solar more efficient than land-based solar?
Not by a fixed amount. The handbook estimates about 1% from a U-value change. A model gives 0.5 to 3%. Two floating strings in Norway differed by 5 to 6%. One review found reported gains from 0.11% to 31.29%.
Which water bodies suit floating solar?
The handbook says sites are "best deployed" at 15 m depth or less, with water level varying as little as possible. It also says that at some large hydropower plants, covering just 3 to 4 percent of the reservoir area with FPV could double the estimated installed capacity. That is a potential, not a result for every plant. The handbook’s conclusions also recommend avoiding the near-shore littoral zone, where plant and animal life may be more abundant.
Does floating solar need special permits?
Yes, expect a permit process, and rules vary by country and by water body. The handbook says permitting can take from a few months to several years in some extreme cases. It also says water surface ownership is often unclear. Ask the water and planning authorities early.
Related terms
- Solar farm: a ground-mounted PV plant built to export power to the grid.
- Ambient and cell temperature: air temperature, and the hotter cell temperature that models estimate from it.
- Temperature coefficient: the percentage power change per degree of cell temperature.
Next step: run your own float heat-loss coefficients through a cell-temperature model in the best solar simulation software.
Sources
Every page below was checked in October 2026.
- World Bank, ESMAP and SERIS, Floating Solar Handbook for Practitioners, published 28 October 2019. Text re-read 30 October 2026 in the World Bank PDF.
- World Bank, ESMAP and SERIS, Floating Solar Market Report, published 14 June 2019.
- George and Patel, PV Tech, February 2019.
- Ciel and Terre, anchoring article, 10 September 2025.
- Kjeldstad et al., Solar Energy 218, 2021.
- Dörenkämper et al., Energies 17(9), 25 April 2024.
- Nysted et al., EPJ Photovoltaics 15, 23, published 17 June 2024.
- Chowdhury et al., EPJ Photovoltaics 14, 24, published 4 August 2023.
- pvlib 0.16.1, floating PV temperature example.
- Company pages: PV*SOL help, PV*SOL forum, Solargis pricing and Solargis product page.
Last updated 30 October 2026. Next scheduled review: 30 January 2027.